A steel plant can lose hours to stoppages every week and still report them in one line: downtime, so many hours. What that line hides is the money. A stop on one unit starves the next, restarts burn energy and material, and lost tonnes carry lost margin with them. Without a cost attached to each event, maintenance budgets get argued on opinion, not evidence. Downtime cost attribution fixes this by giving every stoppage a value and an owner. Operations and finance teams can see how iFactory AI prices each stoppage on live plant data before they set next year's reliability priorities.
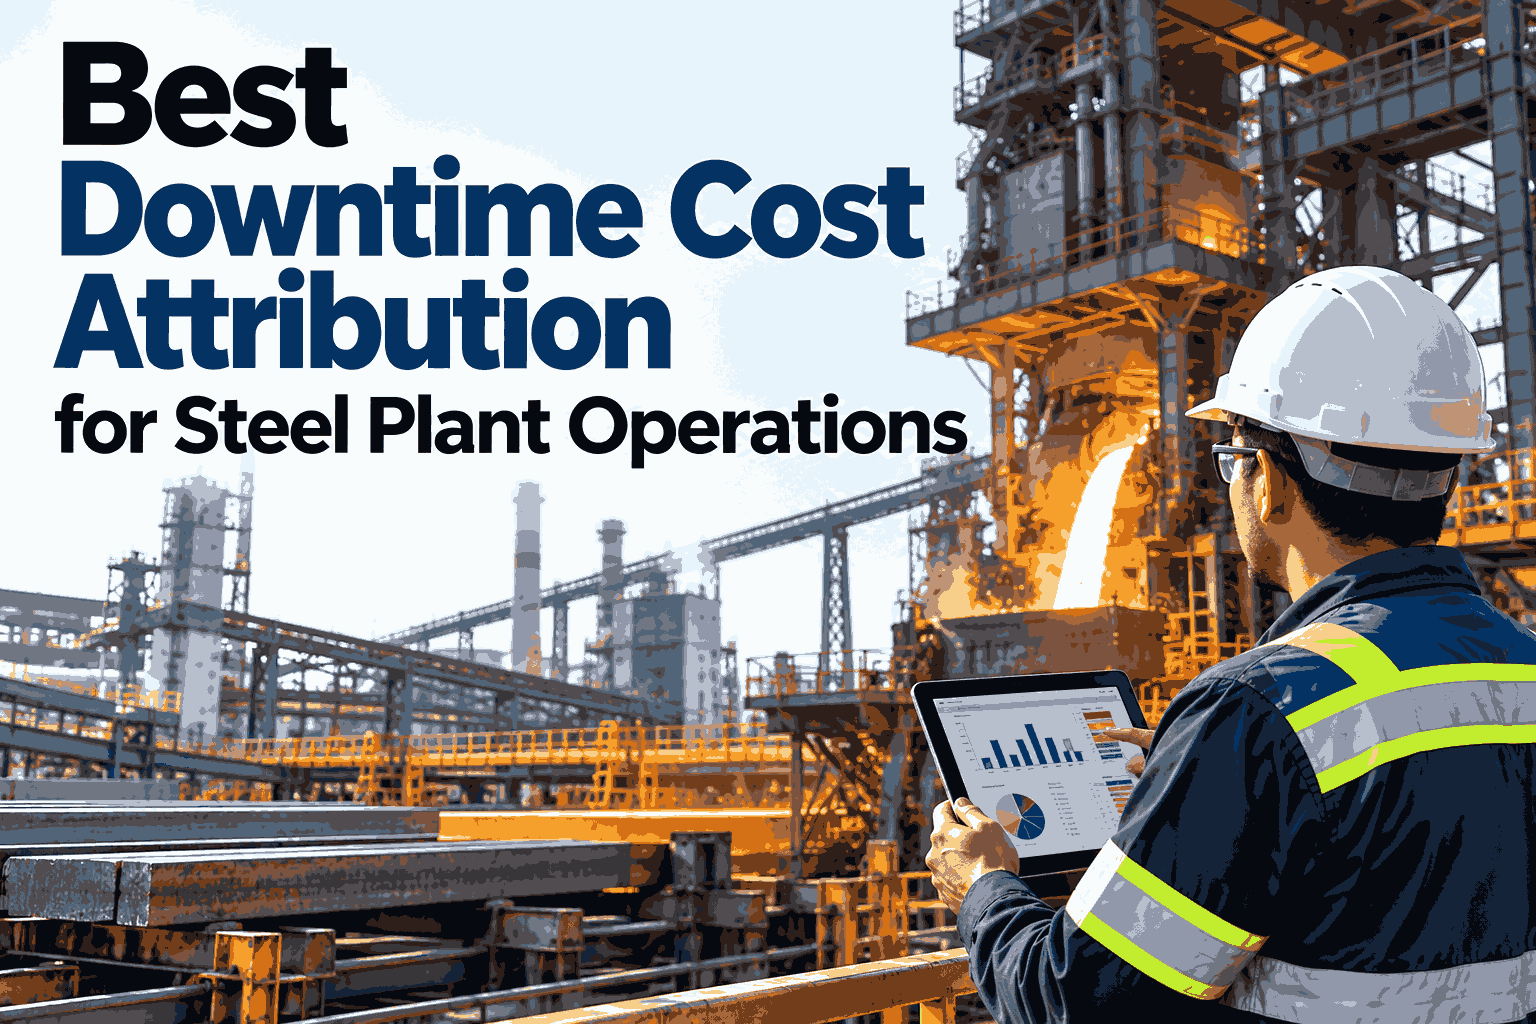
Best Downtime Cost Attribution for Steel Plant Operations
Turn hours lost into money lost, and trace every rupee back to the equipment and event that caused it.
Why Downtime Cost Stays Hidden
Most plants log stoppages for reliability, not for finance. The two records rarely meet, so the cost of a stop is guessed after the fact.
The Anatomy of One Stoppage
A single stop has three cost layers. Most plants count only the first. The example below is illustrative and uses plain units, not real plant figures.
In this example the visible loss is 72 percent of the true cost. The other 28 percent sits in restart and cascade, and it never reaches a maintenance report.
How a Stoppage Cascades Downstream
Steel processes are tightly coupled. When one unit stops, buffers run out quickly and units further along lose output too.
Original stop
Starved of liquid steel
Holds or wastes fuel
Idle or slowed
See Your Costliest Stoppages Ranked
Book a 30-minute session and iFactory AI will show how your own stoppages would be priced across lost production, restart and cascade, then ranked by cost.
Rules for Fair Attribution
Cost only helps if teams trust it. These rules keep attribution consistent, and a working session on your own event data can test each one.
| Rule | What It Means | Why It Matters |
|---|---|---|
| Originating asset | Charge cascade cost to the unit that stopped first | Prevents downstream units being blamed for starvation |
| Event, not shift | Price each stop as its own record with start and end | Makes repeat failures visible |
| Margin basis | Use one agreed value per lost tonne | Keeps events comparable across units |
| Buffer credit | Reduce cascade cost when stock covers the gap | Avoids overstating short stops |
| Planned separation | Report planned and unplanned stops apart | Stops planned outages inflating failure cost |
A Sample Cost Leaderboard
Once events are priced, ranking them changes the conversation. The list below is an illustrative example of what a monthly view looks like.
The pattern matters more than the numbers. The most frequent stop is rarely the costliest, and the fix worth funding first is often not the one with the most hours logged.
Three Levels of Downtime Maturity
Plants move up in stages. Knowing where you stand shows the next step.
Hours logged
Stop hours and cause codes, with no cost attached.
Lost tonnes priced
Lost production valued, restart and cascade still ignored.
Full event cost
All three layers priced, ranked and linked to equipment and root cause.
Where iFactory AI Fits
iFactory AI joins stoppage records, production data and cost data so each event carries a full price the moment it closes.
Automatic event pricing
Lost tonnes, restart and cascade are calculated for each stoppage without a manual spreadsheet.
Cascade tracing
Downstream losses are traced back to the originating asset, so the right team owns the cost.
Ranked by money
Events and equipment are ranked by cost, pointing maintenance spend at the biggest losses.
Ask in plain language
Managers can ask which stoppage cost most this month and receive a ranked answer with drivers.
iFactory AI arrives pre-configured on an NVIDIA server that ships racked and ready with software pre-loaded. Scope covers cabling, network, ERP and MES integration, team training and 24x7 remote monitoring.
Frequently Asked Questions
What does downtime cost attribution include?
It includes the value of lost production, the extra cost of restarting the unit, and the losses that spread to downstream units. Counting only lost production understates the true cost of most stops. You can watch a stoppage priced across all three layers in a live session.
How do you value a lost tonne?
Most plants use the contribution margin per tonne, the selling price less variable cost, because fixed cost continues whether the unit runs or not. Agreeing one basis with finance keeps events comparable. To agree yours, request a valuation working session with the iFactory AI team, or ask support for the setup guide.
How is cascade downtime assigned to the right unit?
The cost is charged to the originating asset, the first unit that stopped, not to the units that starved afterwards. Buffers and stock are credited so short stops are not overstated. This keeps accountability with the team that can prevent the event. A short product tour with your process flow shows how the chain is mapped.
What data do we need to start?
You need stoppage start and end times with equipment and cause, production rates by unit, and a margin value per tonne. Restart cost can begin as an estimate and be refined from energy and material records. See which of your systems can be connected first so early results arrive within weeks.
How does this help maintenance planning?
Ranking stops by cost shows which failures deserve preventive work, spares or redesign, and which are cheap enough to accept. Maintenance budgets can then be argued with a value attached to each proposed fix. Schedule a walkthrough of cost-ranked maintenance priorities to see how the case is built.
Put a Price on Every Stoppage
iFactory AI attributes lost production, restart and cascade cost to the equipment and events behind them. Book a walkthrough to see it on your own plant.