The 2026 global steel landscape is defined by the "Double Mandate"—achieving rapid decarbonization while maintaining world-class operational availability. To remain competitive in an era of EU CBAM and surplus global capacity, steel plant leaders must benchmark their maintenance and analytics operations against the industry's top decile. This report synthesizes data from 140+ integrated and EAF facilities to establish realistic yet aggressive KPIs for maintenance cost per ton, availability, and digital maturity. Book a Demo to compare your plant’s live performance against these global benchmarks.
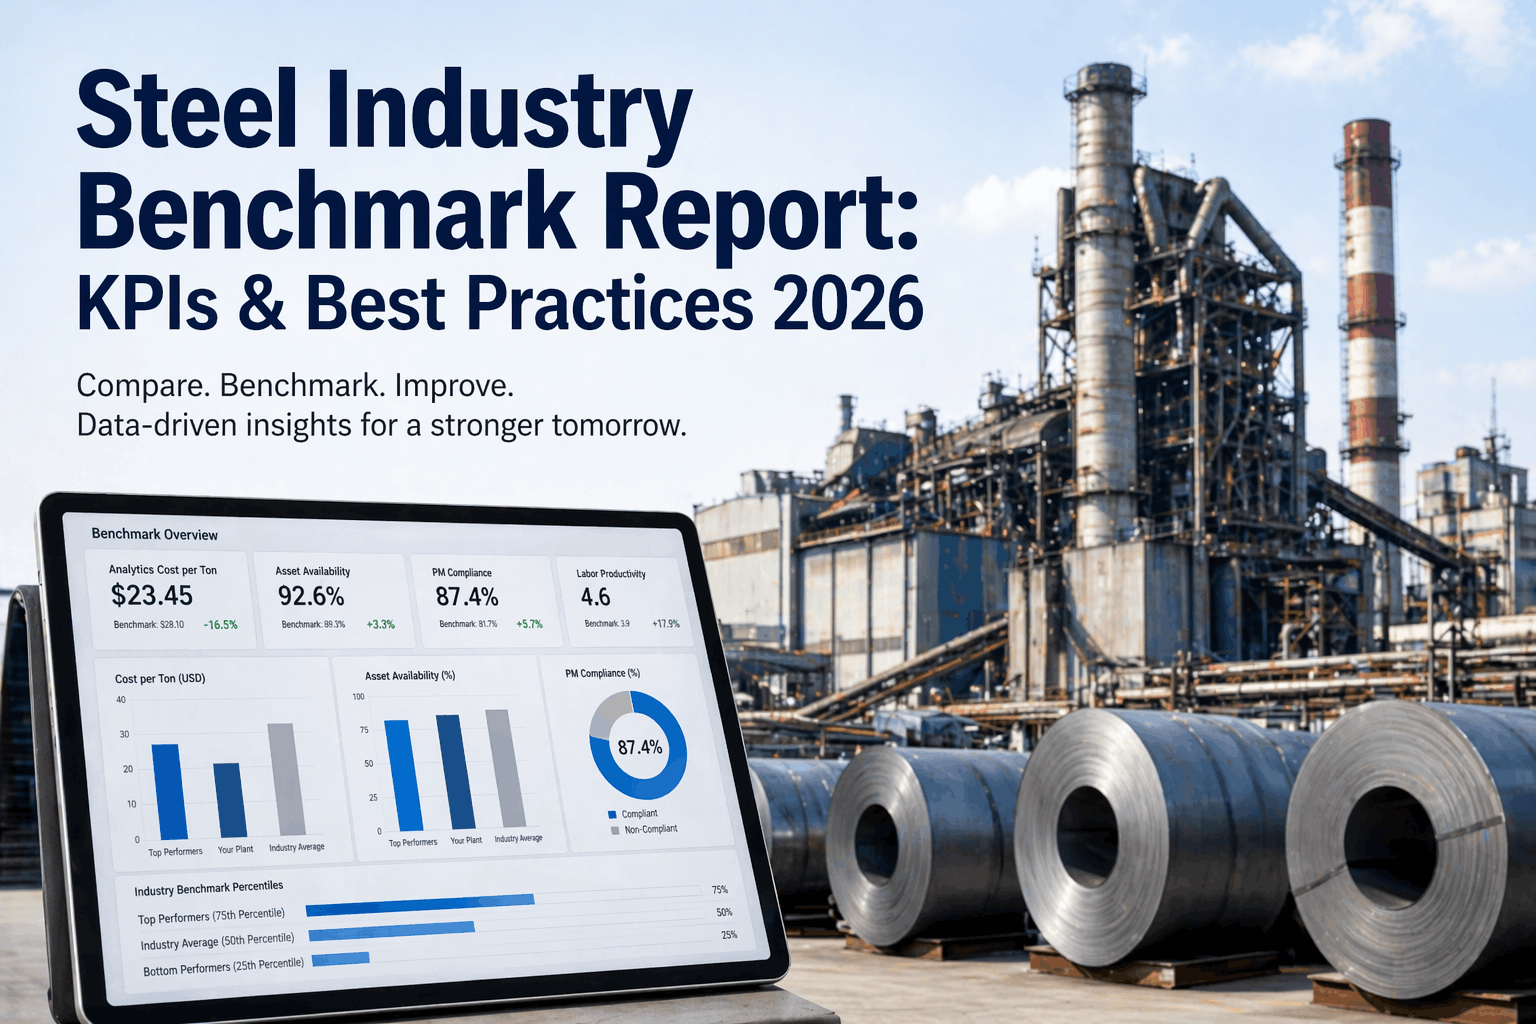
Steel Industry Analytics Benchmark: The 2026 Target Guide
Establish world-class targets for your mill with data-driven KPIs across Integrated and Mini-Mill operations.
The Performance Gap: Top 10% vs. Industry Average
Analysis of global steel production shows that the "Top Decile" of plants spend nearly 40% less on maintenance and repairs per ton of crude steel than the industry average. This isn't due to lower labor rates, but rather a shift toward **AI-driven condition monitoring** and hyper-efficient outage planning. While the industry average for Integrated mills sits at ~$58/ton, world-class operators are consistently achieving <$45/ton by eliminating "hidden" downtime and optimizing contractor utilization during relines. Audit your current cost/ton baseline with iFactory's benchmarking tool.
2026 Benchmark Matrix: Integrated vs. EAF Operations
KPI targets vary significantly based on furnace technology and product mix. These benchmarks represent the 2026 "World-Class" targets for high-performance steel operations.
| Benchmark Metric | Integrated Mill Target | EAF / Mini-Mill Target | Impact of AI Integration |
|---|---|---|---|
| Maint. Cost per Ton (Crude) | $40 – $48 | $28 – $35 | 12–18% Cost Reduction |
| Primary Asset Availability | 95%+ (BF/Coke) | 92%+ (Furnace) | +3% Production Uptick |
| Emergency Work % | <8% | <5% | Reduced Safety Risk |
| Staffing Ratio (Asset/Tech) | 45:1 | 32:1 | Higher Tool-Time % |
| Inventory Accuracy | 98%+ | 99%+ | Eliminated Stockouts |
| MTTR (Critical Assets) | <4.0 Hours | <2.5 Hours | Accelerated Response |
Digital Maturity: The Steel Operations 2026 Scale
Where does your mill fit on the digital evolution curve? Most global operations are currently attempting the transition from Level 2 to Level 3.
The Benchmark Audit Journey
Closing the gap between your current performance and world-class benchmarks requires a structured 4-phase audit and optimization cycle.
Automated Data Normalization
Connect iFactory to your existing CMMS and SCADA historians. We normalize your raw data to ensure apples-to-apples comparison against global steel cost/ton standards.
Gap Analysis & Criticality Mapping
Identify exactly which assets (e.g., Blast Furnace stoves, Rolling Mill hydraulic packs) are falling below the industry availability benchmark. Prioritize by financial impact.
Condition-Based Strategy Deployment
Transition critical assets from time-based maintenance to condition-based monitoring. Establish the threshold alerts that precede OEE degradation.
Continuous AI Benchmark Sync
iFactory continuously monitors your KPIs against our global anonymized dataset — alerting you the moment your mill slips below "World-Class" performance levels.
Steel Benchmarking FAQ: Expert Insights
Why is "Maintenance Cost per Ton" the primary benchmark?
In the commodity steel market, yield efficiency and cost discipline are the only true levers for margin. Maintenance cost per ton integrates labor efficiency, spares management, and unplanned downtime costs into a single, high-stakes financial metric.
What is considered a "World-Class" PM compliance rate?
For primary metallurgical equipment, the 2026 target is ≥94%. A compliance rate below 90% is a statistically proven leading indicator of catastrophic equipment failure and emergency repair spikes within the following 6-month cycle.
How does EAF availability differ from Integrated Mills?
EAF (Electric Arc Furnace) operations tend to have lower availability targets (~92%) due to the high-intensity thermal stresses and shorter, more frequent maintenance intervals compared to the continuous, multi-year campaigns of a Blast Furnace (>96%).
How long does it take for AI to impact these benchmarks?
Most iFactory customers see a 10-15% reduction in unplanned downtime and a 5-8% reduction in maintenance cost per ton within the first 6 months of full platform deployment.
Does "staffing ratio" include contract labor during shutdowns?
Yes. Total maintenance headcount benchmarking must include the full contractor workforce during relines and outages to accurately reflect the true "human cost" of asset availability.
Can a "Level 1" plant jump directly to "Level 4" maturity?
While possible with iFactory’s 15-day deployment, we typically recommend a "Stabilize then Optimize" approach — first digitizing the schedule (Level 2), then connecting real-time data (Level 3), before fully activating prescriptive AI (Level 4).
Where Does Your Plant Rank Against the World?
iFactory gives you the data-driven visibility needed to transition from "Industry Average" to "World-Class" performance in a single campaign cycle.