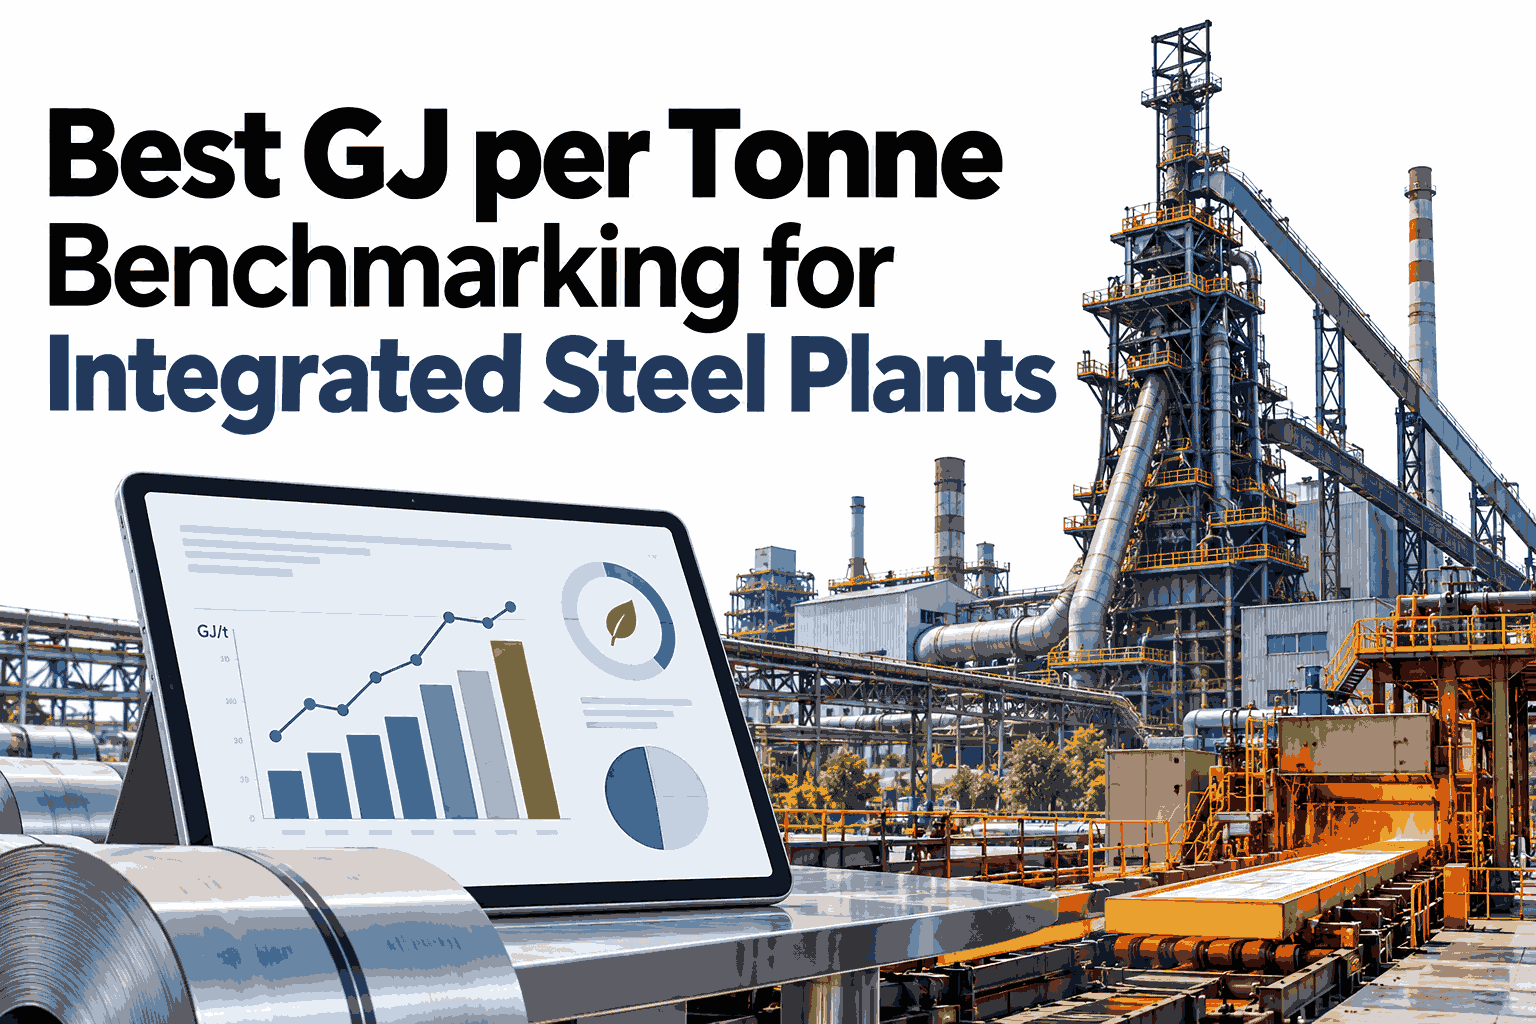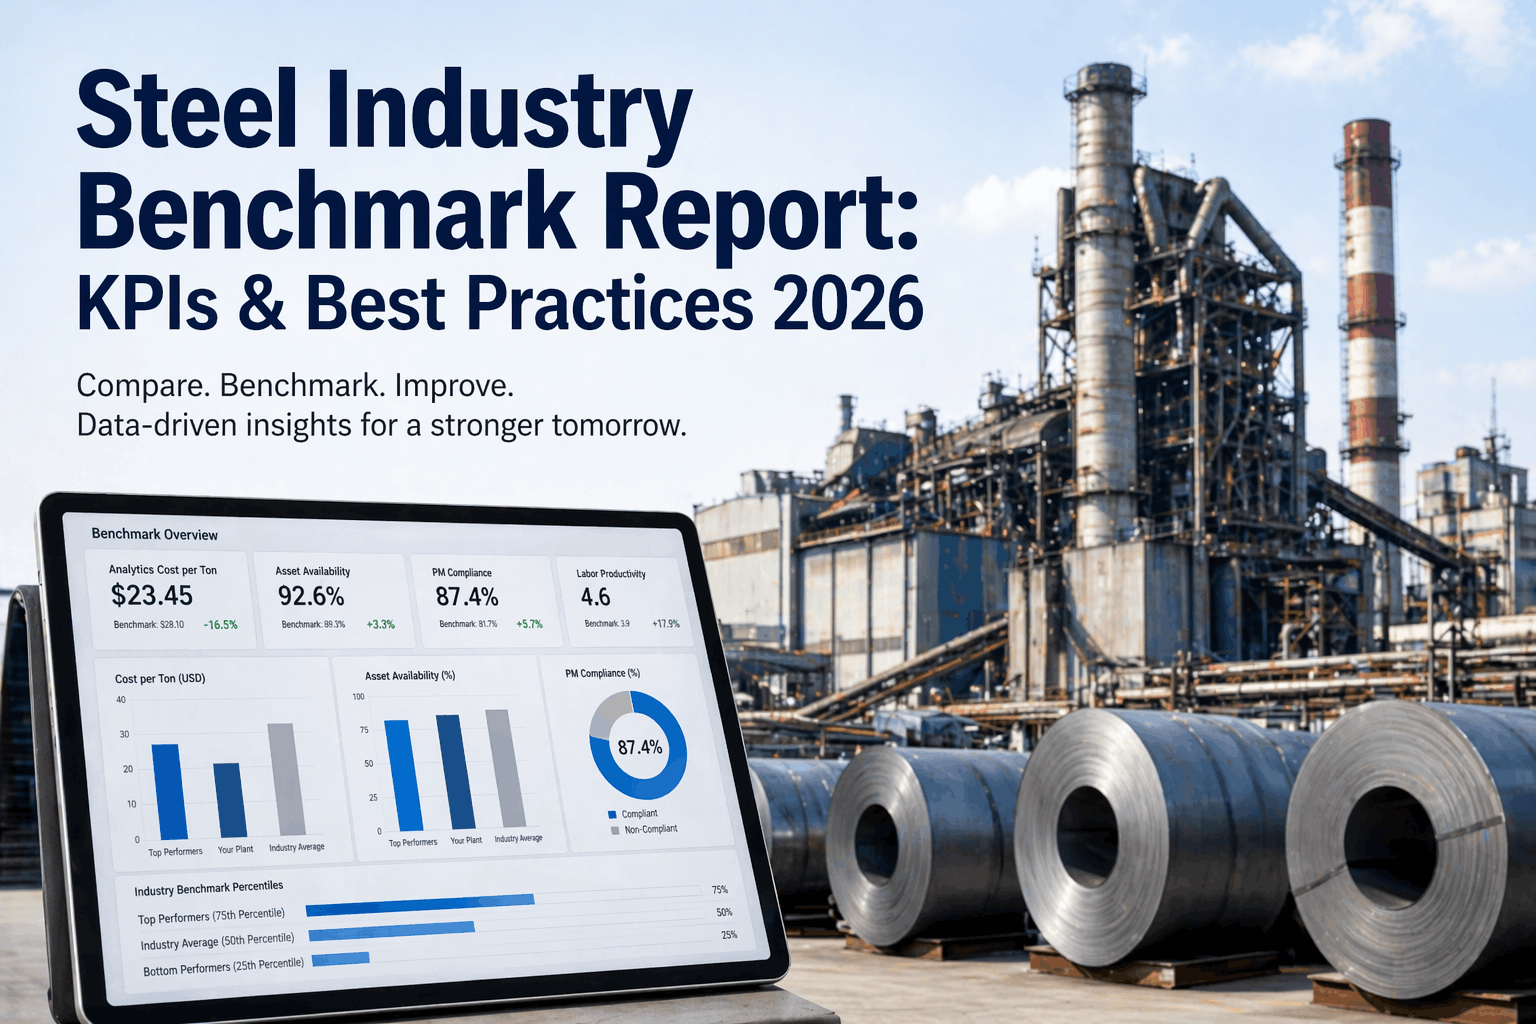
A board asking whether the plant's carbon intensity is competitive deserves a comparison against actual industry data, not a vague sense of where the plant probably stands. Carbon intensity in tCO2 per tonne of steel varies enormously by production route, so a blast furnace plant compared against worldsteel's global average without adjusting for route will look far worse than it actually performs relative to its peers. A proper benchmark separates intensity by route, compares against credible global datasets, and turns the gap into a specific list of levers rather than a single discouraging number. That gap analysis is what gives a capital planning conversation somewhere concrete to start. Boards and plant leaders can see their own route-adjusted benchmark against worldsteel data before the next planning cycle.
Carbon Intensity Benchmarking for Global Steel Plants
tCO2 per tonne of steel benchmarks by route, worldsteel data comparison, and gap analysis boards can act on.
Illustrative global route ranges, for orientation only
Why Route-Adjusted Comparison Matters
Comparing across routes without adjustment produces a misleading picture in both directions.
A blast furnace plant will never match an EAF plant's intensity, regardless of efficiency.
An EAF plant compared against a blended global average can look better than it actually is within its own route peer group.
A single intensity gap number says nothing about which specific lever would close it.
Benchmarking within route, then breaking the gap into specific levers, is what turns a number into a plan.
From Gap to Levers
Once a route-adjusted gap is established, it typically breaks down into a small set of specific levers.
Energy Efficiency
Reducing GJ and kWh per tonne directly lowers Scope 1 and 2 intensity without route conversion.
Scrap Ratio
Increasing scrap share in EAF or hybrid routes reduces carbon intensity per tonne produced.
Fuel Switching
Shifting combustion sources toward lower-carbon fuels closes part of the gap incrementally.
Route Conversion
A longer-term shift toward hydrogen DRI or EAF conversion addresses the largest structural gap.
See Your Route-Adjusted Gap Against worldsteel Data
Book a 30-minute session and bring your route and production data. iFactory AI will show your benchmark position and the levers that close the gap.
Benchmarking Data Sources
Credible benchmarking draws on recognized industry datasets rather than a single vendor's internal figures.
| Source | What It Provides | Best Used For |
|---|---|---|
| worldsteel data | Industry-wide intensity figures by route | External, credible comparison baseline |
| Plant historical data | The plant's own trend over time | Tracking progress against its own baseline |
| Peer group data | Comparable plants on the same route | Realistic near-term target setting |
What iFactory AI Supports
Benchmarking is built from route-level plant data compared against credible external datasets.
Route-Adjusted Comparison
The plant's intensity is compared only against its own route's peer data, not a blended average.
worldsteel Data Integration
Industry benchmark figures are kept current against recognized global data sources.
Lever-Level Gap Breakdown
The overall gap is broken into energy, scrap ratio, fuel and route conversion components.
Board-Ready Visualization
The benchmark and gap analysis export in a format built for capital planning discussions.
iFactory AI builds the route-adjusted benchmark using the plant's own production and emissions data against current global datasets.
Expert Review
Benchmarking against a blended global average is the single most common mistake we see in board presentations, and it usually works against the plant presenting it. Route-adjusted comparison almost always tells a more accurate, and often more favorable, story.
The lever breakdown matters more than the headline gap number. A board that sees "close this gap through efficiency, scrap ratio and fuel switching before considering route conversion" has a far easier capital decision than one that just sees a percentage behind benchmark.
Frequently Asked Questions
How often is worldsteel benchmark data updated?
Industry benchmark datasets are typically updated annually, and the benchmarking model should refresh alongside that update to keep the comparison current. A benchmark run against stale data can understate how far the industry has moved. Ask about our data refresh schedule in a working session.
Can we benchmark against a specific peer group rather than the whole industry?
Yes, a peer group benchmark using plants of similar scale, route and region is often more useful for near-term target setting than the full global dataset, which can include plants at very different stages of modernization. Ask support about defining a peer group for your plant.
How is the gap actually split between the four levers?
The split depends on where the plant's current intensity deviates most from its route baseline, which the model identifies by comparing energy intensity, scrap ratio and fuel mix against route-typical figures. Request a sample lever breakdown to see the method.
Does this benchmark connect to our CBAM exposure modeling?
Yes, the same carbon intensity figure used for benchmarking feeds directly into CBAM cost exposure modeling, so closing a benchmark gap has a direct, traceable effect on projected CBAM cost. Contact support to connect the two models.
How often should the board review this benchmark?
An annual review alongside the capital planning cycle is typical, though a board actively evaluating mitigation investment may want a more frequent check on progress against the gap. Book a session to set a review cadence for your board calendar.
Know Exactly Where You Stand, and What Closes the Gap
iFactory AI benchmarks your route-adjusted carbon intensity against worldsteel data and breaks the gap into levers. Book a session.