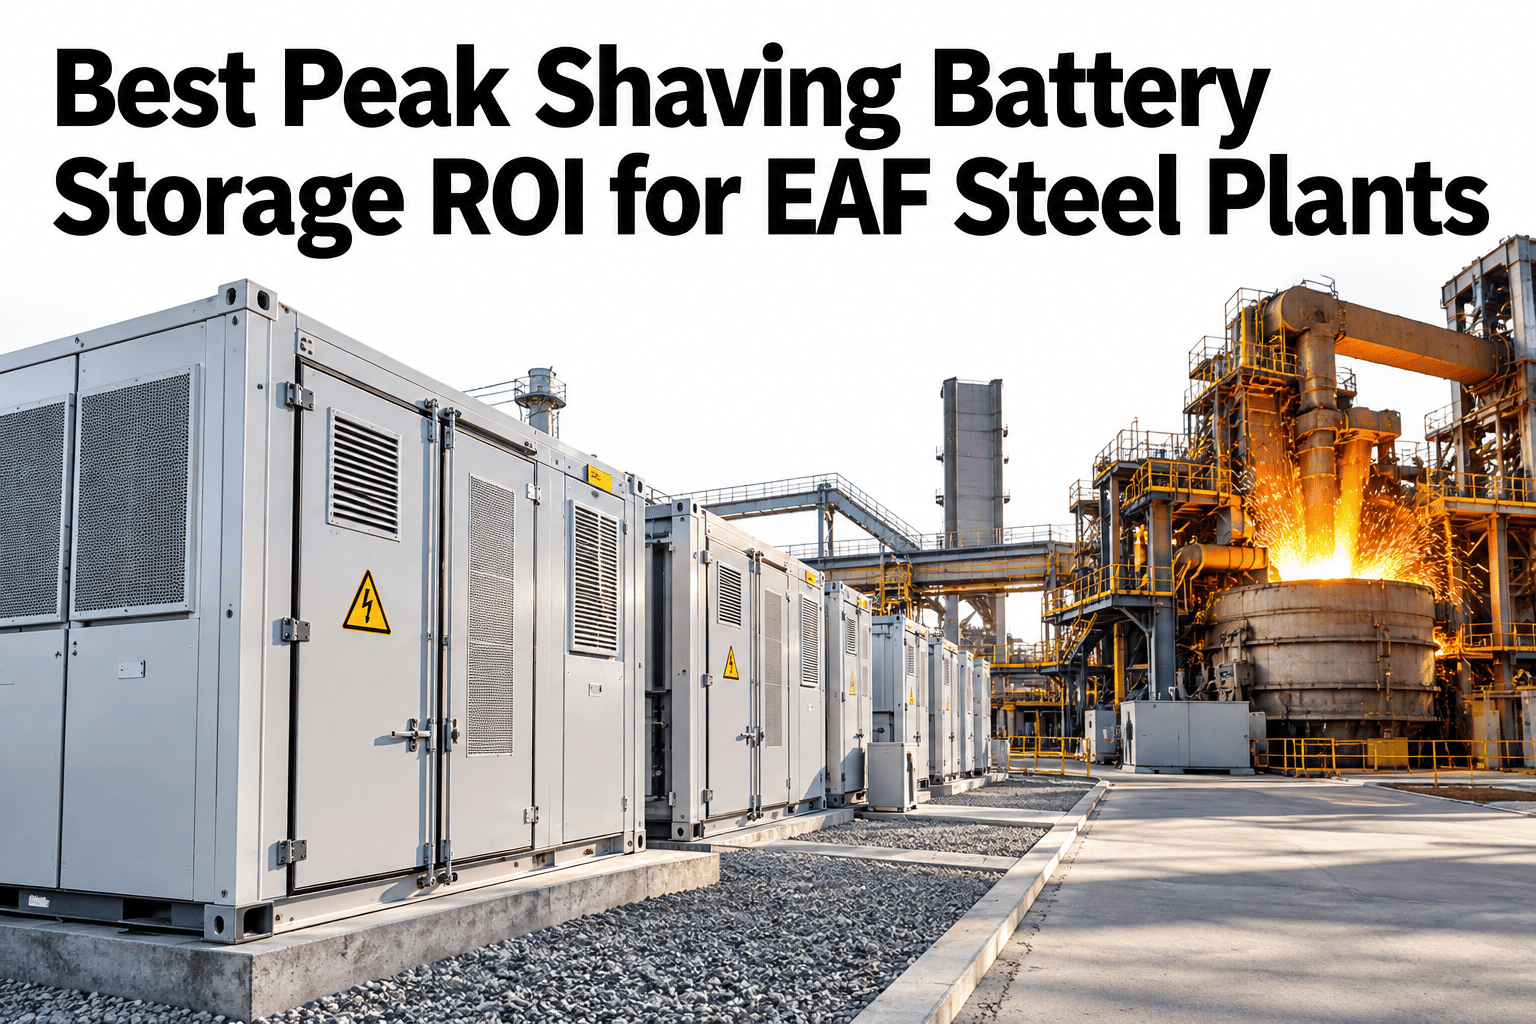
For an electric arc furnace, the most expensive minutes of the month are often a handful of short peaks. Utilities usually set the demand charge from the highest average load recorded in a single interval, so one badly timed melt can raise the bill for thirty days. The good news is that peaks are shaped by decisions, such as when heats start, how furnaces overlap and how hard power is pushed. Plants that want to control those decisions can ask iFactory AI how demand peaks are forecast and managed on EAF lines.
Cut EAF Demand Charges by Controlling the Peak Interval
iFactory AI shapes heat timing, furnace overlap and power limits so the highest interval of the month stops setting the whole electricity bill.
How a Demand Charge Is Built
The bill is not driven by total energy alone. It follows a short chain, and each link is a place to intervene.
Why EAFs Create Sharp Peaks
An arc furnace does not draw steady power. The bars show an illustrative view of relative power draw across a heat.
The Three Levers That Reduce Peak Demand
Plants rarely rely on one tactic. The three levers work best together.
Heat scheduling
Plan heat start times so high-power phases of different furnaces do not overlap in the same interval.
Staggered starts
Offset power-on moments for furnaces and big auxiliaries so loads ramp in sequence, not at once.
Load-limit programs
Cap power setpoints or step down loads when the running interval approaches the target.
Each Lever and Its Trade-Off
Every lever buys demand savings with something else. Knowing the trade-off keeps the program realistic.
| Lever | How It Works | Trade-Off to Manage |
|---|---|---|
| Heat scheduling | Spaces heats so peaks do not coincide | Needs downstream capacity and flexible slots |
| Staggered starts | Offsets power-on moments across furnaces and auxiliaries | Small delays can stack up if unplanned |
| Load-limit programs | Caps power as the interval nears the target | Longer melt time if limits are set too tight |
| Auxiliary load shifting | Moves compressors and fans out of the peak window | Needs process tolerance for the delay |
Find the Peak That Is Costing You the Most
Book a 30-minute session and iFactory AI will review your interval data and heat schedule to show which overlaps are setting your demand charge.
Which Lever Fits Which Situation
Plants differ in furnace count, tariff and flexibility. The matrix, shown as an illustration, suggests where each lever helps most.
| Situation | Heat Scheduling | Staggered Starts | Load Limits |
|---|---|---|---|
| Multiple furnaces on one meter | High | High | Moderate |
| Single furnace plant | Moderate | Moderate | High |
| Tariff with a ratchet clause | High | Moderate | High |
| Tight downstream capacity | Low | Moderate | High |
Reacting to the Bill or Controlling the Interval
Most plants learn about a peak after the bill arrives. Controlling the interval means acting while it is still running.
Building a Demand-Limit Program in Five Steps
A good program starts with data, not equipment. These steps work for most plants.
Collect interval data and furnace phases for several months.
Choose a realistic demand target from your own history.
Space heats and stagger starts to stay under the target.
Add live limits that trim load when the interval nears the target.
Compare each month with the target and adjust.
Pre-Peak-Window Checklist
Run this list before the hours when demand tends to be highest. Each box should be answerable from live data.
A Composite Scenario: Two Furnaces, One Bad Interval
This is a composite example, not a named plant. It shows how a small schedule change cuts a peak.
Mistakes That Keep Peaks High
Most failed programs stumble on the same habits. Avoiding them saves months.
Setting the target by guesswork
A target with no history behind it is either too easy or impossible.
Limiting without scheduling
Limits alone stretch melt time, while scheduling avoids the problem first.
Ignoring auxiliary loads
Fans, compressors and pumps add to the peak.
Reviewing only the monthly bill
By then the peak is history.
What iFactory AI Adds to Demand Control
iFactory AI is smart manufacturing and industrial software for steel and other heavy industry. Explore EAF demand control in a live product tour on realistic furnace data.
A 30-Day Plan to Start
A month is enough to find your biggest overlap and test a fix.
Review of EAF Demand Charge Reduction
A practical review of what makes demand programs work, written as editorial guidance rather than a named expert quote.
Know your tariff first
Strategy follows the billing rules, so read the interval, the ratchet and the penalties.
Schedule before you limit
Avoiding overlaps costs less melt time than cutting power mid-heat.
Review every peak
Each peak is a lesson, so explain it with the heats that caused it.
Frequently Asked Questions
How are EAF demand charges calculated?
Utilities usually bill on the highest average load in a single interval during the month, sometimes with a ratchet. See your tariff rules applied to live data in a short demo. Knowing the rules shows which peaks matter. Some tariffs also apply a ratchet, which keeps a high peak in the bill for months, so avoiding even one bad interval protects several invoices.
Is a 20 to 40 percent reduction realistic?
It is a range plants often target when scheduling, staggering and limits are combined, not a guarantee. Results depend on tariff, furnace count and flexibility. Plants already well scheduled will see smaller gains. Treat the range as a planning target to test against your own interval data, then replace it with the figure your plant actually achieves.
Will limiting power slow down melting?
It can, if limits are set too tight or used instead of scheduling. Ask support how limits are tuned to protect tap-to-tap time in practice. Scheduling first keeps the impact small. A good starting point is a limit that only acts when the running interval is close to the target, so normal melting is rarely touched.
Do we need a battery to cut demand charges?
Not always. Scheduling and limits often deliver much of the saving without capital spending. A battery can add to it later, once process levers are exhausted. If scheduling and limits leave a few short, tall peaks, that is the point where a battery case becomes worth modelling.
How quickly can we see results?
Many plants find their biggest overlap within weeks of analysing interval data. Book time to scope a first demand reduction pilot with your meter data. A visible drop in one monthly peak builds support for more. Track the monthly peak and the heats behind it from the first month, so every change can be tied to a result.
Stop Letting One Interval Set Your Electricity Bill
iFactory AI schedules heats, staggers starts and applies live limits so peak demand stays under control. Book a walkthrough to see it on your own furnace and meter data.