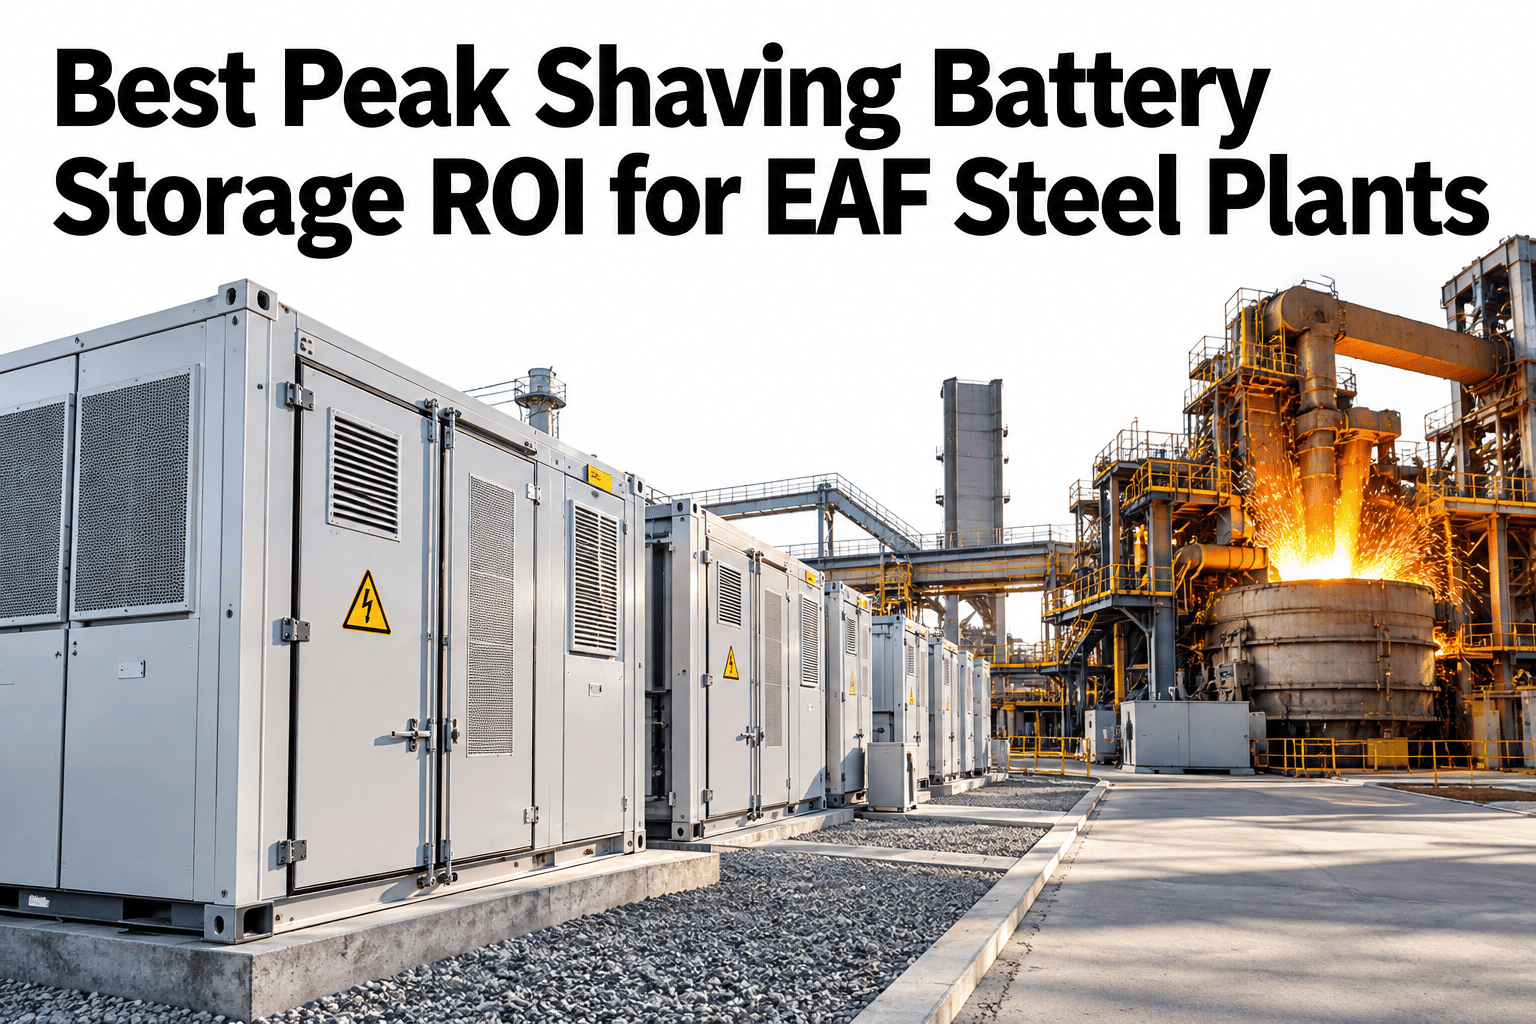
Batteries can shave an EAF peak, but only when they are sized to the real shape of the load. An arc furnace spikes for minutes, not hours, and that short duration is exactly where storage can be a good fit. Get the sizing wrong and the battery either misses the peak or sits oversized and expensive. A clear method, built on interval data and tariff rules, shows whether the numbers work. Plants weighing it can ask iFactory AI how battery sizing and demand savings are modelled for EAF load.
Size Peak-Shaving Batteries for EAF Plants Around Real Load Data
iFactory AI turns interval data and tariff rules into a sizing and payback view, so a battery is bought for the peaks that actually cost money.
How a Battery Shaves an EAF Peak
The battery does not make the furnace use less. It covers part of the spike so the grid meter sees a lower number.
Sizing in Five Steps
A sound size comes from a simple method. These steps work for most EAF plants.
Gather a year of interval data at the finest resolution available.
List peak intervals, their height and how long they last.
Pick the shave that earns the most per kW of battery.
Match kW to the shave and kWh to its duration.
Test savings, costs and incentives against tariff rules.
A Sizing Arithmetic Example
This is illustrative arithmetic, not a quote. A plant peaks at 40 MW and wants to shave 5 MW for up to 15 minutes.
Power rating
The battery must deliver 5 MW to cover the shave.
Energy needed
5 MW for 0.25 hours is 1.25 MWh of usable energy.
Add margin
Allow for depth of discharge, losses and ageing, which raises the installed size.
Compare with savings
Annual demand savings are weighed against cost to estimate payback.
What Moves the Payback
Payback is not fixed. The chart shows an illustrative ranking of the factors that move it most.
See Whether a Battery Pays Back at Your Plant
Book a 30-minute session and iFactory AI will review your interval data and tariff to show peak-shaving size, savings and payback before you commit.
What to Compare Before You Buy
A battery is one option among several. This table shows what to weigh against it.
| Factor | Question to Ask | Why It Matters |
|---|---|---|
| Tariff structure | Is there a ratchet, and how long is the interval? | Sets the value of every shaved kW |
| Peak duration | How long are the peaks you want to cut? | Sets the energy rating needed |
| Process alternatives | Can scheduling and limits cut the peak first? | Cheaper levers may reduce the size needed |
| Site and safety | Is there space, cooling and fire safety approval? | Adds cost and time |
| Revenue stacking | Can it also earn from other services? | May improve payback if rules allow |
Battery or Process Control: Use Both
Process measures and batteries solve the same problem from opposite ends. The best plan usually combines them.
Do Process Measures Before Sizing the Battery
Sequence matters. This ladder shows the order that keeps the battery small and the payback short.
Schedule the heats
Remove overlaps that create avoidable peaks.
Stagger the starts
Offset ramp-ups across furnaces and auxiliaries.
Add live limits
Trim the remaining peaks without a capital spend.
Size the battery for what is left
Buy only the kW and kWh the remaining peaks need.
Battery Business Case Checklist
Use this list before approving any storage project.
A Composite Scenario: The Battery That Shrank
This is a composite example, not a named plant. It shows how process measures reduce the battery needed.
What iFactory AI Adds to Battery Planning
iFactory AI is smart manufacturing and industrial software for steel and other heavy industry. Explore battery sizing in a live product tour on realistic furnace data.
Review of EAF Peak-Shaving Battery Economics
A practical review of what makes storage economics reliable, written as editorial guidance rather than a named expert quote.
Use interval data, not averages
Payback depends on the shape of the peaks, which averages hide.
Price the cheaper levers first
Scheduling and limits often shrink the battery needed.
Test the worst case
A project that only works in the best case is risky.
Frequently Asked Questions
How is a peak-shaving battery sized for an EAF?
Power rating comes from the size of the peak to be shaved, and energy rating from how long it lasts. See sizing run on live interval data in a short demo. Margin is added for losses and ageing. Use a full year of interval data where possible, because seasonal changes and unusual months can shift the peak you size for.
Is a 4 to 7 year payback realistic?
It is a range often discussed, not a guarantee. Payback depends on tariff, battery cost, peak shape and incentives. Run your own numbers, including a worst case. Treat any payback range as a starting hypothesis, then test it against your own tariff, quotes and a conservative worst case.
Why does peak duration matter so much?
Batteries store a limited amount of energy, so short peaks are cheaper to cover than long ones. Ask support how peak duration is analysed in your data before sizing. EAF spikes often suit storage well. Peak duration also affects battery life, since deeper and more frequent discharge can wear the battery faster over the project term.
Should we cut peaks with process changes first?
Yes, in most cases. Scheduling and limits are cheaper and reduce the battery you need. Storage then covers what remains. Sequencing the work this way often reduces the battery size needed, which improves payback before any equipment is bought.
How long does a battery project take?
Analysis takes weeks, while approvals, procurement and installation take longer. Book time to scope a battery business case with your data. A clear case speeds internal approval. Comparing at least two quotes on lifetime cost, including replacement and degradation, gives a more honest picture than purchase price alone.
Buy the Battery Your Peaks Actually Need
iFactory AI models peak shape, tariff and process options together so storage pays back on real numbers. Book a walkthrough to see it on your own interval data.