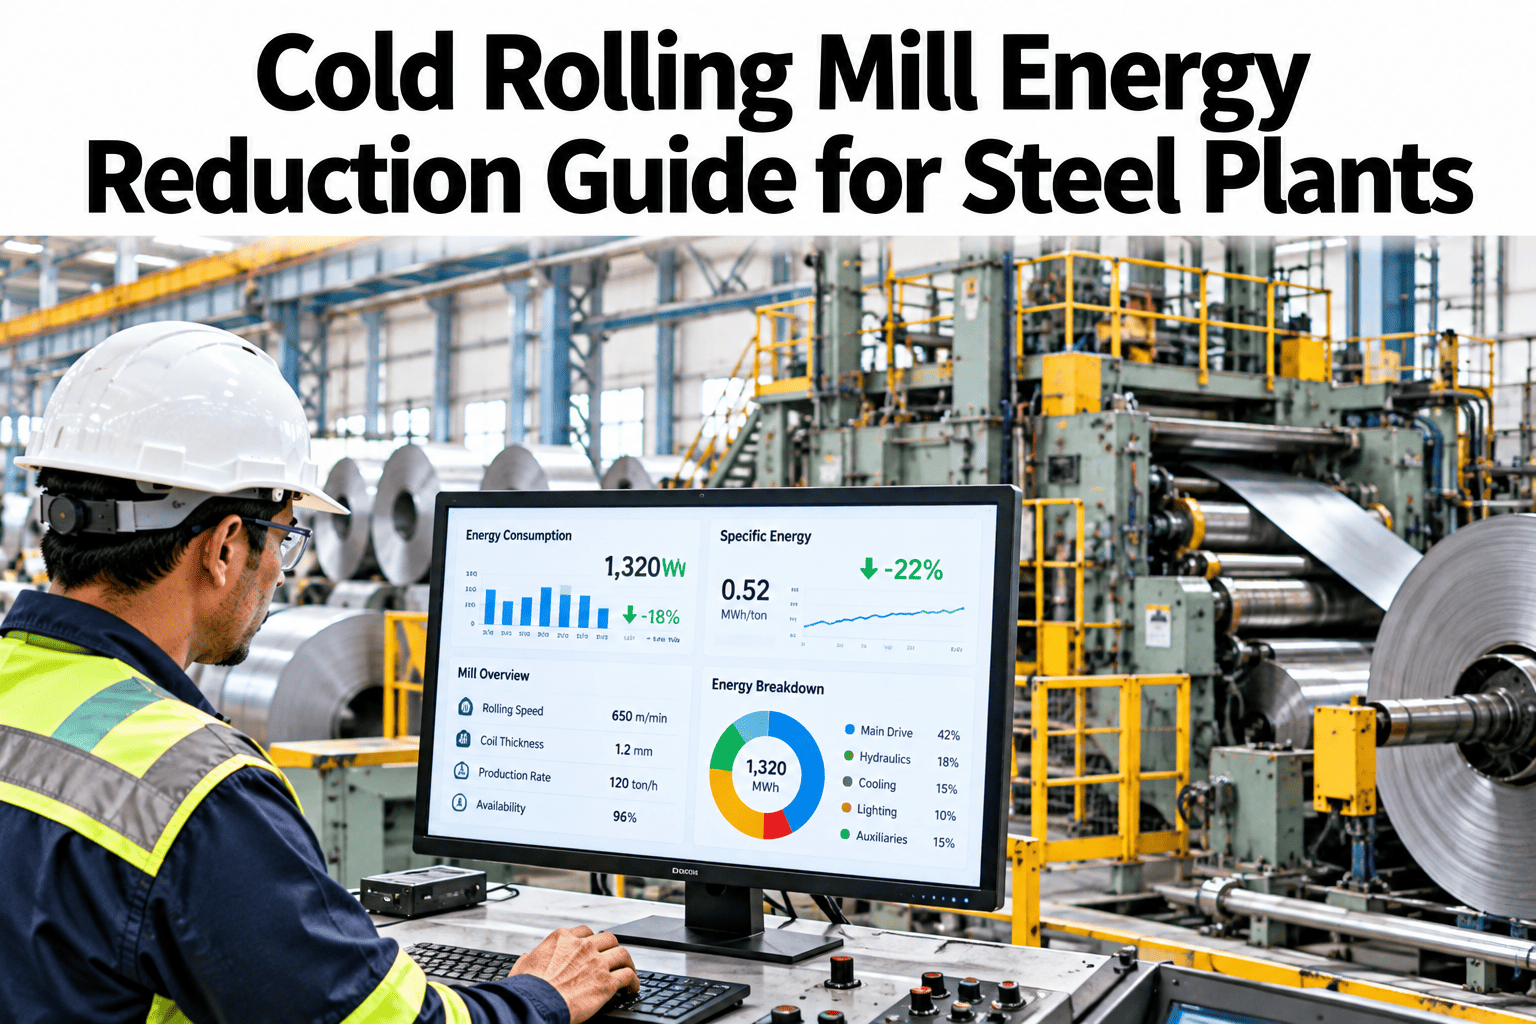
A cold rolling mill turns pickled coil into thin, precise strip, and it uses a great deal of electricity to do it. The main drives take most of the power, but the pumps, cooling, ventilation and pickling line around them quietly add a large share, and a good part of that energy is spent while the mill is waiting, slowing or poorly matched to the coil. Reducing it means understanding where each kilowatt-hour goes per tonne, then tuning tension, drives and scheduling together. Steel plants who want to start can ask iFactory AI how cold mill energy is measured and attributed per coil.
Cut Cold Rolling Mill Energy Per Tonne Without Touching Product Quality
iFactory AI measures energy by coil, stand and auxiliary system, then guides tension, drive and scheduling changes that reduce kilowatt-hours per tonne while quality targets stay protected.
Where a Cold Mill Spends Its Electricity
Energy use is spread across more systems than most teams track. The bar shows an illustrative split, and your own mill will differ.
The Route Energy Travels Through
Energy is consumed at each stage of the route, and decisions in one stage change the load in the next.
Five Levers That Reduce Energy Per Tonne
Plants rarely rely on one change. These five levers work best together.
Tension optimisation
Setting entry, inter-stand and exit tension to lower rolling load without risking strip breaks.
Motor and drive efficiency
Matching motors and drives to load, avoiding long periods at poor part-load efficiency.
Auxiliary and standby control
Shutting down or slowing pumps, fans and cooling when the mill is waiting.
Pickling line integration
Coordinating the pickling and rolling lines to reduce waiting, rehandling and heating waste.
Schedule optimisation
Sequencing coils by width, gauge and grade to cut setup, roll changes and idle time.
How Tension Changes Rolling Energy
Tension is one of the most powerful and most delicate levers. The comparison shows the trade-off.
Levers, Mechanisms and Watch-Outs
Every lever saves energy in a different way and carries a different risk. The table summarises them.
| Lever | How It Saves Energy | Watch-Out |
|---|---|---|
| Tension optimisation | Lower roll force and drive power per pass | Strip breaks, shape defects and coil damage |
| Motor and drive efficiency | Less loss at the operating point of the motor | Capital cost and disruption during changes |
| Auxiliary and standby control | Avoids pumps and fans running with no product | Restart time and equipment wear from cycling |
| Pickling integration | Less waiting, handling and unnecessary heating | Coordination between two lines and teams |
| Schedule optimisation | Fewer roll changes and less idle time | Delivery dates and mixed-grade constraints |
Find Out Where Your Cold Mill Is Wasting Kilowatt-Hours
Book a 30-minute session and iFactory AI will review your energy, coil and schedule data to show where kilowatt-hours per tonne can be reduced without hurting quality.
A Worked Savings Example
This is illustrative arithmetic in generic currency units. A mill rolls 400,000 tonnes a year and finds a saving of 5 kWh per tonne.
| Item | Basis | Result |
|---|---|---|
| Annual throughput | Planned rolling volume | 400,000 tonnes |
| Energy saved per tonne | Combined effect of the levers | 5 kWh per tonne |
| Annual energy saved | 400,000 times 5 | 2,000,000 kWh, or 2,000 MWh |
| Electricity price | Illustrative blended rate | 0.10 per kWh |
| Annual saving | 2,000,000 times 0.10 | 200,000 |
Where Energy Is Lost Most Often
Losses cluster in a few places. The chart shows an illustrative ranking.
Which Loss Belongs to Which Part of the Mill
The matrix, shown as an illustration, ranks typical losses by area.
| Loss Source | Pickling Line | Rolling Stands | Auxiliaries |
|---|---|---|---|
| Idle and standby running | Moderate | Moderate | High |
| Poorly tuned tension or pass schedule | Low | High | Low |
| Motor and drive part-load losses | Moderate | High | Moderate |
| Waiting between lines | High | Moderate | Moderate |
| Compressed air and cooling over-supply | Low | Moderate | High |
Why Energy Must Be Normalised Before Anyone Compares
Raw energy figures mislead. A thin, hard coil takes more energy per tonne than a thick, soft one. Fair comparison needs context.
Picking the Right Schedule Matters Too
Schedule choices affect energy as much as settings do. The ladder shows the usual order of benefit.
Group coils by width and grade
Fewer setup changes and smoother running.
Order gauge reductions sensibly
Avoids large swings in roll load and tension.
Plan roll changes with the schedule
Fewer unplanned stops and standby periods.
Align pickling output with mill demand
Reduces waiting and rehandling between lines.
Protect delivery dates first
Energy savings that cause late orders are not savings.
Tension and Drive Optimisation in Five Steps
A careful program finds savings without risking the strip.
Record energy per coil with gauge, grade, width and tension.
Find the normal energy for each product family.
Adjust tension or schedule in small steps with guardrails.
Confirm shape, flatness and break rate stay in tolerance.
Write the new setting into the standard and track it.
Cold Mill Energy Review Checklist
Use this list at the weekly energy meeting. Each box should be answerable from mill data.
A Composite Scenario: The Mill That Ran Pumps for Nobody
This is a composite example, not a named plant. It shows how auxiliary data changes priorities.
Mistakes That Waste Energy Programs
These habits make savings small or short-lived.
Looking only at the main drives
Auxiliaries and standby often hold equal savings.
Comparing coils of different products
Hard grades will always look worse.
Raising tension without guardrails
A strip break costs far more than the saving.
Reporting monthly averages only
Coil-level causes disappear in the average.
What iFactory AI Adds to Cold Mill Energy Management
iFactory AI is smart manufacturing and industrial software for steel and other heavy industry. Capabilities described here should be confirmed against your specific setup. Explore cold mill energy tracking in a live product tour on realistic mill data.
A 30-Day Plan to Start
A month is enough to build a first energy picture for one mill.
Review of Cold Rolling Mill Energy Reduction
A practical review of what makes energy programs last in a rolling mill, written as editorial guidance rather than a named expert quote.
Measure by coil
Monthly averages hide the causes that sit in individual coils.
Normalise before comparing
Energy per tonne is only fair within similar products.
Protect quality first
A saving that raises breaks or rejects is not a saving.
Frequently Asked Questions
Where does a cold rolling mill use the most energy?
The main stand drives take the largest share, followed by pumps, hydraulics and cooling, the pickling line and ventilation. See an energy split on a live mill in a short demo. The split varies by plant and product mix, and standby is often under-measured.
How does tension affect energy?
Higher tension reduces roll force and the power needed for the reduction, but too much risks strip breaks and shape problems. Optimisation therefore needs guardrails. Test changes in small steps and check quality results.
Can auxiliaries really be reduced without risk?
Often yes, with safe rules for slowing or pausing pumps and fans during waiting. Ask support how restart conditions are protected in your plant. Always confirm cooling and safety requirements first.
What is a good energy per tonne figure?
It depends on gauge, grade, width and mill design, so compare coils within families and against your own history. Industry averages can mislead. Normalised trends are more useful than a single number.
How soon can we see results?
Many plants find standby and scheduling opportunities within weeks of attributing energy to coils. Book time to scope a cold mill energy pilot with your rolling team. A verified saving makes the case for the next step.
Lower Kilowatt-Hours Per Tonne Without Risking the Strip
iFactory AI measures energy by coil and guides tension, standby and schedule changes with quality guardrails. Book a walkthrough to see it on your own cold mill.