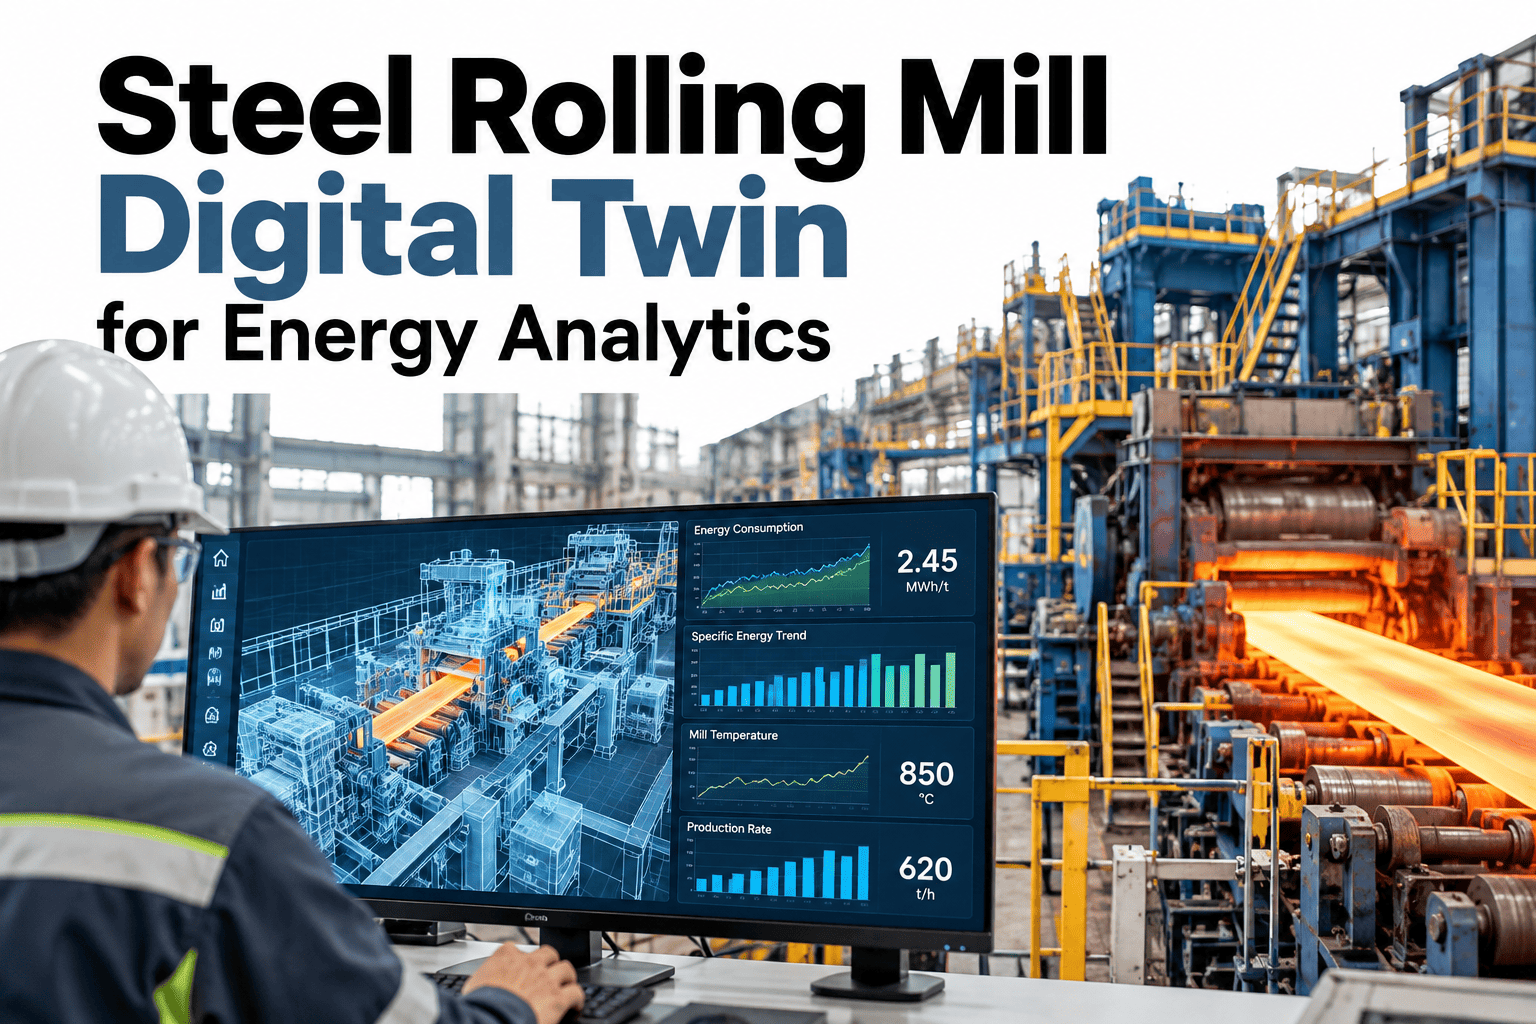
Changing a rolling schedule to save energy is a gamble when the only test bed is the live mill. A speed change can cool the bar below its rolling window, a new campaign order can raise changeover time and a different product mix can push a drive toward its limit. A physics-based mill twin lets engineers try those changes on a model of the mill first, with roll force, torque, temperature and power all calculated. It does not replace judgement, but it narrows the choices to the ones worth a trial and warns about the ones that break a constraint. Engineers who want to test a schedule idea on their own mill can watch a schedule what-if run on a calibrated mill model in a short session.
Rearrange the Rolling Schedule on the Twin Before the Mill Feels It
iFactory AI models roll force, torque, temperature and power for your mill, then predicts the energy effect of schedule, speed and product-mix changes.
What Sits Inside a Mill Twin
A mill twin follows the energy from the drive to the steel. Each layer has its own physics, and the layers are linked so a change in one shows up in the others.
Questions a Twin Can Answer
The table lists typical what-if questions and the constraints the twin must respect before it recommends a change.
| What-If Question | Variables Changed | Constraint Checked | Output |
|---|---|---|---|
| Reorder the campaign | Product sequence, changeover count | Delivery dates, roll wear | Energy and changeover time |
| Change mill speed | Speed per stand | Finishing temperature, drive limits | kWh per tonne and rate |
| Alter the product mix | Share of each section | Mill capability by section | Energy per tonne by group |
| Revise reduction per pass | Pass schedule | Force, torque, surface quality | Power and load balance |
| Adjust billet temperature | Furnace discharge target | Rolling window, scale | Mill power and furnace fuel |
Put a Real Schedule Idea Through the Twin
Send us one week of rolling schedule and power data. iFactory AI will calibrate the model and run your sequence idea, showing energy, temperature and limit checks together.
Speed Has a Sweet Spot
Faster rolling is not always cheaper per tonne. Very slow speeds lose bar temperature and raise drive load, while very fast speeds raise power. The columns show an illustrative energy index across mill speed, with 100 as the current setting.
106
102
100
103
108
Changeovers: The Cost of a Size Change
Every size change costs time and energy while rolls and guides are reset. The bars compare an illustrative shift under the two sequences from the hero.
Can the Twin Be Trusted? Calibration Check
A twin earns trust by matching measurements. The bars show an illustrative prediction error for five product groups against a five percent band, and teams can review calibration results on their own heats before relying on any answer.
A Composite Scenario: Predicted Against Realised
A mill trialled three product-mix changes after testing them on the twin. The columns compare illustrative predicted and measured energy savings.
4.1 against 3.6
2.8 against 2.9
6.0 against 4.8
Where iFactory AI Fits
A mill twin needs rolling data, power data and process knowledge. iFactory AI supplies the data foundation and the energy models for steel mills.
Calibrated Mill Model
Physics-based models are tuned to your mill and checked against measured heats.
Schedule Workbench
Test sequences, speeds and mixes, with constraint checks shown beside the energy result.
Error Monitoring
Prediction error is tracked per product group, and drift is flagged early.
Saving Verification
Each trial is measured against the twin baseline, so savings claims stand up.
Expert Review: Using a Mill Twin Wisely
A twin can mislead as easily as it can help. This review sets out how experienced mill engineers test one before acting on its advice.
Frequently Asked Questions
Is a mill twin the same as a dashboard?
No. A dashboard reports what happened. A twin estimates what would happen under a change, using physics for force, torque, temperature and power. Both matter, and they share the same data. Our modelling team can show how the two fit together on a single mill before you decide where to start.
How much data do we need to start?
Rolling schedules, drive power, speeds, billet temperatures and product definitions are the core. A few months of data across your main products usually allows a first calibration. More history improves accuracy for rare grades. The first weeks of a rollout focus on matching these records by bar and time, so the model sees clean inputs.
Will the twin change settings by itself?
Not by default. The twin recommends, and engineers and operators decide, within drive limits and quality rules. Many mills use it advisory only, which keeps people in control. Any move toward automatic adjustment would be agreed with your control and equipment suppliers and tested carefully. See how recommendations are presented to operators.
What happens when the mill changes?
The model must change with it. New rolls, drives, products or practices alter the energy behaviour, so the twin is recalibrated. Rising prediction error is the signal, and the system flags it before decisions rely on stale results. Planned changes can be added to the model in advance, so it is ready on day one.
How do twin results connect to our energy reporting?
The twin predicts energy per tonne under different conditions, and the measured figure confirms what happened. Together they separate real efficiency gains from mix and utilisation effects. Ask how twin results roll into your scorecard and your benchmark reports.
Try the Schedule Change on the Model, Prove It on the Mill
See a calibrated mill twin answer a what-if on your own product mix, with every limit checked. Book a working session with a mill modelling specialist.