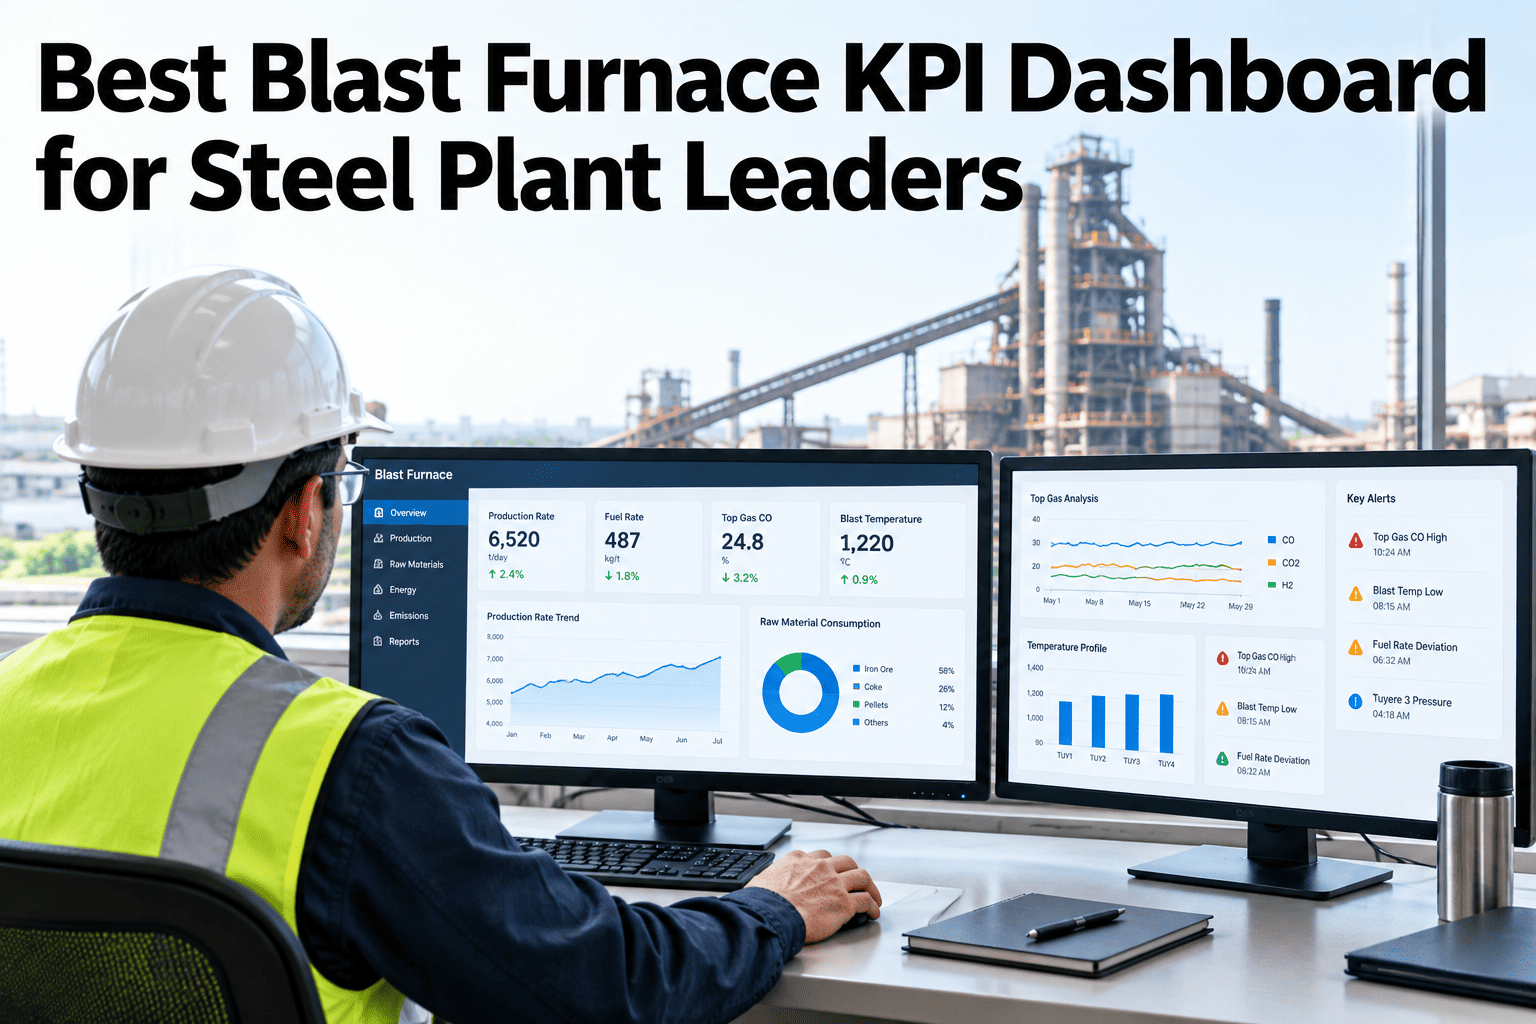
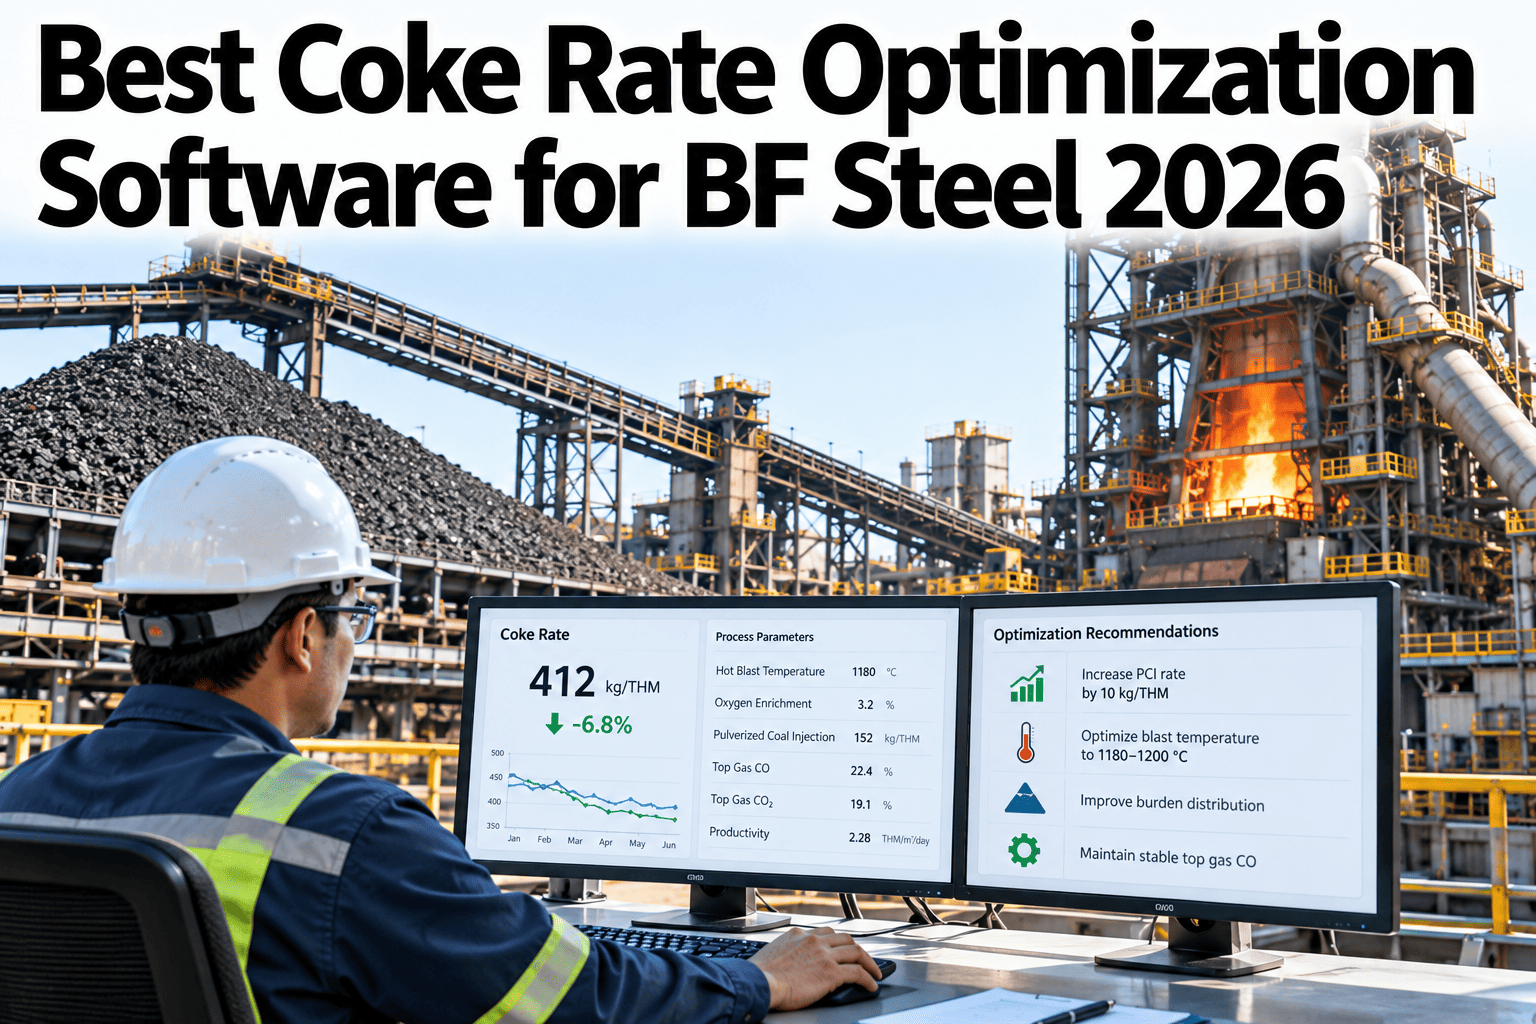
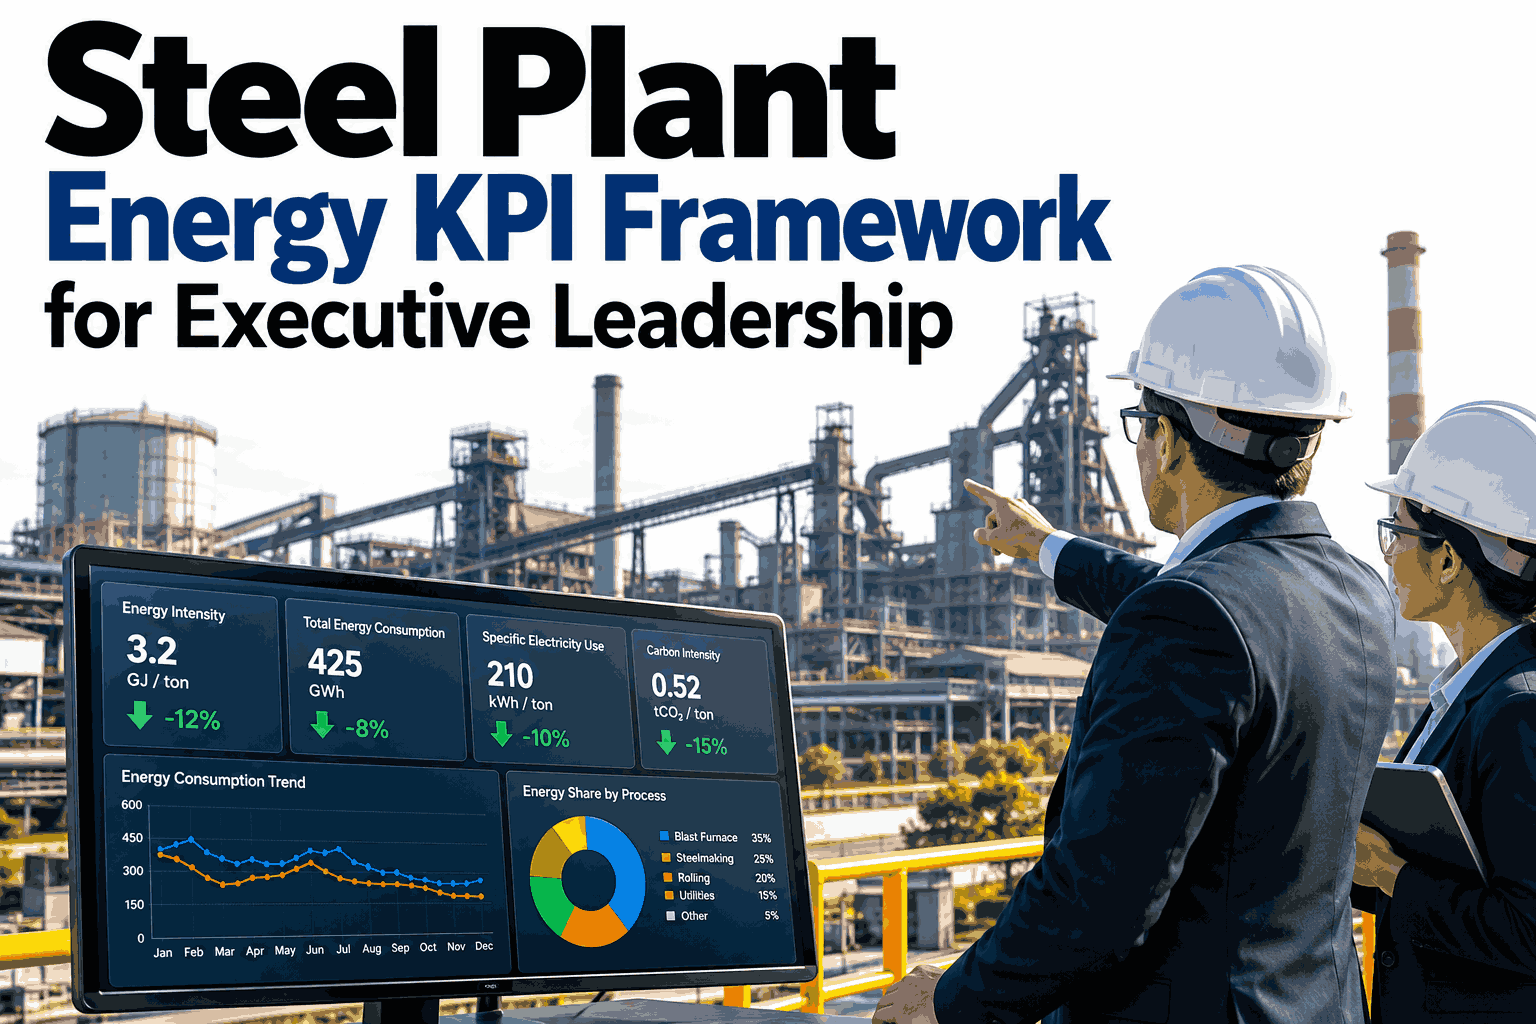
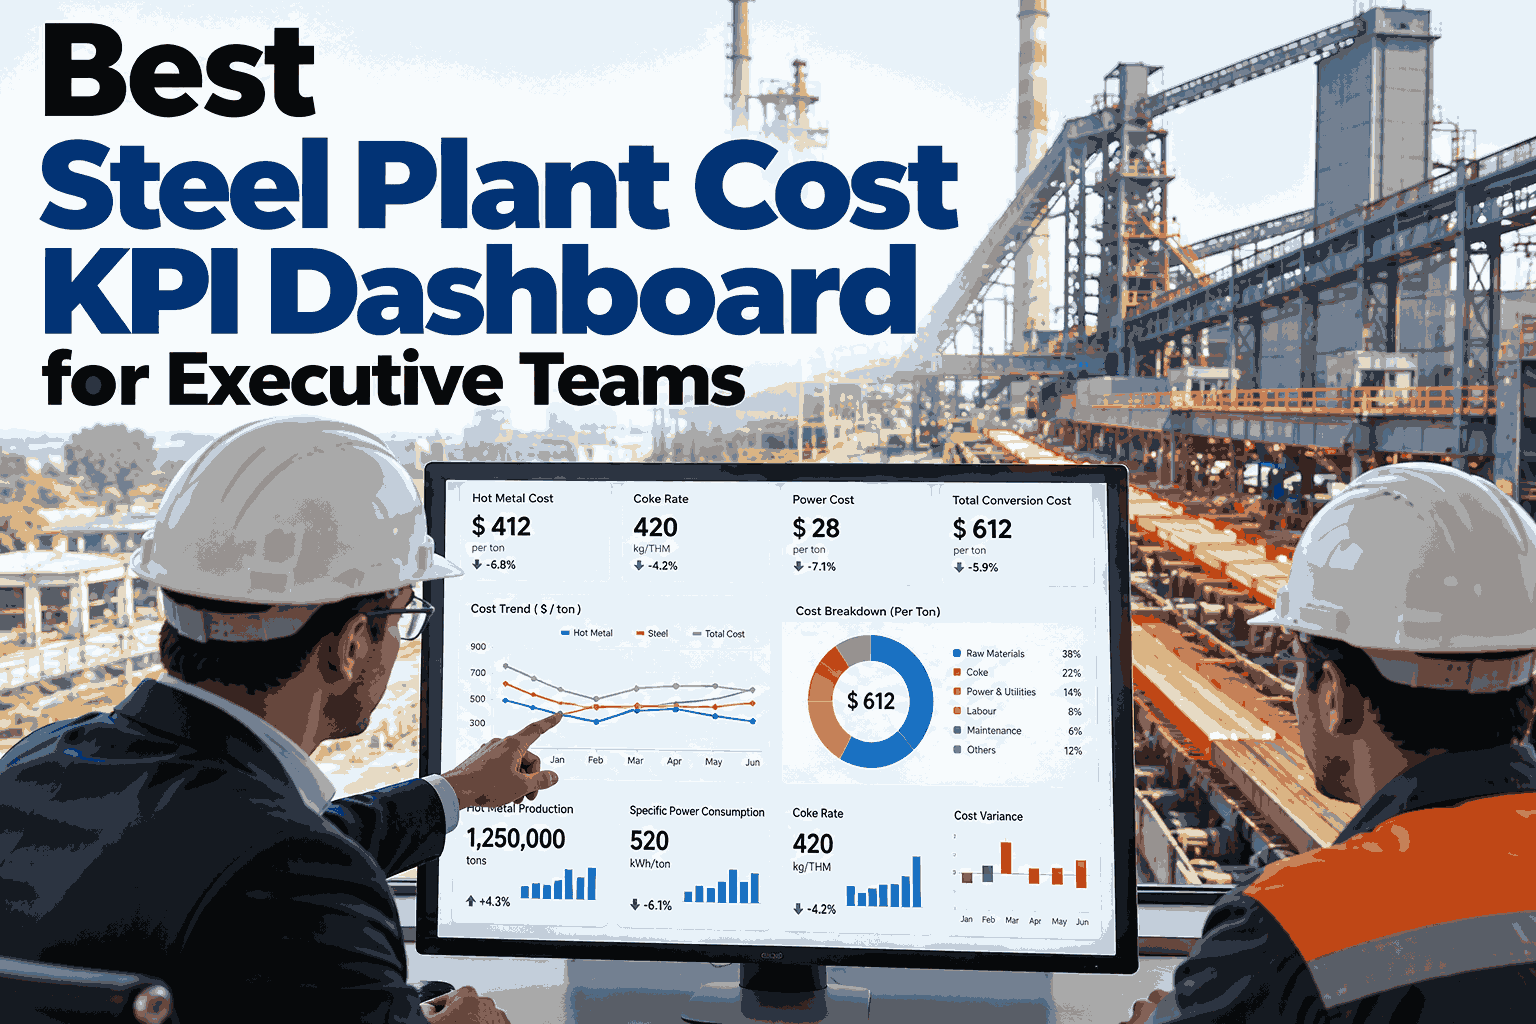
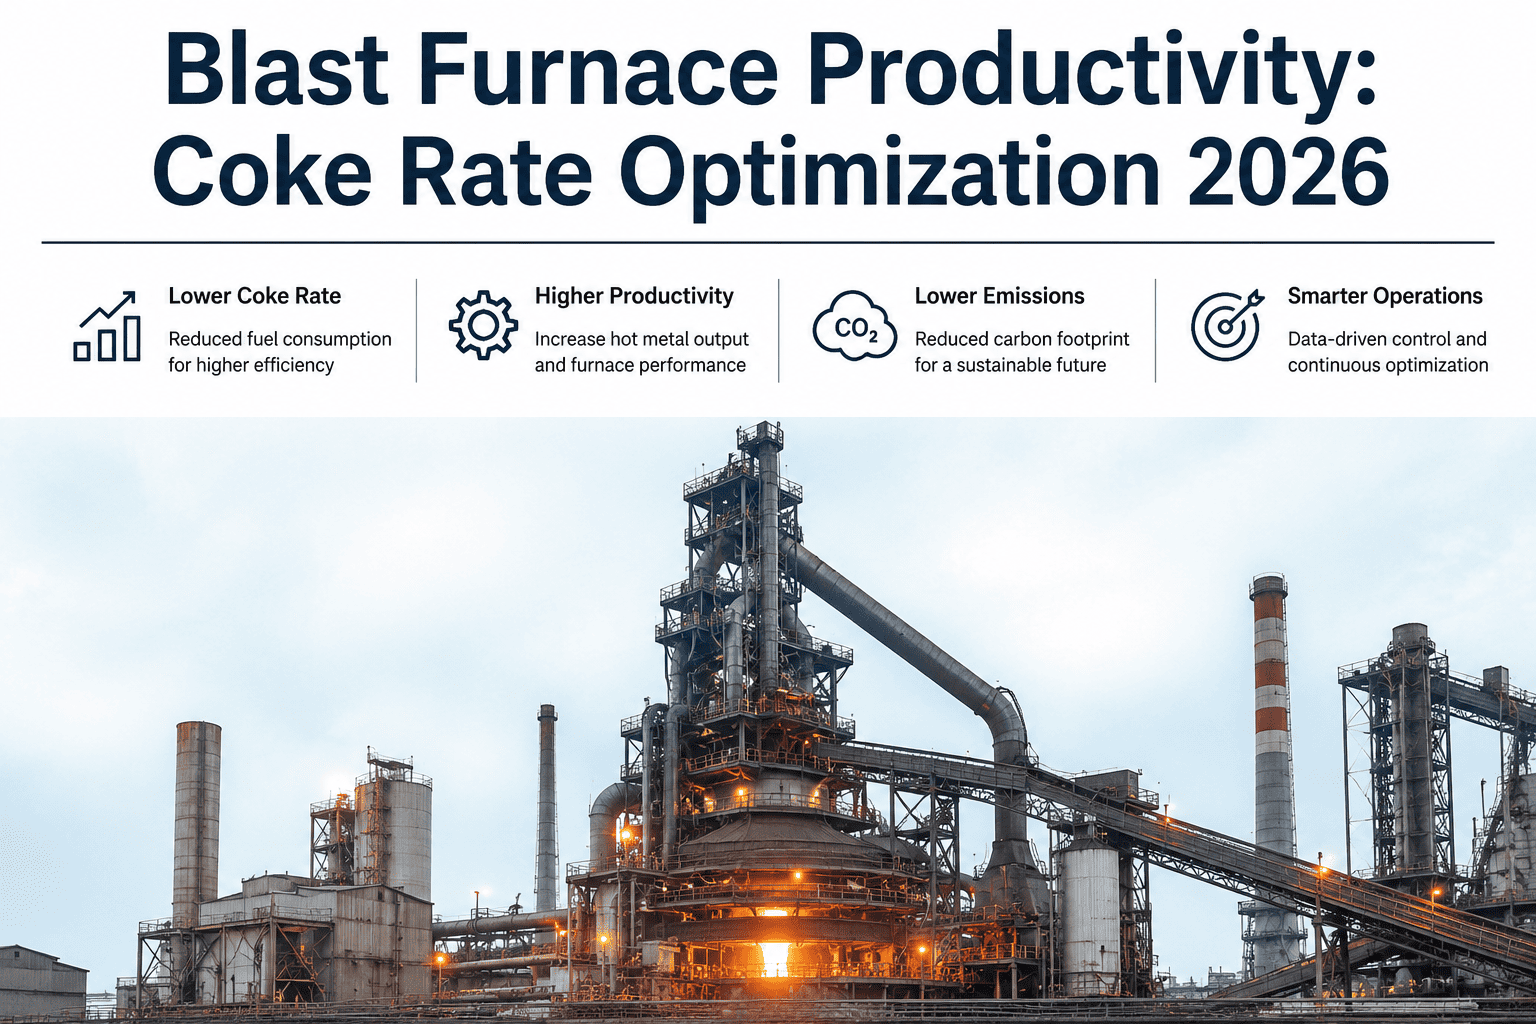
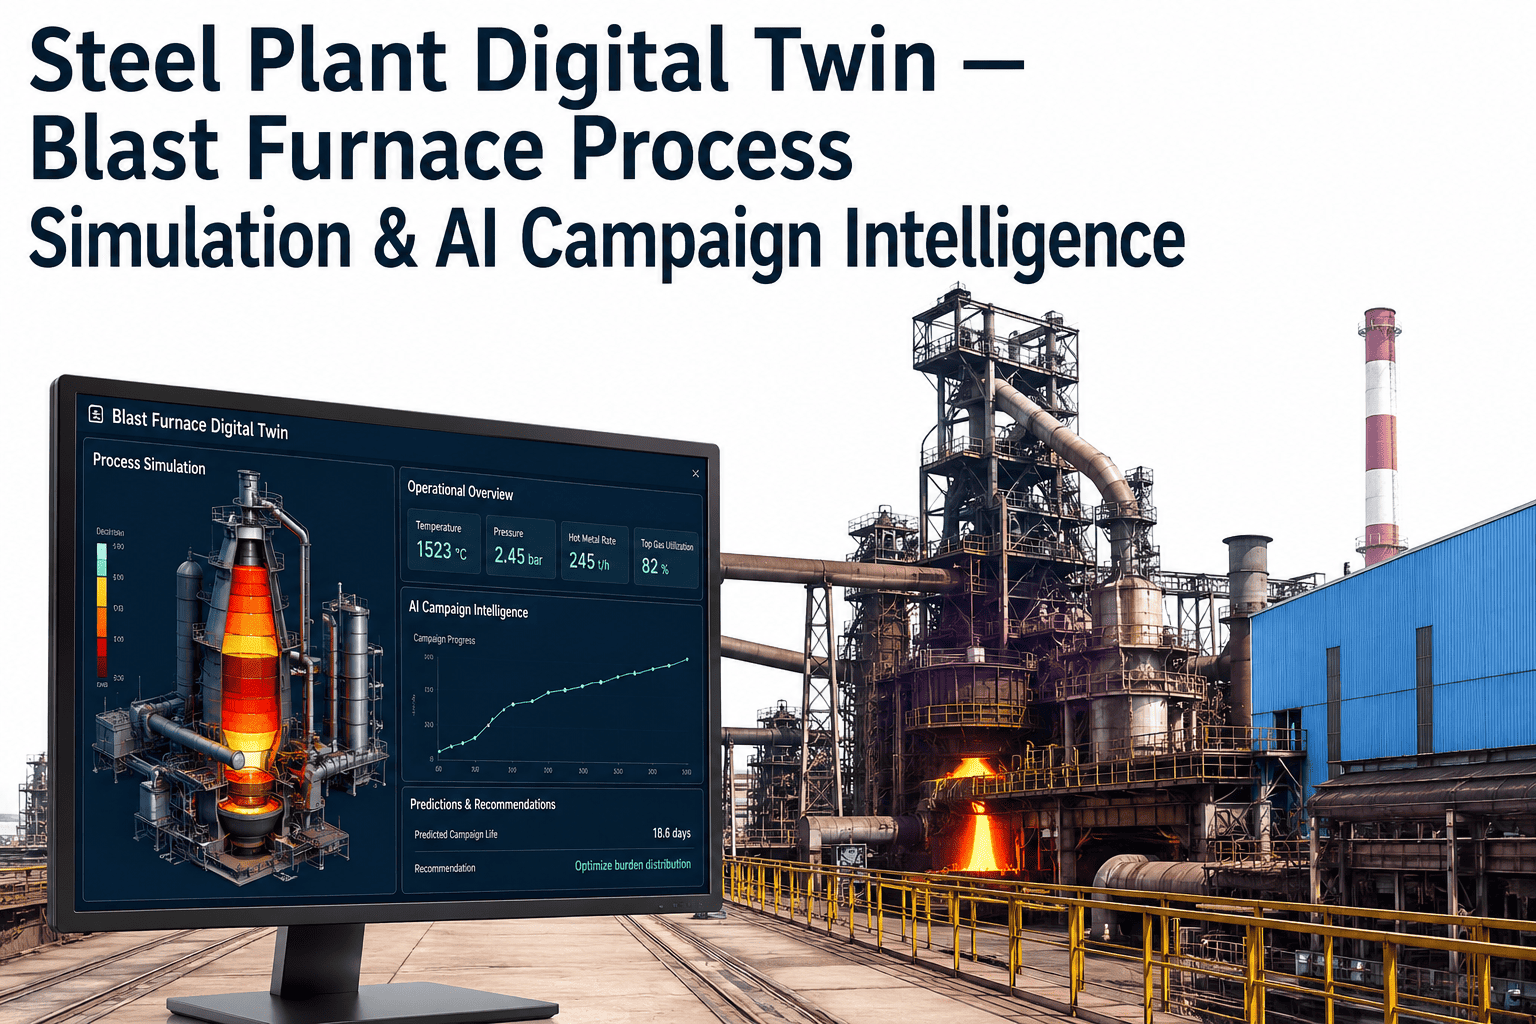
A blast furnace leader needs to know in seconds whether the furnace is healthy, efficient and safe to push, but the numbers usually arrive in separate reports, days late. A live KPI dashboard brings productivity, coke rate, hot metal quality, availability and campaign progress onto one screen, with targets and trends beside each figure. It does not replace the process model or the operator, but it gives leaders a shared picture. To see how this could look for your furnace, you can preview a blast furnace scorecard with our team.
Blast furnace monitoring and failure prediction
See Furnace Health, Efficiency and Campaign Life on One Live Scorecard
iFactory AI brings productivity, fuel rate, hot metal quality, availability and campaign progress together so plant leaders can act on facts, not on last week's report.
Five KPI families for furnace leaders
ProductivityFuel rateHot metal qualityAvailabilityCampaign progress
The reporting gapLeaders Often See the Furnace Through Yesterday's Numbers
Furnace data lives in the automation system, the laboratory system and maintenance records. Reports stitch them together after the fact.
Data is scattered
Process, laboratory and maintenance systems
Reports are late
Monthly or weekly summaries
Drift is missed
Slow changes hide inside averages
Decisions lag
Action follows the report, not the event
A live scorecard shortens that delay. It does not need to show everything, only the few numbers that guide decisions.
Five KPI familiesWhat a Furnace Leader Needs to See
1
Productivity
How much hot metal the furnace makes for its size and time.
2
Fuel rate
Coke and injected fuel used for each tonne of hot metal.
3
Hot metal quality
Temperature and chemistry, including silicon and sulphur.
4
Availability
Share of time the furnace operates as planned, with causes of losses.
5
Campaign progress
Condition of the hearth, cooling system and refractory against planned life.
The core formulasDefine the Main Numbers in Writing
Clear definitions stop arguments about whose number is right. These examples use illustrative figures.
Productivity = hot metal tonnes per day / working volume in cubic metres
Fuel rate = coke rate + injected fuel rate, in kg per tonne of hot metal
7,500
Hot metal tonnes per day
3,000
Working volume in cubic metres
2.5
Tonnes per cubic metre per day
480
Fuel rate if coke is 340 and injected fuel is 140
See Your Furnace as a Live Scorecard
Share the KPIs your leadership reviews today and see how iFactory AI would show them live with targets and trends.
KPI referenceHow Each KPI Is Defined and What to Watch
| KPI | What it shows | Best view | Caution |
|---|
| Productivity | Output relative to furnace size | Daily trend | Affected by blast, burden and stoppages |
| Coke rate | Coke used per tonne of hot metal | Daily and weekly trend | Read together with injected fuel |
| Fuel rate | Total fuel per tonne | Daily and weekly trend | Replacement ratios differ by fuel |
| Hot metal temperature and silicon | Thermal state of the furnace | Cast by cast | Needs lab and sensor alignment |
| Availability | Operating time against plan | Shift and month | Show causes, not only totals |
| Campaign progress | Refractory and cooling health | Weekly trend | Based on sensors and models with uncertainty |
Campaign progressFour Layers of Furnace Life Tracking
The campaign is the furnace's planned operating life between major relines. Leaders need an early view of its condition.
Hearth condition
Temperatures and models that indicate wear in the hearth.
Cooling and staves
Water temperatures, flows and heat load on cooling elements.
Remaining life estimate
A range, updated as new data arrives.
Risk flags
Alerts when trends change faster than expected.
Remaining life is an estimate with uncertainty. Show ranges and update them when new data arrives.
Views by roleSame Numbers, Different Detail
Operator view
Live process signals, current cast and short-term trends.
Shift manager view
Fuel rate, hot metal quality, delays and open actions.
Plant leader view
Productivity, cost, availability and campaign progress.
All views should use the same definitions. To design them, ask our team for a furnace dashboard layout guide.
Data sourcesPull Process, Laboratory and Maintenance Data Together
Process automation dataLaboratory and sampling resultsMaintenance and delay records
Furnace data layer
Live scorecardDaily and weekly reportsFailure and risk alerts
Align time stamps across systems. A cast logged in the laboratory system must match the same cast in the process data.
Cost contextAn Illustrative Share of Hot Metal Cost
Costs differ by plant. This split shows why fuel KPIs matter. It is illustrative.
45 percent: Iron-bearing burden
Ore, sinter and pellets.
30 percent: Coke
Often the largest single fuel cost.
10 percent: Injected fuel
Such as pulverised coal.
15 percent: Other costs
Labour, maintenance and utilities.
Live versus periodicWhat Changes When KPIs Are Live
Periodic reports
Weekly or monthly summaries
Averages hide short problems
Different teams use different numbers
Action follows after the event
Live scorecard
Updated through the shift
Trends and drifts visible early
One shared definition
Action follows the signal
Live does not mean busy. Keep the scorecard to a few numbers with targets and clear status.
What improvement looks likeBefore and After a Scorecard Programme
Track the same measures before and after. This view is illustrative.
RolloutFive Steps to a Furnace Scorecard
1
Pick the KPIs
Agree five to ten numbers leaders really use.
2
Write the definitions
Specify formulas, units and data sources.
3
Connect and check data
Align time stamps and fix gaps.
4
Build the first view
Run it beside current reports.
5
Add alerts and targets
Set limits and owners, then retire duplicate reports.
KPI list agreed with operations and management
Written definition for each KPI
Process and laboratory data time-aligned
Targets and limits set with owners
Campaign progress method agreed and documented
Views defined for operators, managers and leaders
Data quality checks and stale-data warnings
Monthly review of the dashboard itself
Expert reviewWhat a Blast Furnace Manager Would Check First
Expert review
A scorecard supports good judgement and does not replace it. The best dashboards show a few well-defined numbers, with context that helps experienced people decide.
VerdictStrong when KPIs are defined, time-aligned and tied to named owners.
Watch forBeautiful charts built on misaligned laboratory and process data.
Do nextAgree five KPI definitions with operations and show them live for one furnace.
Frequently asked questionsWhat Steel Leaders Ask About Blast Furnace KPIs
Which KPIs matter most for a blast furnace?
Most plants track productivity, coke and fuel rate, hot metal temperature and chemistry, availability and campaign progress. Add a few that matter for your cost and risk profile, but keep the live view short so leaders can read it quickly.
See a sample KPI set.
How do we show campaign progress honestly?
Present remaining-life estimates as ranges that update with new data, and show the sensors and models behind them. Avoid single-date promises, since conditions and operating choices change the outcome.
Ask about campaign tracking.
Can the dashboard replace our process model?
No. The scorecard summarises results and trends, while process models and operators decide how to run the furnace. Many plants link the two so that model alerts appear on the scorecard.
Discuss model integration.
How do we keep laboratory and process data aligned?
Use common identifiers for casts and consistent time stamps, and check alignment regularly. Misaligned data creates misleading KPIs and arguments between teams.
Ask about data alignment.
How long does it take to build a first scorecard?
A first version with a few KPIs can be built in weeks if data is accessible. Most of the effort goes into definitions and data alignment. Start with one furnace and learn before scaling.
Plan a first build.
Live, defined and shared
Give Your Leaders One Honest View of the Furnace
Book a session with iFactory AI to define your furnace KPIs, align your data and build a live scorecard your team will trust.