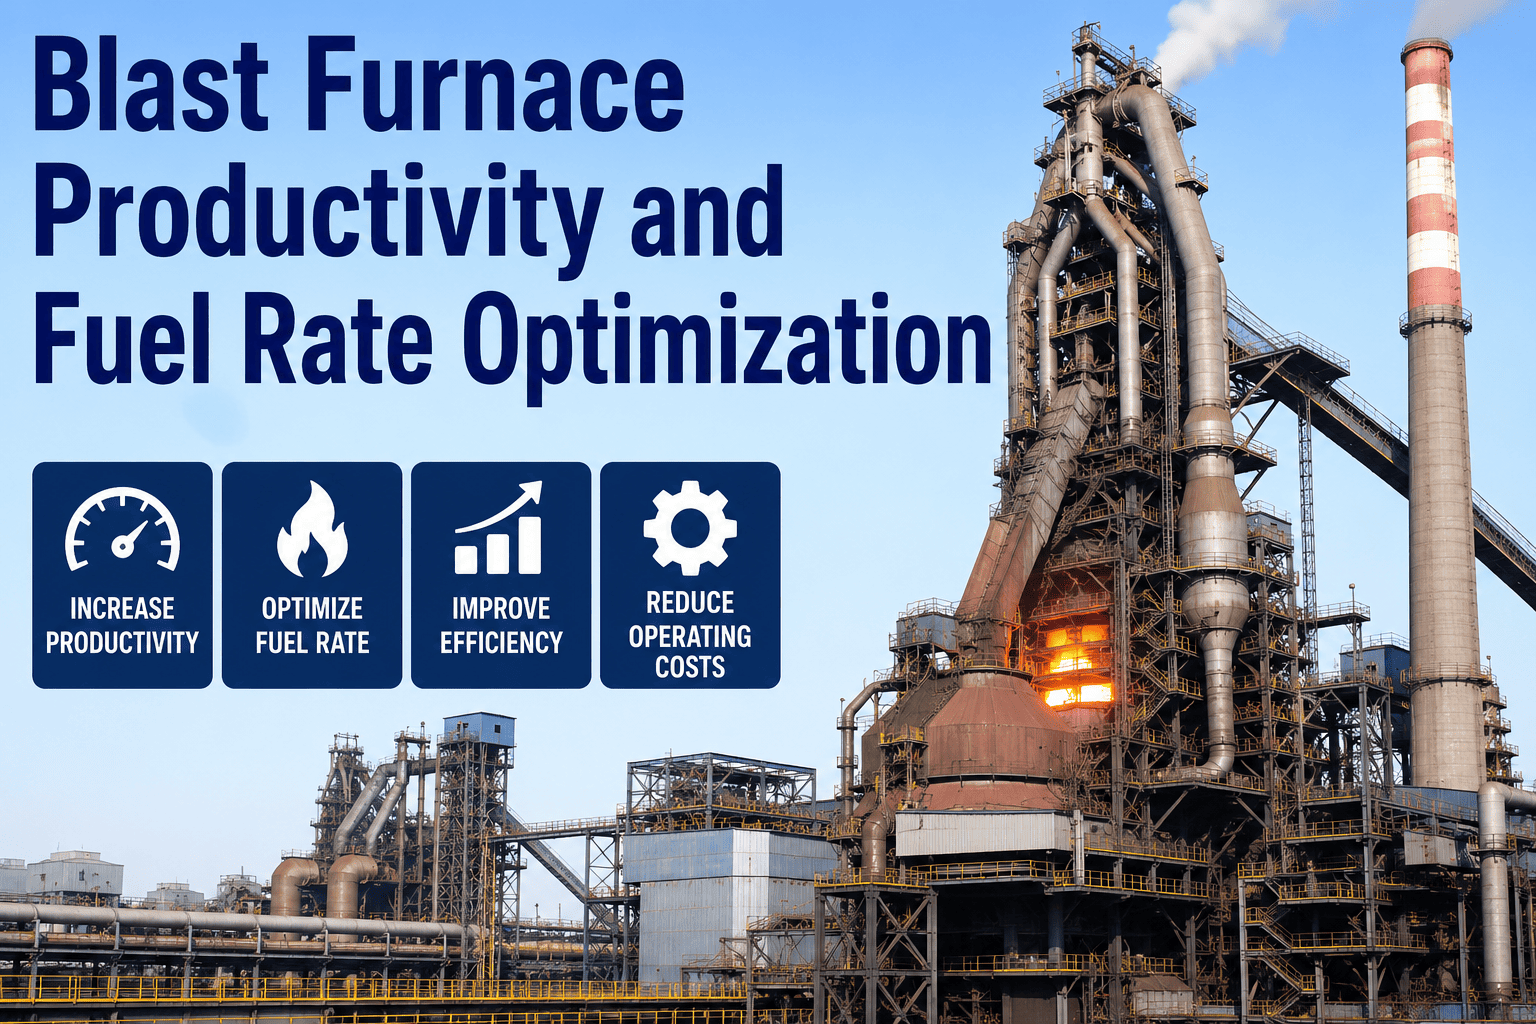
A blast furnace that runs one kilogram of coke higher than it needs to, per tonne of hot metal, is quietly burning through millions of dollars a year without a single alarm going off. The furnace still makes iron, the tap-to-tap times still look fine on the shift report, and nobody gets called in at 2 a.m. because of it. That is exactly why fuel rate creep is so dangerous — it hides inside "normal" operation for months before anyone notices the coke bill has grown. iFactory's blast furnace AI reads burden distribution, blast parameters, and top gas data continuously to hold fuel rate at its true achievable floor. Book a fuel rate review to see where your furnace is losing coke today.
Every Kilogram of Coke Rate You Cut Is Pure Margin
AI models trained on your own burden, blast, and top gas data find the fuel rate reduction your furnace can hold safely — not the theoretical number in a textbook, the real one on your stack.
What One Kilogram of Coke Rate Is Actually Worth
Plant managers rarely see fuel rate translated into hard currency until it is far too late in the budget cycle. Laid out plainly, the numbers explain why even a modest, sustained reduction changes the plant's annual result.
estimated annual saving per major BF for each 1 kg/THM sustained coke rate cut
of total hot metal cost typically tied to coke and fuel consumption alone
productivity gain commonly reported when fuel rate optimization also stabilizes permeability
typical window for an AI fuel rate model to show a validated, repeatable reduction
The Three Levers That Actually Move Fuel Rate
Coke rate is not one number you push down directly — it is the outcome of burden distribution, blast conditions, and raw material quality working together. Most plants optimize one lever at a time and leave the interaction effects on the table.
Burden distribution
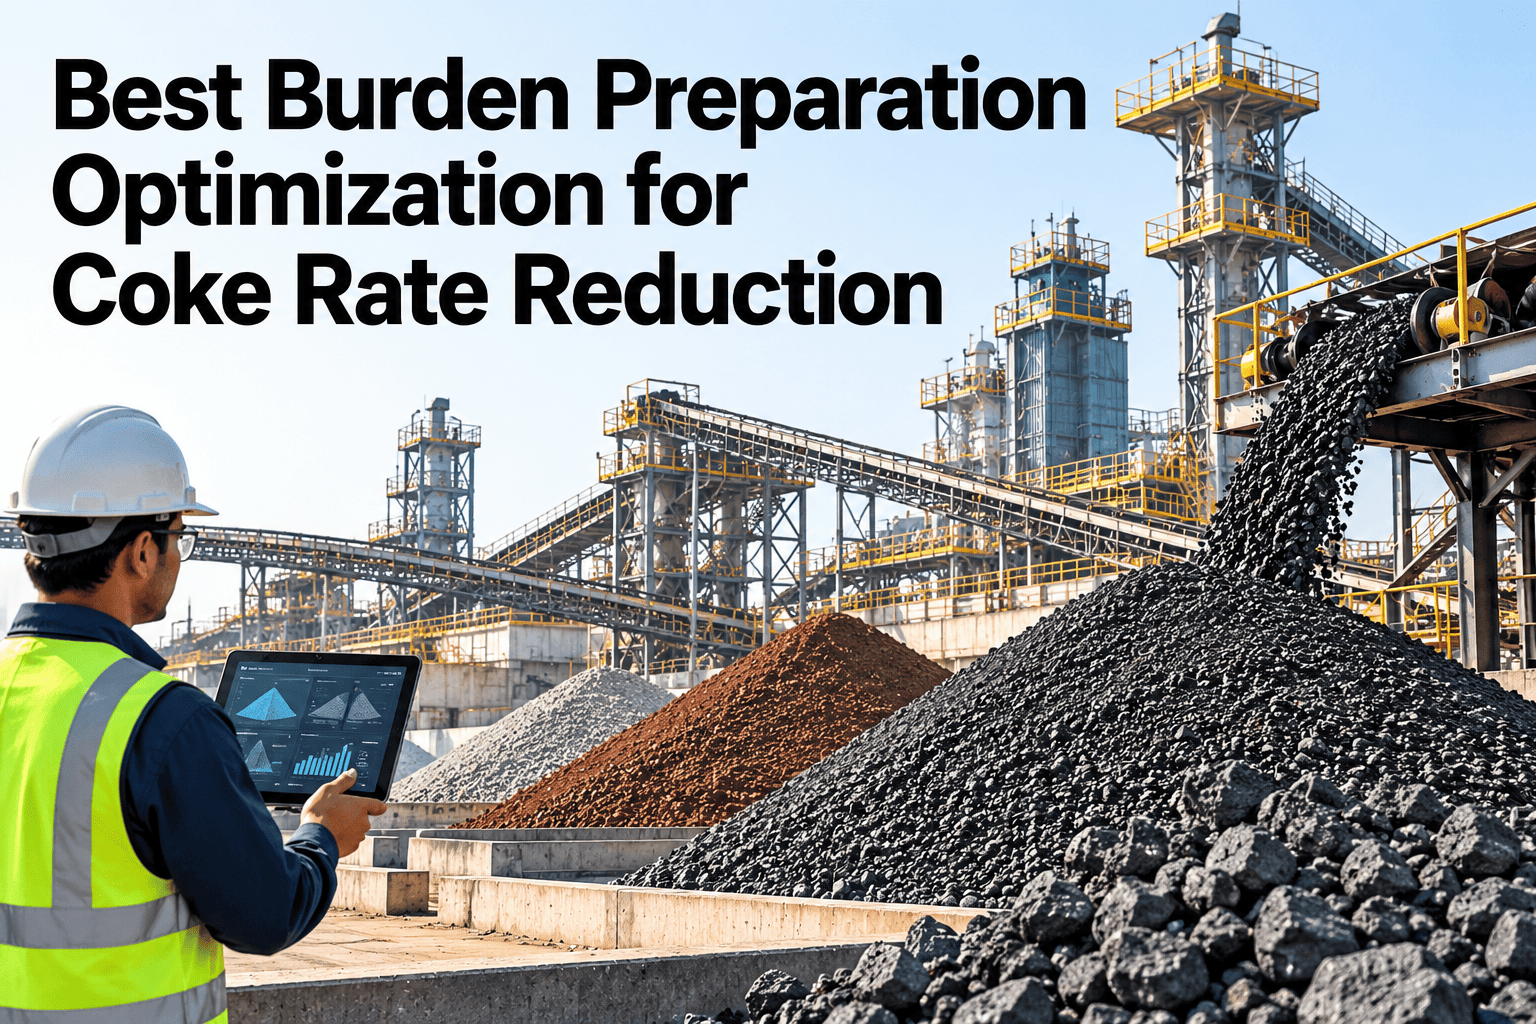
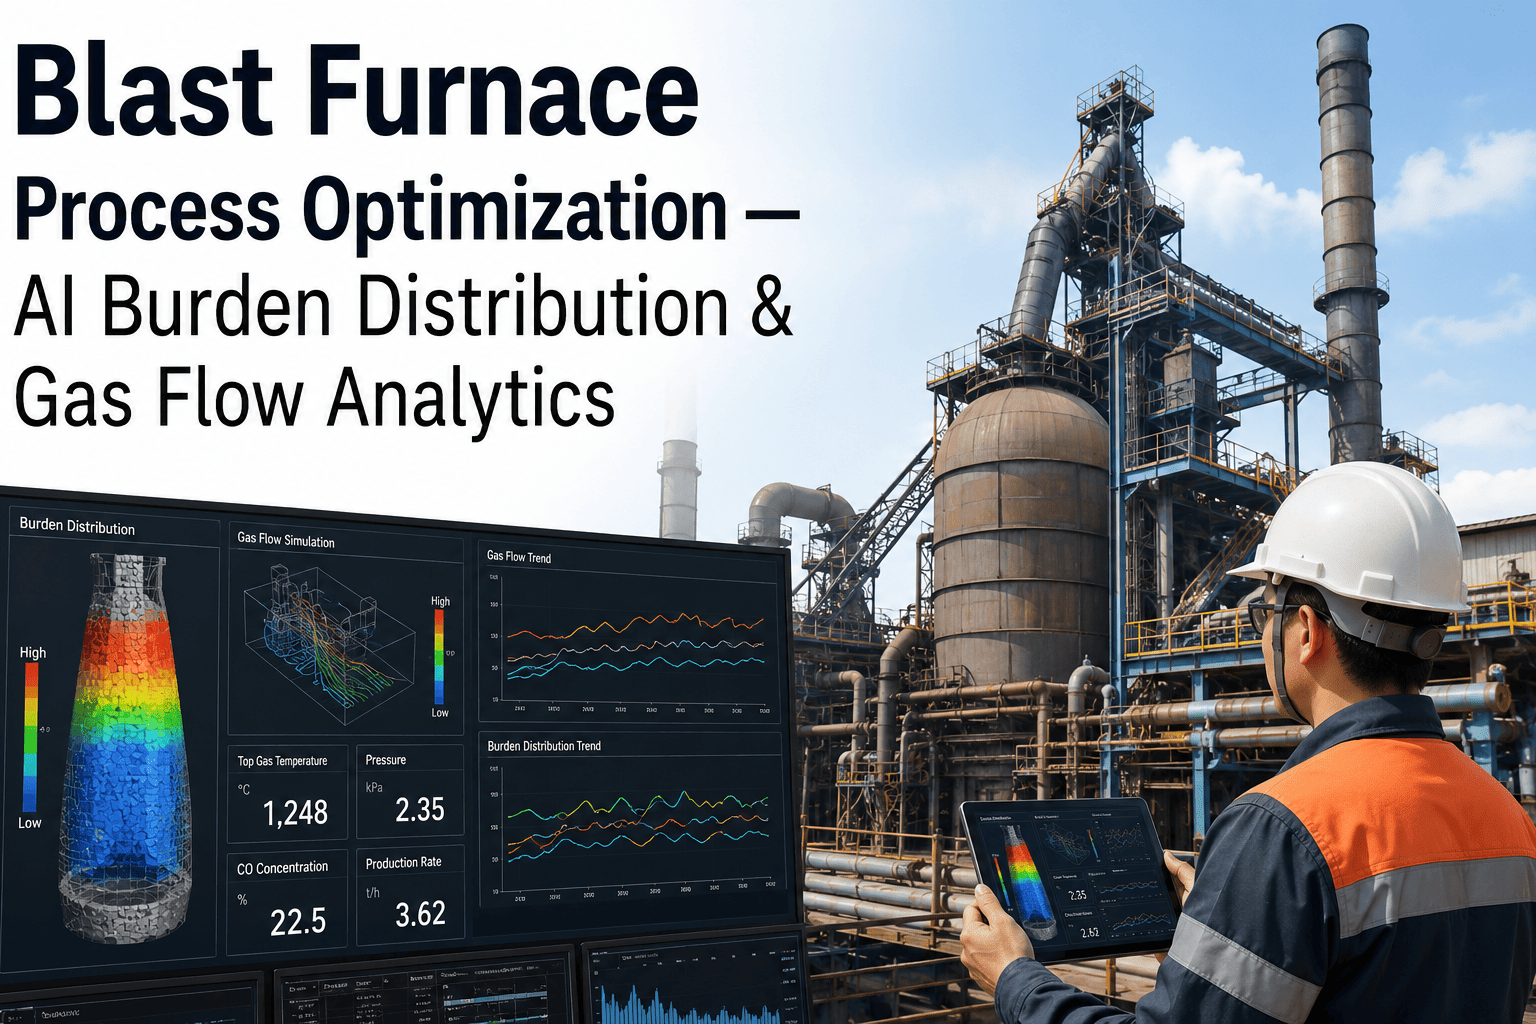
Ore-to-coke layer thickness and charging sequence set the gas flow pattern through the stack. A burden profile that is even slightly off center wastes reducing gas at the wall while starving the center of heat.
Blast parameters
Blast temperature, moisture, and oxygen enrichment set how much thermal and chemical energy enters the furnace per unit of coke. Small daily drift in any of these compounds into a real fuel rate penalty by month end.
Raw material quality
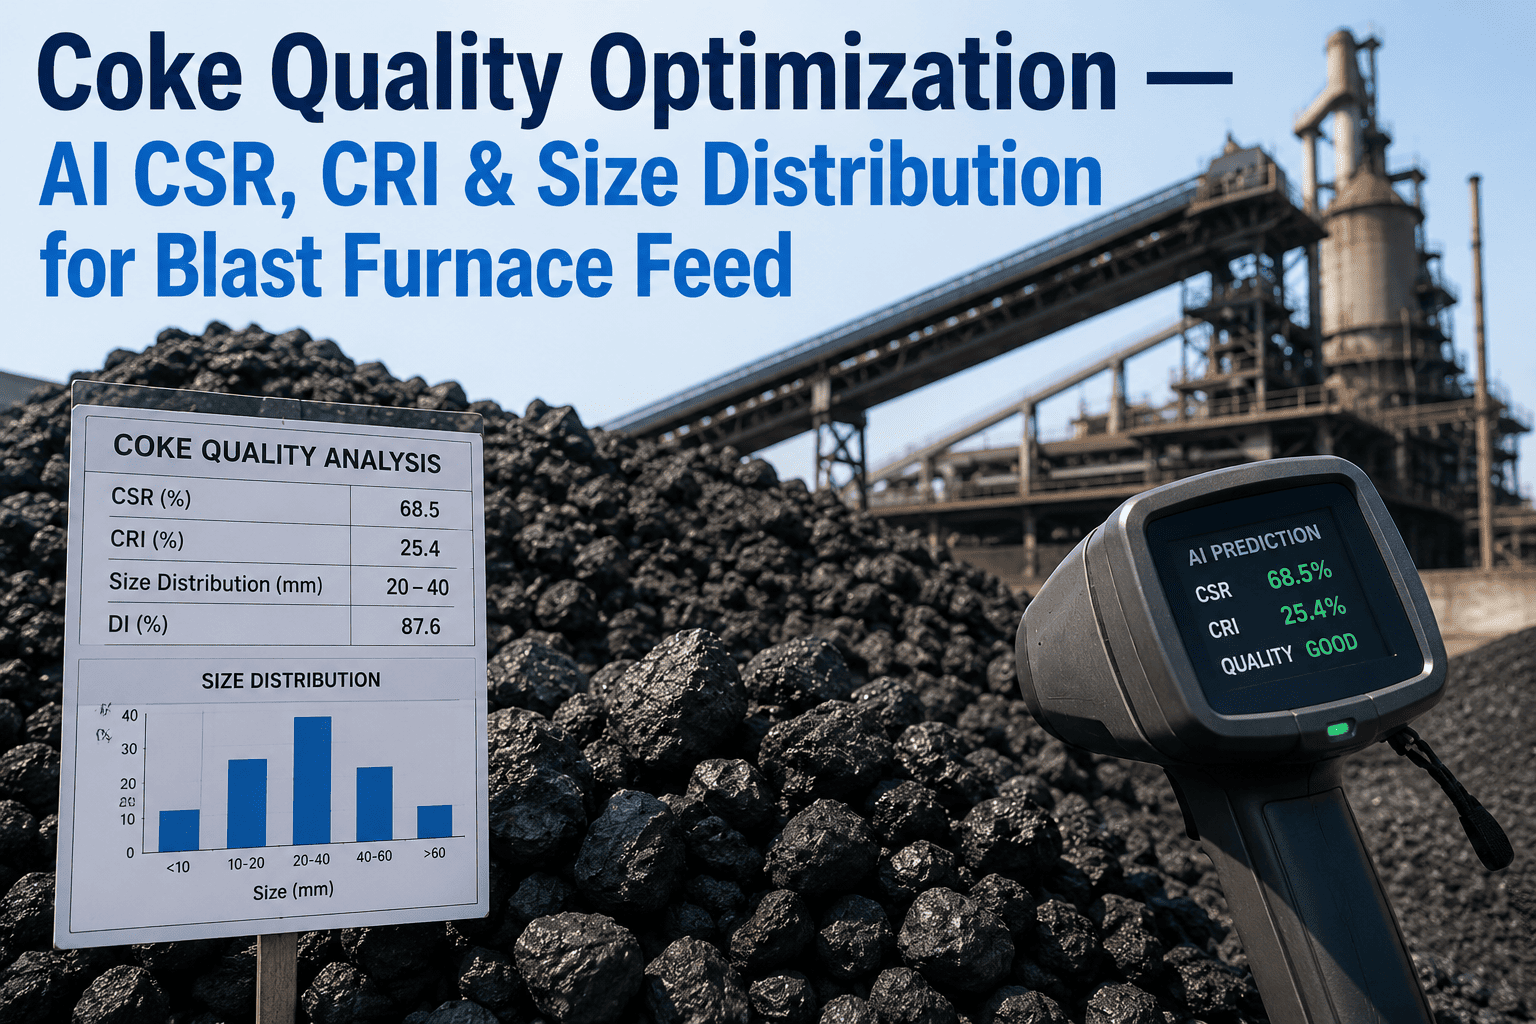
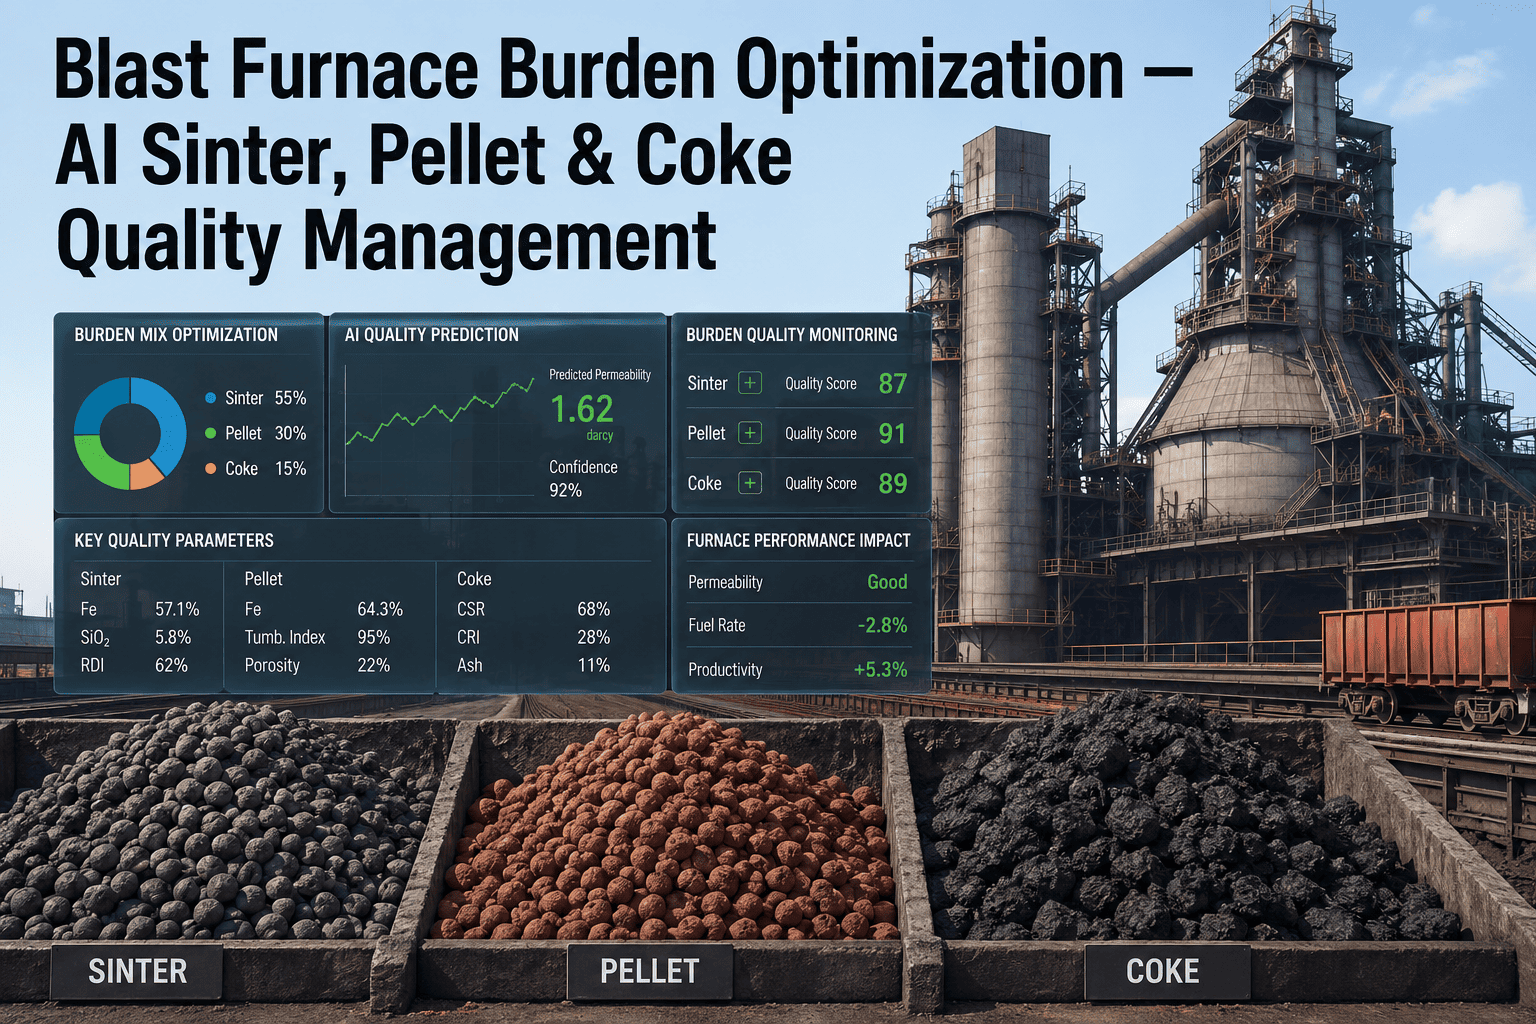
Sinter RDI, coke CSR, and pellet swelling all change how efficiently reducing gas is used inside the furnace. Fuel rate models that ignore incoming material quality end up chasing symptoms instead of causes.
How the AI Model Finds Your Real Fuel Rate Floor
Rather than prescribing a generic target, the model learns the specific relationship between your furnace's inputs and its actual fuel consumption, then tests how far that relationship can be pushed without risking stability.
Historical baselining
Two to three years of burden, blast, and top gas data are used to establish your furnace's actual fuel rate response curve, not an industry benchmark.
Live correlation tracking
The model continuously correlates burden profile changes, raw material quality shifts, and blast parameter drift against fuel rate outcome, in near real time.
Safe-range recommendation
Operators receive a specific burden or blast adjustment with a defined safe range, rather than an abstract target that leaves the how up to guesswork.
Stability guardrails
Every recommendation is checked against permeability and hearth temperature stability limits, so a fuel rate gain never comes at the cost of furnace upset risk.
Continuous re-learning
As raw material sources and campaign age change, the model retrains against the newest data so the recommended fuel rate floor keeps moving with reality.
See Your Furnace's Actual Fuel Rate Floor
iFactory runs a no-obligation analysis on your last twelve months of burden, blast, and top gas data to show exactly how much coke rate is realistically on the table.
Fuel Rate Benchmarks by Furnace Class
Fuel rate targets vary with furnace volume, burden mix, and blast practice, but these ranges reflect what well-run integrated furnaces typically achieve at steady campaign life.
What Changes After Twelve Months on the Model
Figures reported by plant teams comparing the twelve months before AI fuel rate optimization against the twelve months after.
A Plant Manager's View on Fuel Rate Discipline
We had chased fuel rate with spreadsheets for years and always hit the same wall — every improvement plan assumed stable raw material quality, and our sinter and coke never held still long enough to prove anything out. The model finally separated what was actually burden and blast versus what was incoming material quality. That distinction alone let us act on the right lever instead of guessing every week.
Five Reasons Fuel Rate Creeps Upward Unnoticed
Fuel rate rarely jumps overnight. It drifts a fraction of a kilogram at a time, for reasons that individually look harmless on any single shift report.
Raw material substitution
A cheaper sinter or coke source enters the burden mix without a corresponding adjustment to burden distribution, and the fuel rate penalty is absorbed silently.
Shift-to-shift practice variation
Different shifts run slightly different blast and burden practices based on individual experience, and the furnace never settles onto one true optimum.
Campaign age effects
As refractory wears and the working volume profile changes, the burden distribution that used to be optimal quietly stops being optimal.
Instrument drift
Blast moisture, oxygen, and top gas analyzers drift out of calibration gradually, feeding slightly wrong numbers into every manual fuel rate decision.
No feedback loop to burden design
Without a live model connecting outcome back to cause, burden distribution changes are made on instinct and rarely tested against what actually happened last time.
Fuel Rate Health Check: What to Review This Month
Before committing to a full AI deployment, these are the same checks the model runs first — and most plants can start reviewing them manually today.
Fuel rate trend over the last twelve months plotted against raw material source changes, not just against production volume
Burden distribution practice compared shift to shift for the same nominal charging program
Blast moisture and oxygen enrichment sensor calibration confirmed within the last maintenance cycle
Sinter RDI and coke CSR trends reviewed against fuel rate for the same period, to separate cause from symptom
Furnace upset events cross-checked against any recent fuel rate reduction attempt, to see if stability was actually tested
Campaign age and working volume profile reviewed for whether the current burden design still matches furnace geometry
Frequently Asked Questions
How much fuel rate reduction is realistic without new equipment?
Most furnaces running standard burden and blast practice without a live optimization model carry 3 to 10 kg/THM of avoidable fuel rate, achievable through burden distribution and blast parameter adjustment alone. The exact figure depends on furnace class, campaign age, and current raw material variability, which is why a data-based scoping review matters more than a generic industry number.
Does this require new sensors on the furnace?
In most cases, no. The model works from existing burden, blast, and top gas instrumentation already installed on modern furnaces. Book a demo to review what your current instrumentation already provides before any new hardware is discussed.
How does the model handle raw material quality changes?
Sinter RDI, coke CSR, and pellet quality are treated as live inputs, not constants. When incoming material quality shifts, the model recalculates the safe fuel rate range rather than continuing to recommend an adjustment based on stale assumptions.
Can this be rolled out on more than one furnace at a plant?
Yes. Each furnace gets its own trained model since geometry, campaign age, and burden practice differ, but the deployment process and operator interface stay consistent across furnaces, which shortens rollout time for the second and third units significantly.
What does a typical implementation timeline look like?
Historical baselining and model validation typically run four to six weeks, with live recommendations rolled out to operators shortly after. Talk to a specialist about fitting a pilot into your current production schedule.
Find Your Furnace's Hidden Fuel Rate Savings
Book a 30-minute scoping call and bring twelve months of burden, blast, and top gas data. iFactory shows exactly how many kilograms per tonne are realistically recoverable on your furnace.