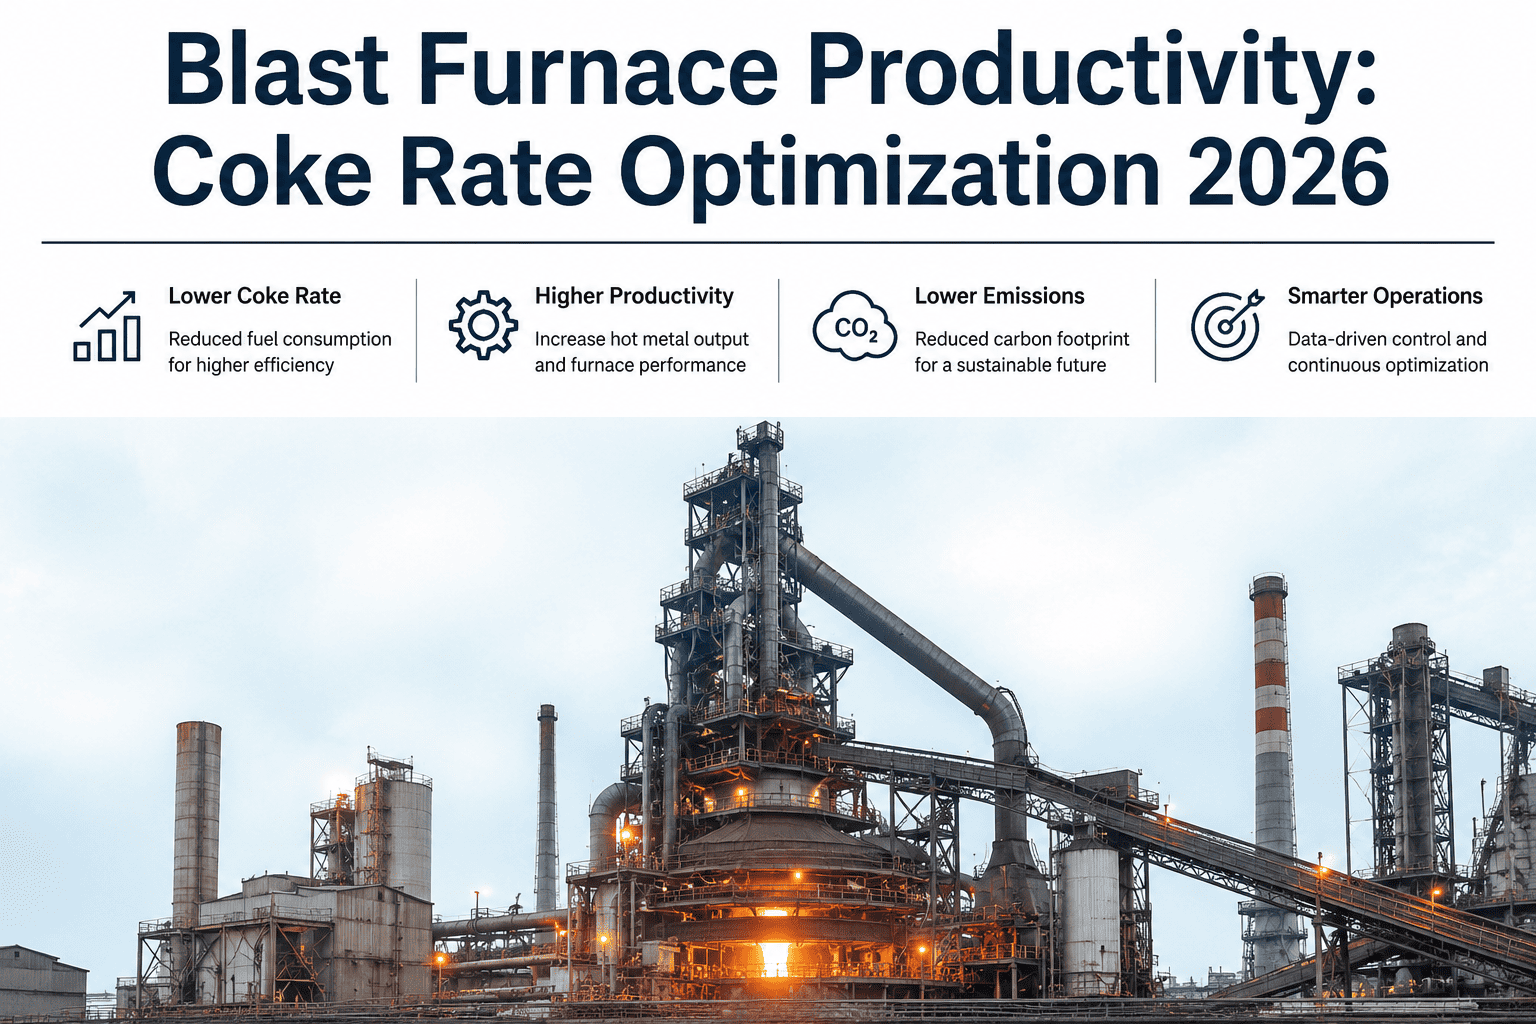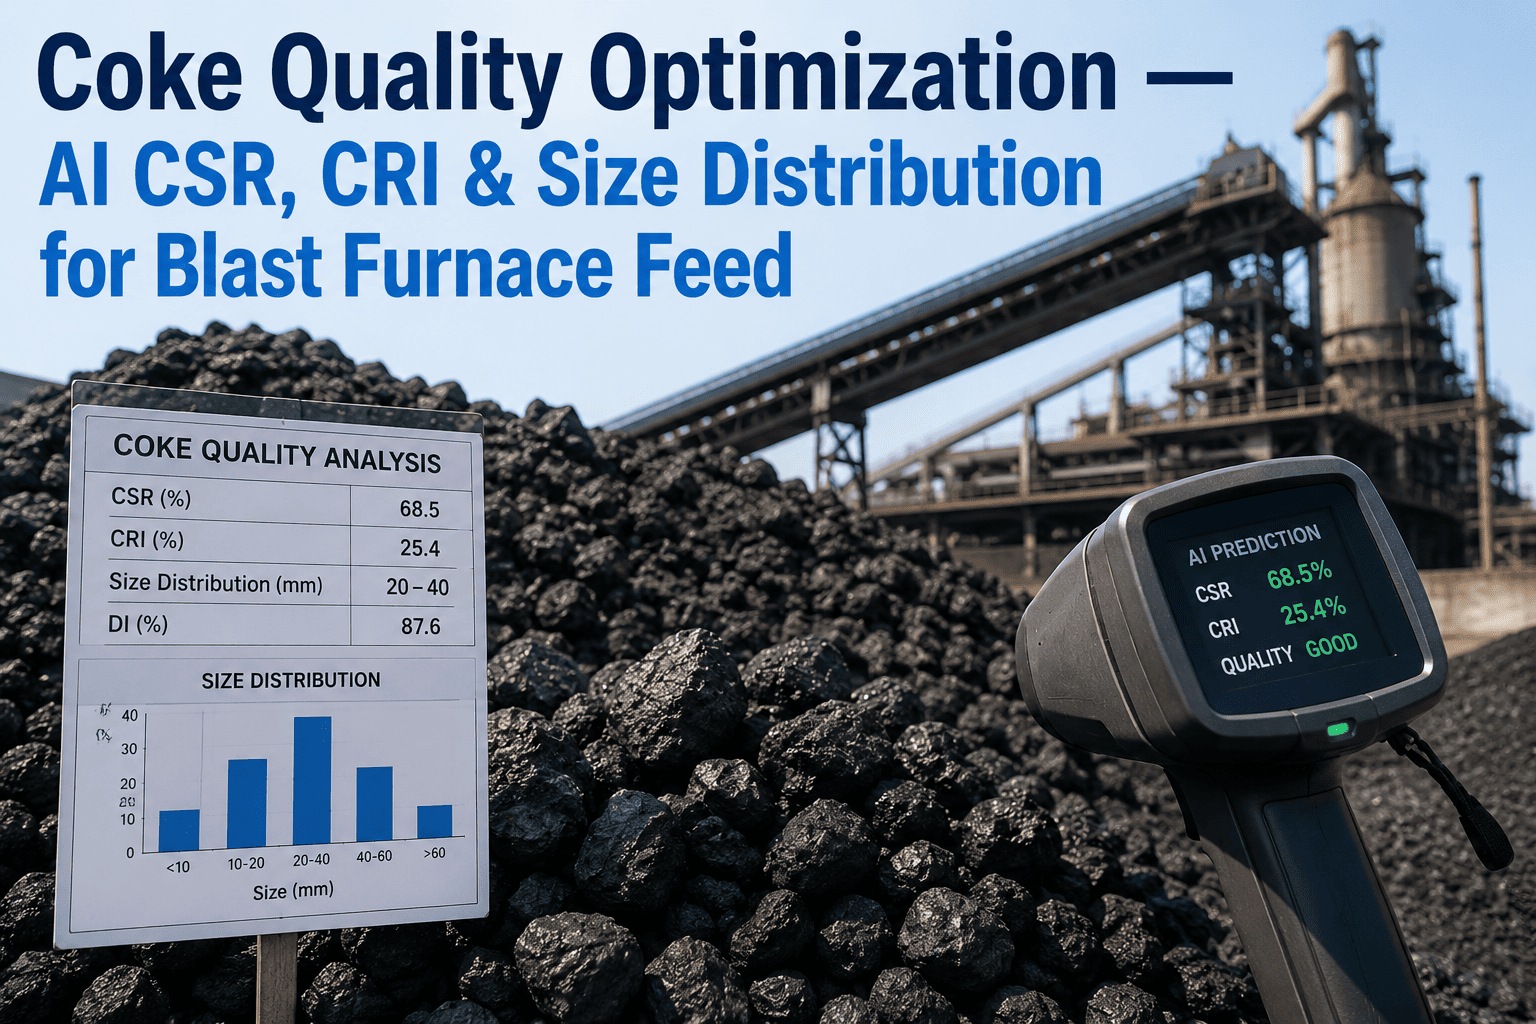
Coke accounts for roughly 60% of hot metal production cost through the blast furnace route, and its two defining properties — CSR and CRI — vary from laboratory to laboratory even under identical test methodology. A coke that reacts too fast inside the furnace, or crumbles under the weight of the burden above it, forces the operations team to raise the coke rate just to hold productivity steady. On a mid-size blast furnace, improving CSR by a single point alongside modest ash and sulfur reductions can save several million dollars a year at current coke pricing. The real challenge is catching quality drift before a full batch of degraded coke has already been charged into the furnace. Book a demo to see how iFactory tracks CSR, CRI, and size distribution continuously.
CSR reflects coke's hot strength — its capacity to keep supporting the burden as it descends through the furnace. CRI measures how much mass the coke loses to gas-solid reaction before it gets the chance to do that job. Modern blast furnaces above 5,000 cubic meters working volume demand consistently high CSR and moderate CRI, because a single bad batch degrades gas permeability across the whole stack, not just the layer it sits in.
What CSR and CRI Actually Measure — and Why the Test Itself Is Imperfect
The standard ASTM D5341 test heats a 200 gram coke sample to 1100°C in nitrogen, reacts it with carbon dioxide for two hours, then tumbles the cooled sample for 600 revolutions and measures what remains above a 10mm sieve. CRI is the weight percentage consumed during the reaction; CSR is the weight percentage remaining intact after the subsequent tumble. Together they simulate what coke experiences descending through a real blast furnace — thermal load, gas-solid reaction, and mechanical stress from the burden above.
The catch is that CRI and CSR results vary between laboratories running the identical procedure on the same coke, because reactivity depends heavily on how individual coke pieces happen to sit and react inside the test chamber. Research on sample holder design confirms that a variation of roughly ±2 points in CRI or CSR does not meaningfully change how the coke performs in the furnace — but drift beyond that range does, and catching it requires more frequent, more consistent measurement than a periodic lab batch test alone can provide.
The Chain Reaction: Coke Quality to Coke Rate to Furnace Cost
Gas permeability in the granular and lower zones is one of the most important functions coke serves in the furnace, and it depends heavily on coke size distribution at every level of the stack. Once fines accumulate faster than expected, the operations team has no lever left except burning more coke to hold hot metal output steady.
Size Distribution: The Property That Gets Less Attention Than It Deserves
CSR and CRI dominate the conversation because they are the standardized, widely reported numbers. Size distribution gets less attention, despite being the property that most directly governs gas permeability through the burden. A large mean coke size with a narrow distribution maintains adequate permeability; a wide distribution with excess fines chokes gas flow regardless of how good the CSR number looks on paper. Start free trial to see size distribution tracked alongside CSR and CRI in one dashboard.
Coke also degrades physically between the coke plant wharf and the blast furnace stock house — every transfer point, drop height, and conveyor transition breaks down coke particles further. A coke batch that tested well in the lab can still arrive at the furnace with a meaningfully different size distribution than what left the coke plant, which is a gap continuous monitoring closes and periodic lab sampling cannot.
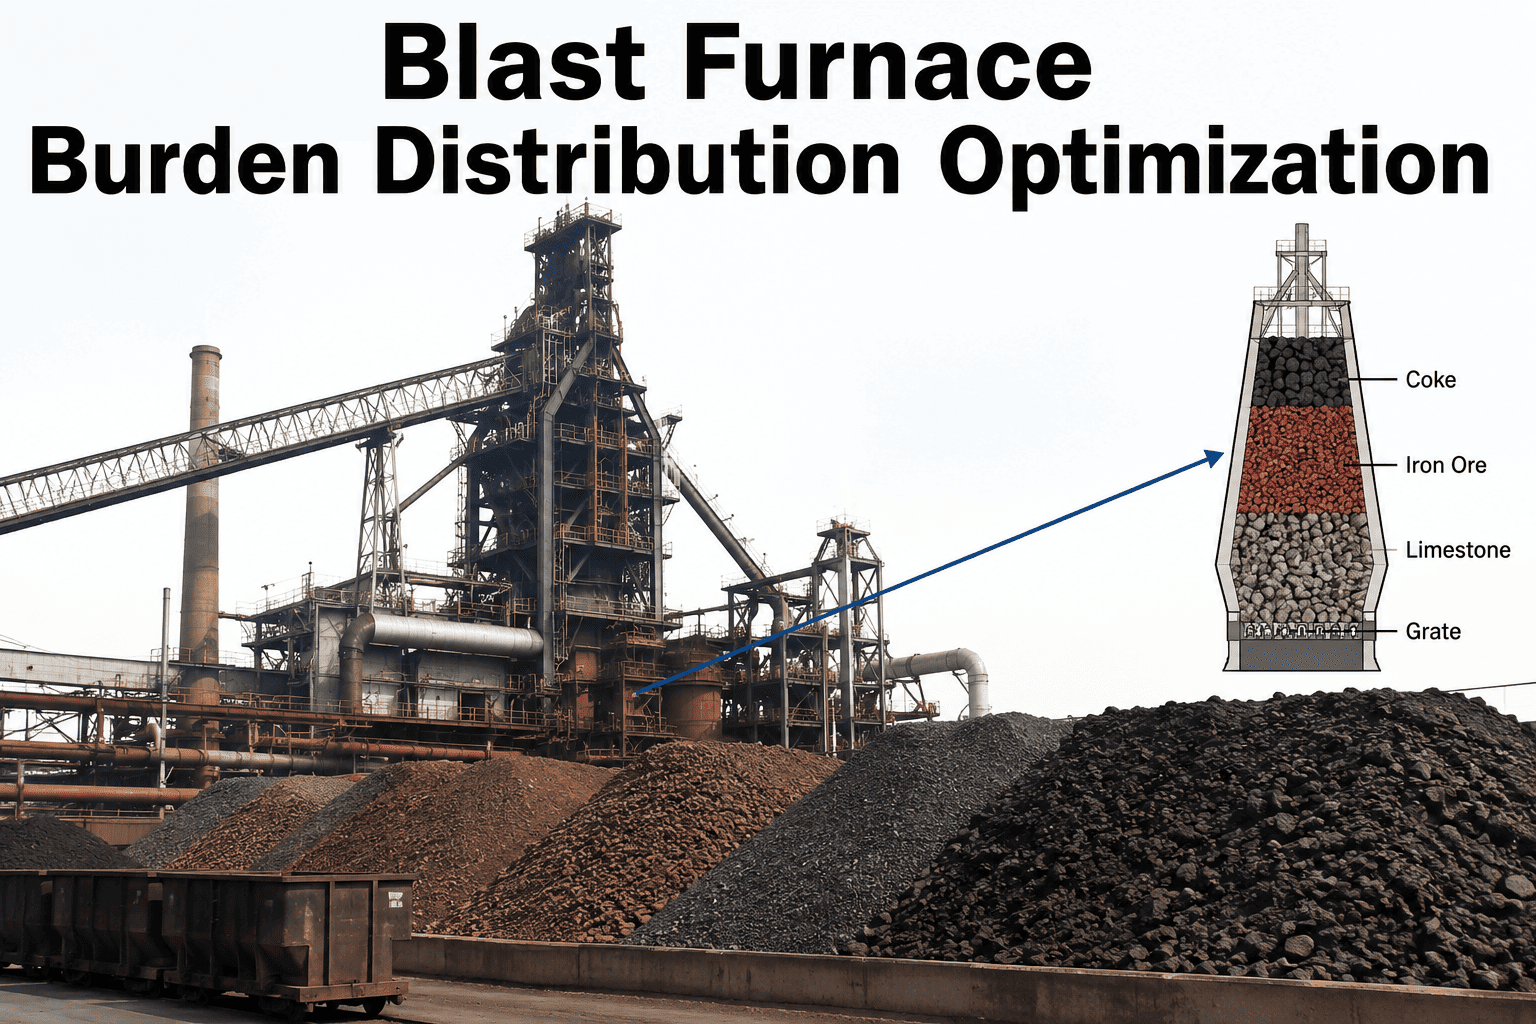
Coke's job is mechanical as much as chemical. It has to support the entire burden mass with minimal degradation while remaining permeable enough for reducing gases to flow upward and molten material to flow downward. A coke that meets CSR spec on paper but breaks apart in handling before it reaches the furnace never gets the chance to prove that number correct.
Where AI Changes the Equation for Coke Quality Control
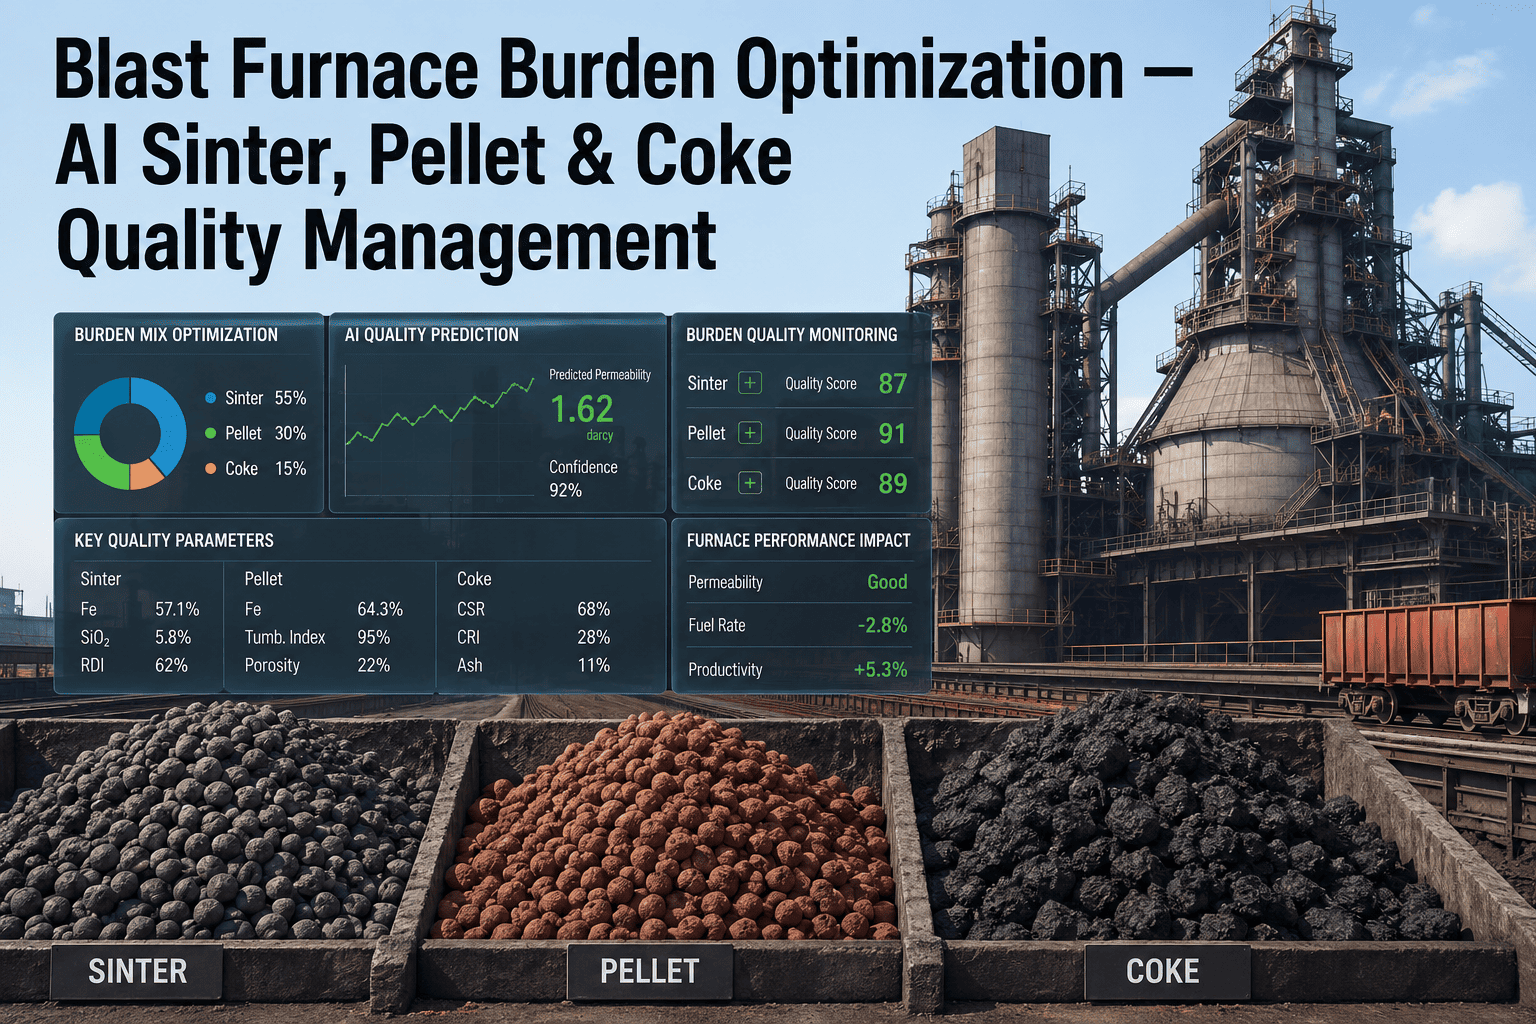
Traditional coke quality control relies on periodic lab testing — samples pulled at set intervals, tested over hours, with results arriving well after that batch has already moved toward the furnace. AI-based prediction models trained on physicochemical coal properties can now estimate CRI and CSR with strong accuracy without waiting for the full laboratory test cycle, giving process engineers a continuous read on quality trends rather than isolated snapshots.
What This Looks Like in Daily Practice
| Monitoring Layer | Traditional Approach | AI-Supported Approach | Review Cadence |
|---|---|---|---|
| CSR / CRI Tracking | Batch lab test, hours to results | Predictive model plus lab validation | Continuous, daily review |
| Size Distribution | Periodic screening samples | Tracked wharf to stock house | Per shipment or shift |
| Coal Blend Correlation | Manual review post-production | Predictive pre-production modeling | Per blend change |
| Furnace Permeability Link | Inferred after pressure drop event | Correlated proactively with coke trends | Continuous, shift-level |
Stop Discovering Coke Quality Drift After It Reaches the Furnace
iFactory correlates coal blend data, coking parameters, and lab test results into a continuous CSR, CRI, and size distribution trend line — flagging drift while there is still time to adjust the blend, not after a degraded batch is already charged.
What Coke Ovens Report After Adopting Continuous Quality Tracking
Frequently Asked Questions
Turn Coke Quality Into a Tracked Metric, Not a Periodic Surprise
iFactory connects coal blend data, predictive CSR and CRI modeling, size distribution tracking, and blast furnace gas permeability into one continuous view — so drift gets caught while there's still time to act on it.