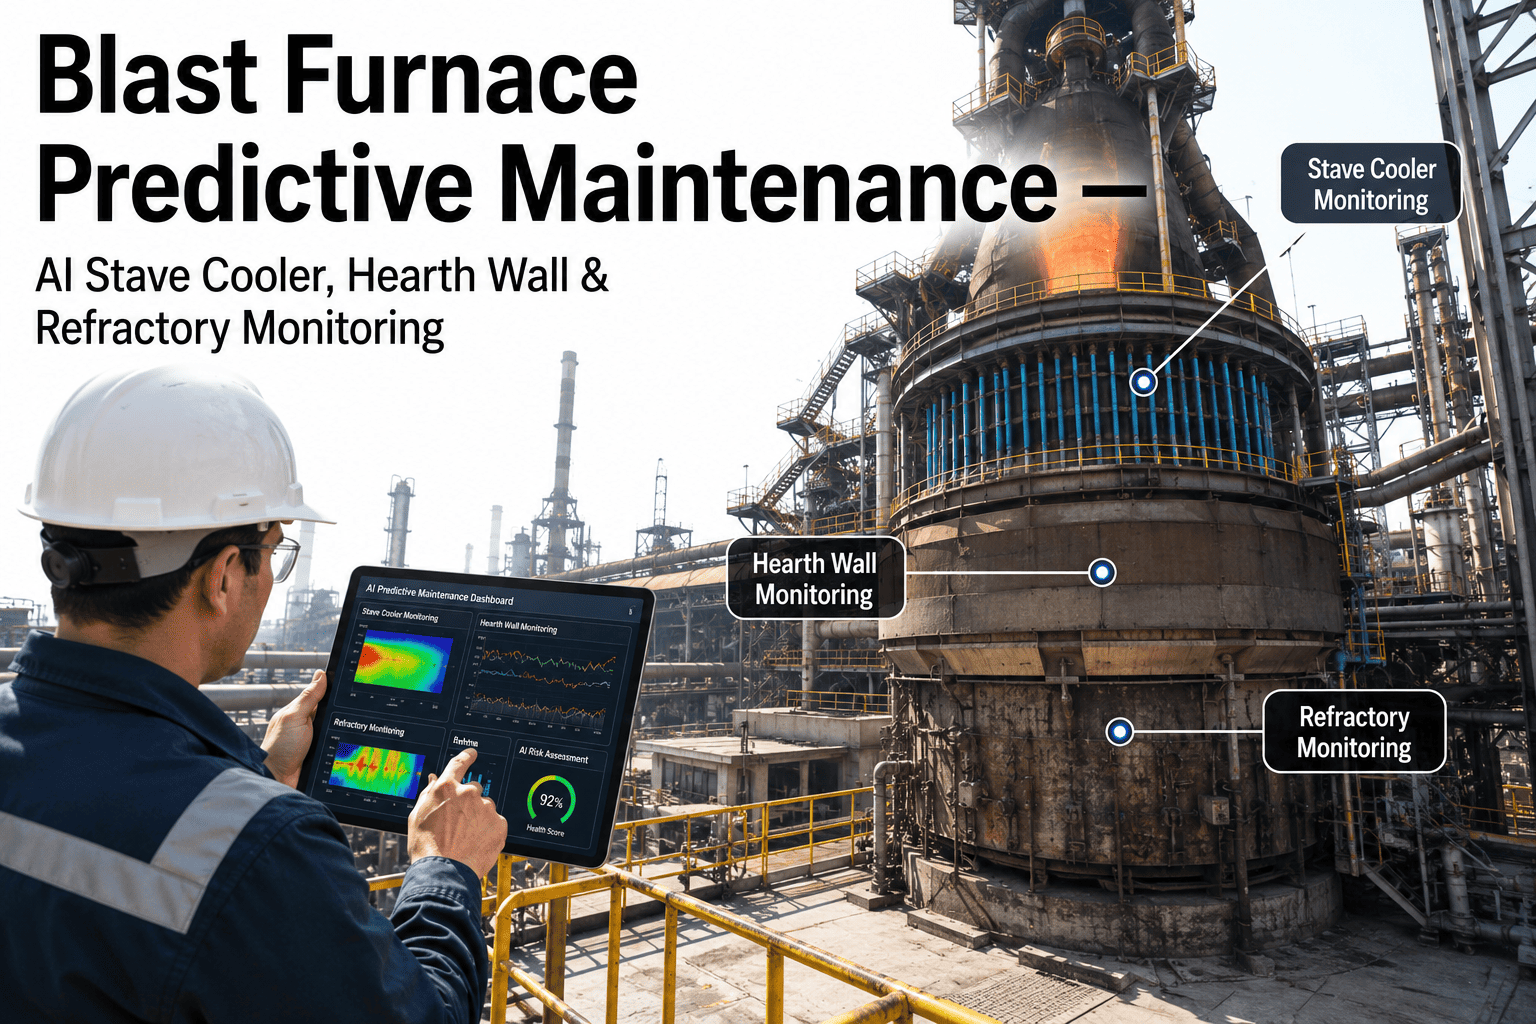
Hearth erosion is the single variable that ultimately decides when a blast furnace campaign ends, yet most furnaces still plan relining timelines around conservative rule-of-thumb estimates rather than the actual erosion pattern their hearth is following. A furnace that could safely run another two years might be relined early out of caution, while another approaching a genuine risk zone might be under-monitored until erosion becomes irreversible. iFactory's Campaign Life AI models hearth erosion progression continuously from thermocouple array data, giving process engineers a defensible, data-driven view of remaining campaign life years before the next reline decision has to be made. Book a demo to see live hearth erosion modeling on a furnace comparable to yours.
±4 mo
Typical accuracy of remaining hearth life projections against actual outcomes
14–20 mo
Average advance planning window gained for reline scope and budget approval
$3.8M
Median value of avoided premature reline or emergency shutdown per furnace
24/7
Continuous erosion progression tracking across the full hearth thermocouple array
A Reline Decision Made a Year Too Early Costs Millions. Made a Year Too Late, It Costs the Furnace.
iFactory converts your hearth thermocouple array into a continuously updated erosion model, replacing rule-of-thumb campaign life estimates with a projection grounded in your furnace's actual wear pattern.
Why Rule-of-Thumb Campaign Life Estimates Fall Short
Traditional campaign life planning often relies on generalized wear rate assumptions applied uniformly across the hearth, adjusted periodically based on periodic thermocouple spot checks. This approach was reasonable when computational tools for continuous multi-point erosion modeling weren't practical — but it leaves real gaps in accuracy.
✓
Erosion is rarely uniform across the hearth floor and sidewall — localized wear at the tap hole or in specific sidewall zones often outpaces the general average significantly.
✓
Wear rate is not constant over a campaign — it responds to burden composition, hot metal chemistry, and operating intensity changes that shift over years.
✓
Periodic spot checks miss inflection points — a wear rate acceleration between two scheduled review dates can go undetected for months.
✓
Conservative safety margins compound — each layer of caution added to a rule-of-thumb estimate can add months or years to a reline timeline that may not be operationally necessary.
None of these limitations reflect a lack of expertise on the part of process engineering or refractory teams. They reflect the practical difficulty of manually synthesizing continuous, multi-point thermocouple data into a single defensible remaining life number, especially across a hearth with dozens or hundreds of individual measurement points and years of operating history to account for. This is fundamentally a data synthesis problem, and it is the kind of problem that continuous computational modeling is well suited to address without replacing the engineering judgment that ultimately makes the final call.
How iFactory Models Hearth Erosion From Thermocouple Data
Your hearth thermocouple array already captures the temperature data needed to model erosion progression accurately — the gap is usually in how continuously and systematically that data is analyzed. Talk to a process engineer about how the erosion model is calibrated to your hearth's thermocouple layout.
01
Continuous Isotherm Reconstruction
Thermocouple readings across the array are used to continuously reconstruct the 1,150°C isotherm position, the standard reference used to estimate remaining refractory thickness.
02
Zone-by-Zone Wear Rate Tracking
Erosion rate is tracked independently for the tap hole area, sidewall zones, and hearth floor, rather than a single hearth-wide average that can mask localized risk.
03
Operating Condition Correlation
Wear rate changes are correlated against burden composition and operating intensity shifts, helping distinguish genuine acceleration from short-term thermal noise.
04
Rolling Remaining Life Projection
A continuously updated remaining campaign life estimate is generated for each hearth zone, with confidence bounds that narrow as more operating data accumulates.
Give Your Reline Planning Committee a Projection They Can Defend
Replace generalized wear rate assumptions with a zone-by-zone erosion model built from your own thermocouple array and operating history.
Rule-of-Thumb Estimates vs. Continuous Erosion Modeling
The practical difference between the two approaches becomes clearest when comparing how each performs on the specific decisions campaign life planning actually requires.
Why Continuous Modeling Changes the Relining Conversation
The value of continuous erosion modeling is not just accuracy for its own sake — it changes what kind of conversation is possible with plant leadership and capital planning committees about reline timing. A rule-of-thumb estimate delivered with wide safety margins tends to force an early, defensive decision because there is no data-backed way to argue for extending the campaign.
A zone-by-zone erosion model with narrowing confidence bounds allows a different kind of conversation. If the tap hole zone is eroding faster than the sidewall but both remain within acceptable bounds for another eighteen months, that is a specific, defensible statement a process engineer can bring to a capital planning meeting — rather than a general sense of caution that defaults to the most conservative available date.
This also changes how reline scope itself gets planned. Understanding which specific zones are approaching their limits, rather than treating the entire hearth as uniformly worn, allows targeted repair strategies in some cases instead of a full reline, depending on the erosion pattern observed. That distinction alone can represent a significant difference in both cost and outage duration.
There is also a cross-campaign learning benefit that compounds over time. Every campaign a furnace runs with continuous erosion modeling adds validated data to the relationship between operating conditions and actual wear outcomes at that specific furnace. By the second or third campaign running under this approach, projections tend to be built on a foundation of the furnace's own demonstrated behavior rather than generalized industry wear rate assumptions, which is part of why projection accuracy tends to improve with each successive campaign.
Deployment Path: From Thermocouple Audit to Live Erosion Model
Deployment is structured around your hearth's existing thermocouple array and historical operating record, with no requirement for new refractory instrumentation to begin.
Week 1–2
Thermocouple array audit and mapping; historical temperature and burden composition data collected across the campaign to date.
Week 3–5
Zone-by-zone erosion model built and validated against any available refractory inspection or coring data from past outages.
Week 6
Live rolling projection activated, with confidence bounds and zone-level detail delivered to process engineering.
Week 7–8
Reporting format finalized for capital planning integration; team trained on interpreting confidence bounds and zone trends.
What Gets Delivered to Process Engineering
The output of iFactory's campaign life model is built around the specific documents and decisions process engineers and capital planning teams need, rather than raw thermocouple trend exports that still require manual interpretation.
✓
Zone-by-zone remaining life estimates with confidence bounds, updated continuously as new thermocouple data accumulates through the campaign.
✓
Wear rate acceleration alerts flagged as soon as a zone's erosion trend becomes statistically distinguishable from its established baseline pattern.
✓
Capital planning-ready reporting formatted for direct inclusion in reline budget documentation, reviewable by both technical and financial stakeholders.
✓
Operating condition correlation notes that connect wear rate changes to burden composition or operating intensity shifts, supporting root cause discussion.
Results from Furnaces Running iFactory Campaign Life Modeling
The following outcomes reflect process engineering teams that replaced rule-of-thumb campaign life estimates with continuous, zone-by-zone erosion modeling. Request the detailed erosion case data for a furnace comparable to yours.
Integrated Steelworks — 3,800 m³ Furnace, 14-Year Campaign
A conservative rule-of-thumb estimate had targeted reline planning to begin within eight months, based on a general hearth-wide wear rate assumption that had been carried forward with minimal revision for several years. iFactory's zone-by-zone model showed the sidewall zones driving that estimate were actually stable, while the tap hole area — not previously flagged as the limiting factor — had meaningfully more remaining margin than assumed, supporting a full campaign extension backed by confidence-bound projections the capital planning committee could review directly.
16 moCampaign life extension supported by the model
$4.1MValue of deferred reline capital expenditure
±3 moModel accuracy validated at eventual reline
Mini-Mill Operation — 1,600 m³ Furnace, Mid-Campaign
A localized sidewall erosion acceleration near the tap hole was developing faster than the furnace's hearth-wide average suggested, a pattern the previous quarterly review cycle had not yet caught. iFactory's continuous zone tracking flagged the acceleration within three weeks of onset, allowing a targeted cooling and operational adjustment that slowed the localized wear rate before it became the limiting factor for the whole campaign.
3 wksTime to detect localized wear acceleration
9 moEstimated campaign life preserved through early intervention
$1.9MEstimated value of preserved campaign life
Frequently Asked Questions
Does iFactory require new thermocouples in the hearth?
No. The erosion model is built from your existing hearth thermocouple array. The Week 1-2 audit reviews the current array layout and density, which does affect the resolution of zone-by-zone tracking, but no new thermocouples or refractory modifications are required to begin modeling.
How accurate is the remaining campaign life projection?
Deployments have shown projection accuracy within roughly plus or minus four months against actual outcomes, validated across multiple completed campaigns. Accuracy improves over time as more of your furnace's own operating history accumulates in the model, which is why projections tend to narrow their confidence bounds as a campaign progresses.
Can the model support a decision to extend a campaign rather than reline on schedule?
Yes, when the underlying erosion data supports it. The model reports zone-by-zone remaining life with confidence bounds, and if certain zones are found to have more margin than a general rule-of-thumb estimate assumed, that becomes a data-backed input to a capital planning conversation. You can
talk to support about how this has been used in reline planning committees at comparable furnaces.
Does this replace the judgment of our process engineering and refractory teams?
No. The model is designed to give your process engineers a more accurate, continuously updated data foundation for the judgment calls they already make, not to replace that expertise. Final reline timing and scope decisions remain with your team, informed by the zone-by-zone projections rather than a single hearth-wide estimate.
How does this integrate with existing campaign planning and capital budgeting processes?
Erosion projections and remaining life estimates are delivered in a format suitable for direct inclusion in capital planning documentation, with the underlying data available for review by both technical and financial stakeholders. Most plants integrate the rolling projection into their existing quarterly or annual campaign life review cycle rather than replacing that cycle entirely.
Replace Rule-of-Thumb Campaign Estimates With a Model Built From Your Own Hearth Data
Zone-by-zone erosion tracking, continuous wear rate updates, and confidence-bound remaining life projections your reline planning committee can actually defend.