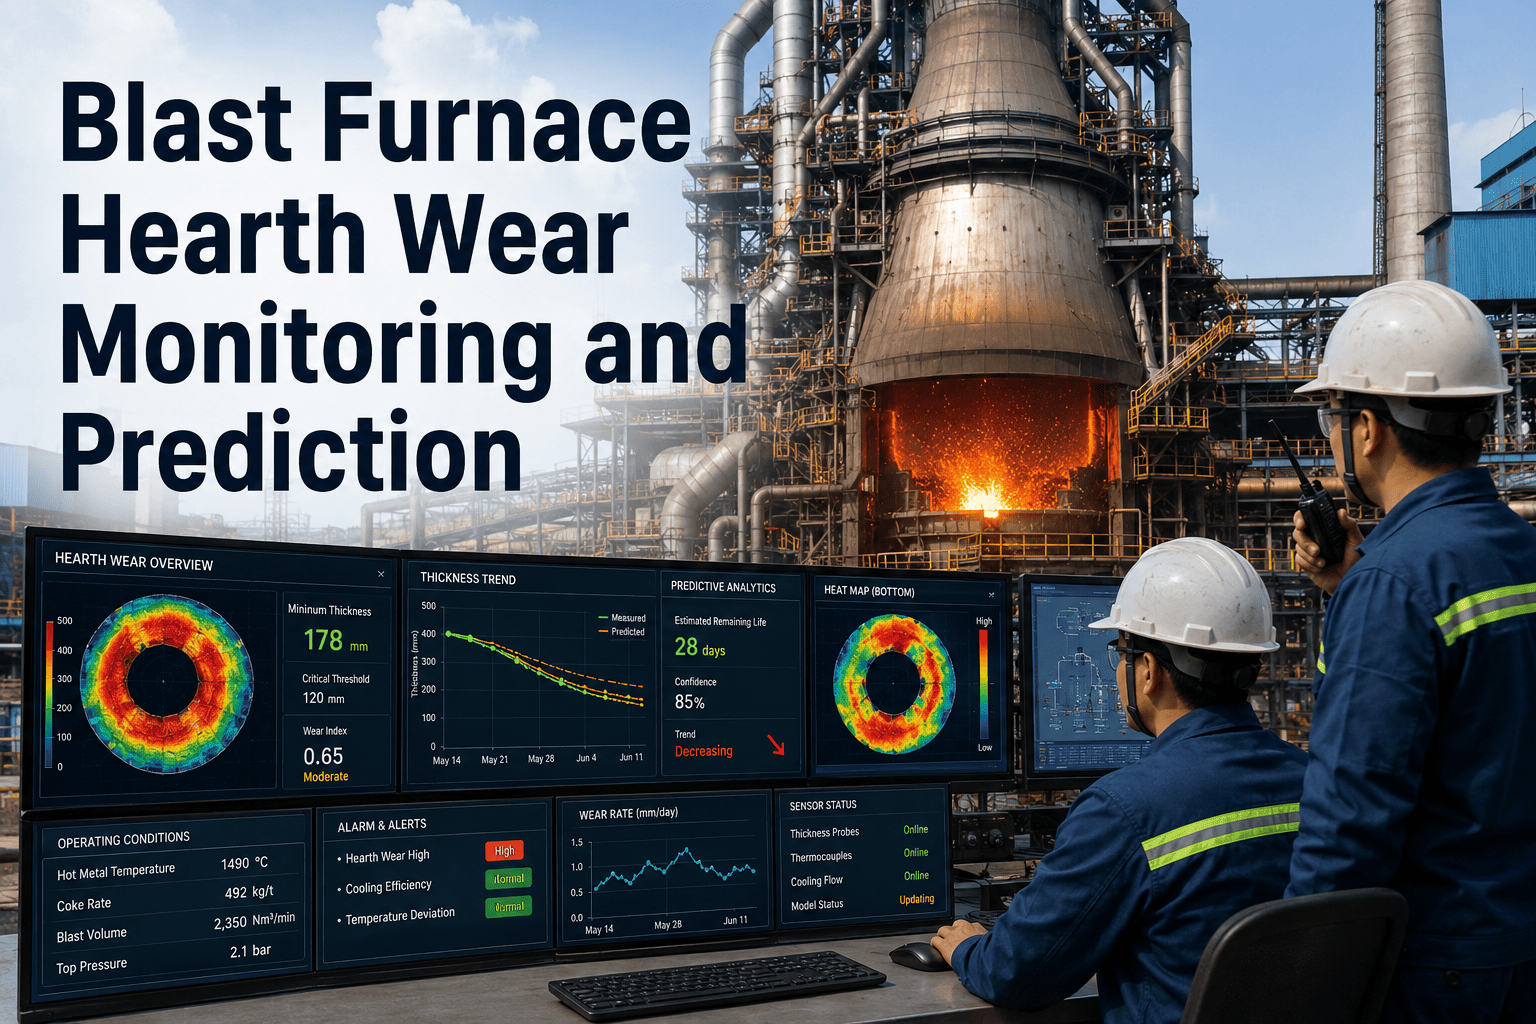
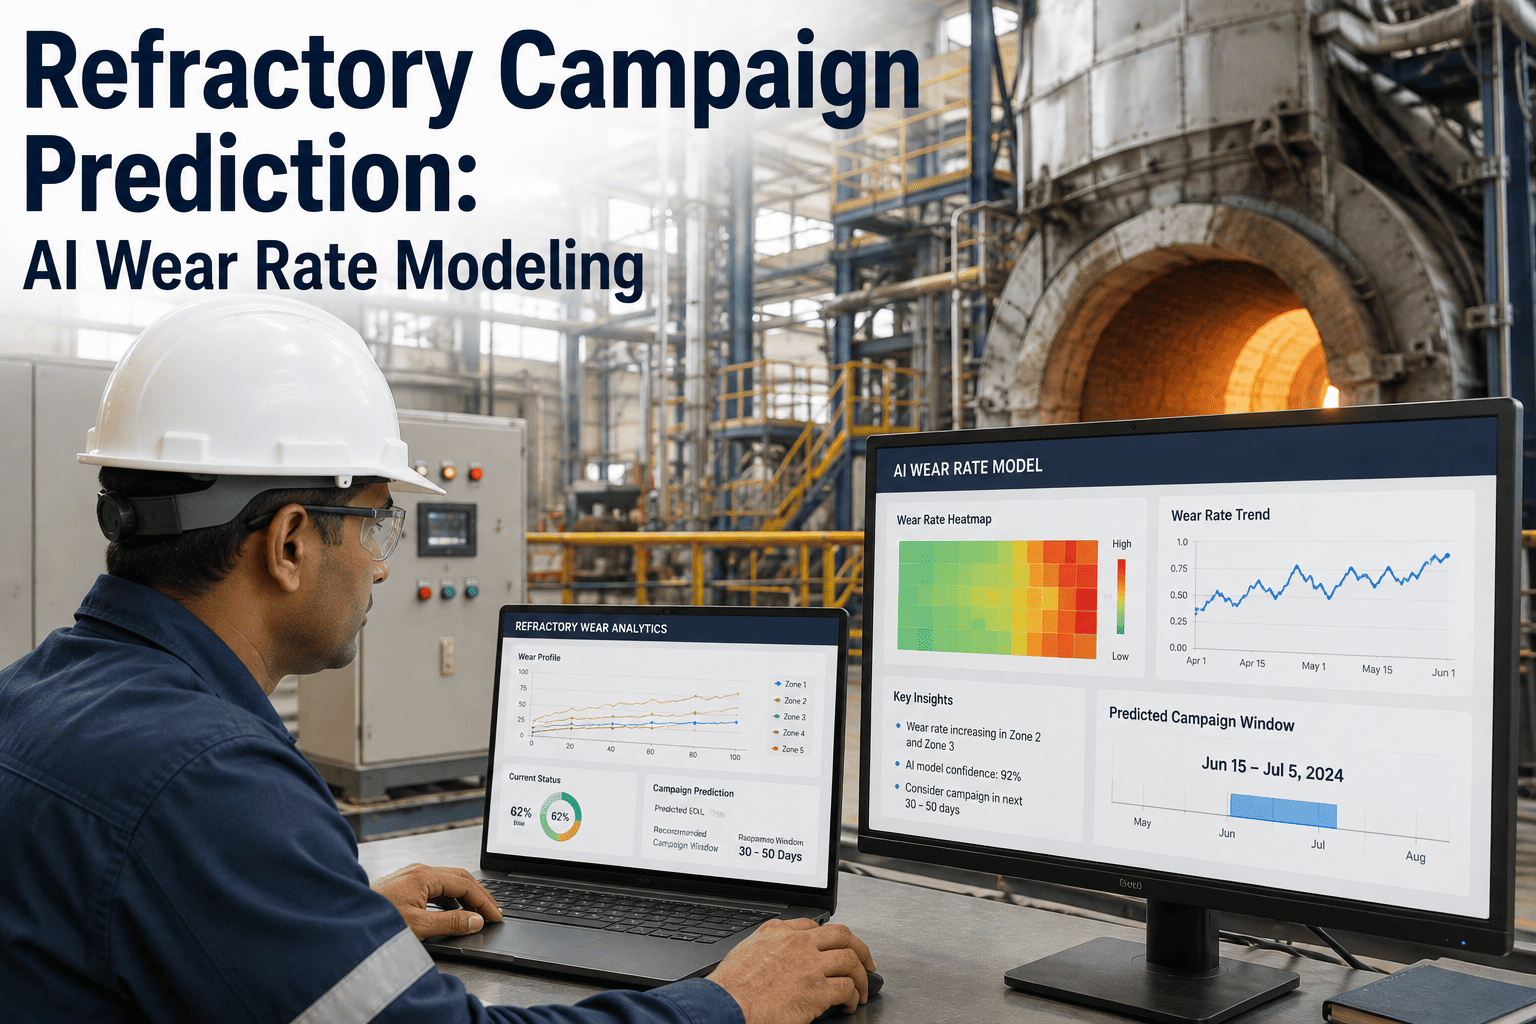
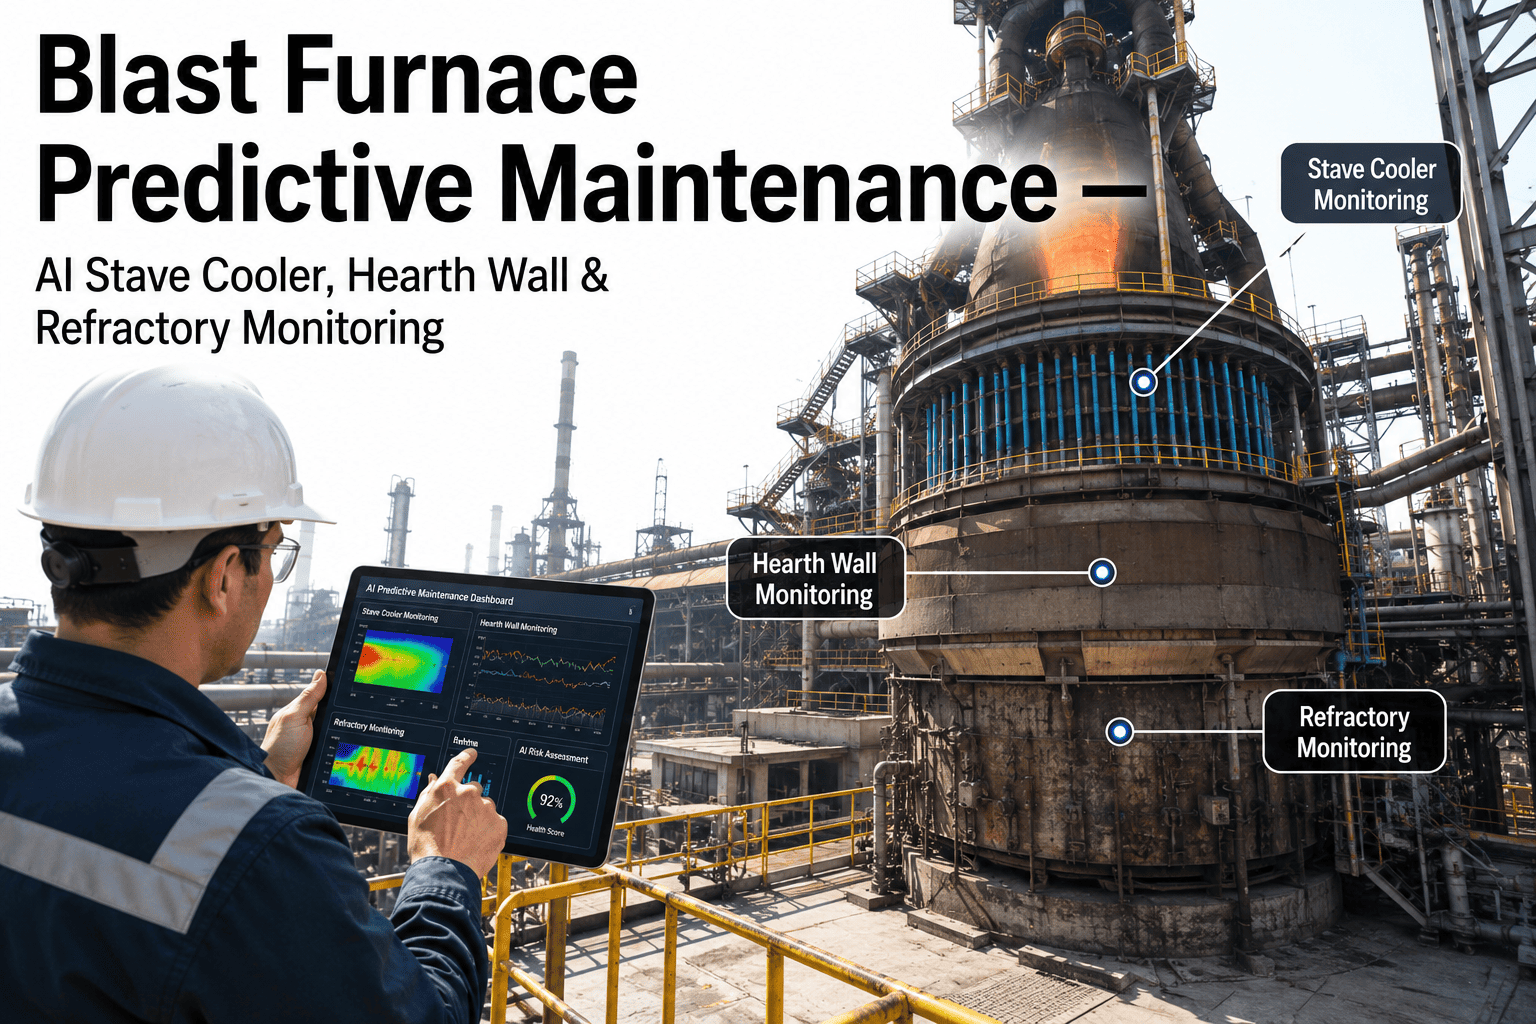
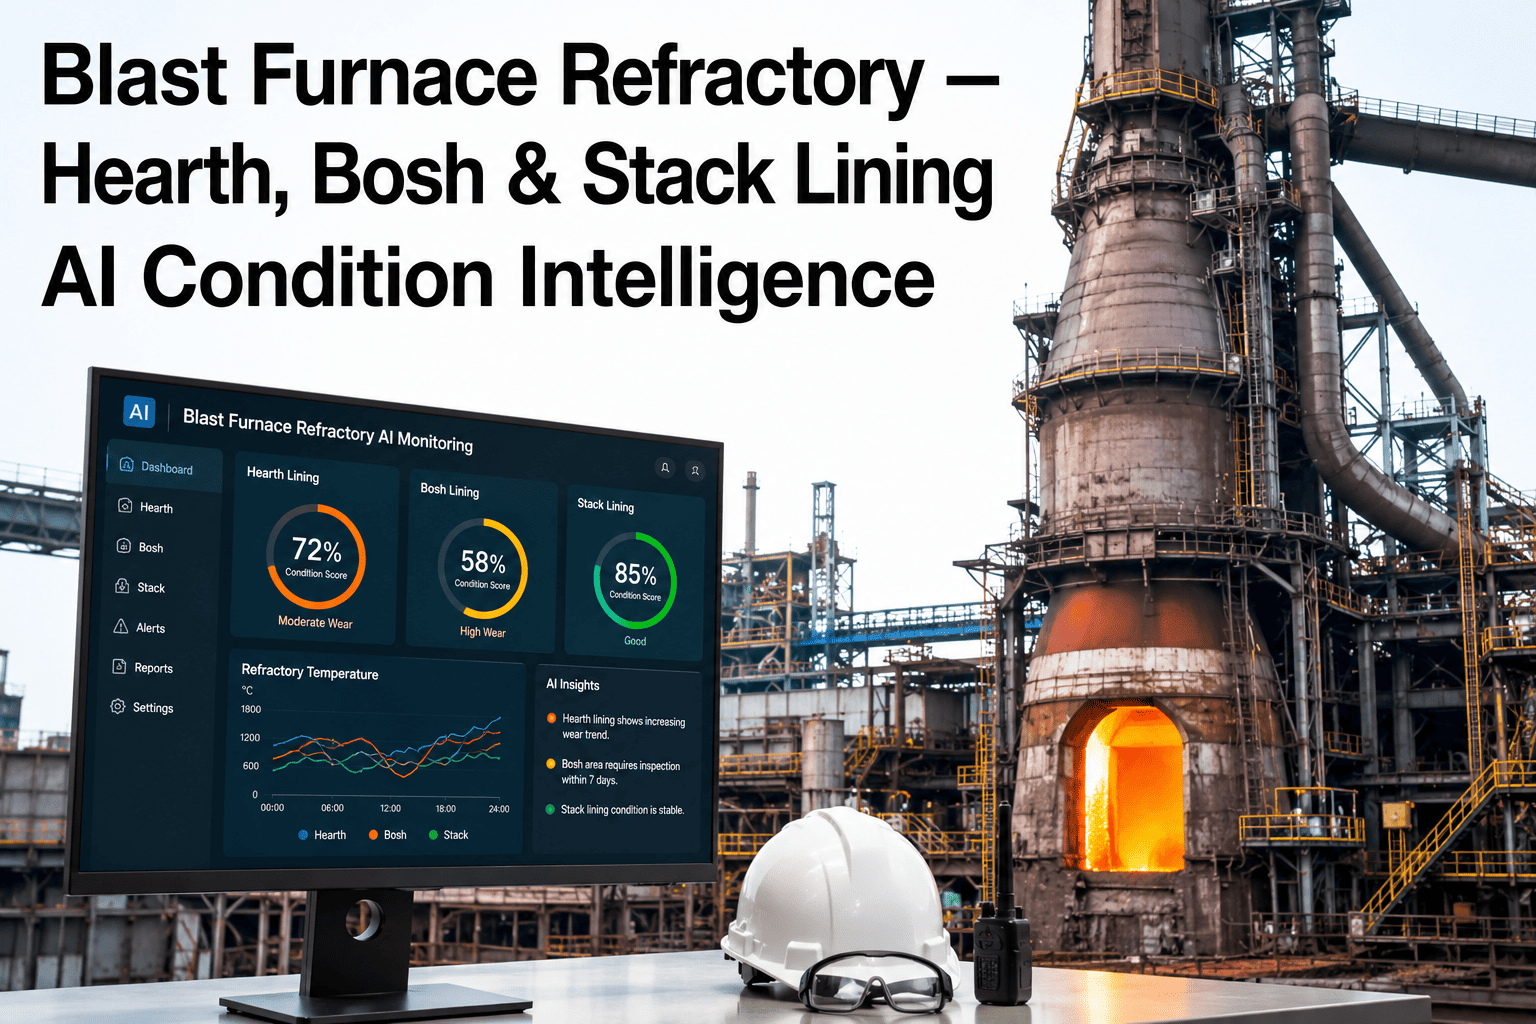
Blast furnace hearth wear is the single most expensive operational risk in ironmaking. A breach or excessive thinning of the refractory lining can force an unscheduled shutdown, costing between $20 million and $50 million in repairs and lost production. Traditional monitoring relies on manual interpretation of stave thermocouple data, which often misses the early signs of accelerated wear. This reactive approach leaves furnace managers with little time to plan interventions, leading to shortened campaign life and increased safety hazards. By applying artificial intelligence to continuously analyze thermocouple patterns, it is now possible to detect wear progression weeks before it becomes critical. This article explores how AI-driven hearth monitoring transforms maintenance strategies, extends campaign life, and reduces unplanned downtime. Discover how your team can move from reactive firefighting to predictive precision by adopting a data-driven approach for your blast furnace hearth. Book a demo to see it in action.
Ironmaking
AI-Powered Hearth Wear Monitoring
Detect wear progression weeks early, extend campaign life, and avoid costly unplanned shutdowns with predictive analytics on stave thermocouple data.
The Cost of Unmonitored Hearth Wear
Hearth refractory degradation is inevitable, but the speed and pattern of wear vary widely based on operating conditions, burden quality, and cooling system performance. Without continuous AI analysis, furnace managers rely on periodic thermal imaging and manual thermocouple readings, which can miss rapid wear events. A single undetected hot spot can escalate into a breakout, requiring a complete hearth rebuild. The financial impact includes not only the direct repair cost but also lost production during the 60-90 day outage. Additionally, safety risks increase as molten iron approaches the shell. Proactive monitoring with AI provides a clear picture of wear progression, enabling informed decisions on burden distribution, cooling adjustments, and campaign scheduling.
$20-50M
Cost per unplanned hearth repair
60-90 Days
Outage duration for rebuild
3-5 Weeks
Early warning from AI models
+2 Years
Potential campaign extension
How AI Analyzes Thermocouple Data
Modern blast furnaces are equipped with hundreds of thermocouples embedded in the stave cooling system and hearth refractory. These sensors generate a continuous stream of temperature readings that reflect the thermal state of the lining. AI models, specifically anomaly detection and time-series forecasting algorithms, are trained to recognize patterns that precede accelerated wear. The system learns the normal thermal profile for each zone and flags deviations that indicate thinning refractory, hot spots, or cooling system failures. By correlating temperature trends with production data, the AI provides a probabilistic wear map that updates in real time.
60% Normal Wear
25% Moderate Wear
15% Critical Wear
Normal wear zones show stable temperatures within expected ranges, indicating healthy refractory.
Moderate wear zones exhibit gradual temperature increases, requiring monitoring and potential cooling adjustments.
Critical wear zones show sharp temperature spikes, demanding immediate intervention to prevent breach.
Key Methods for Wear Prediction
Different AI techniques are applied depending on data availability and furnace characteristics. The most effective approaches combine multiple models for robust predictions.
Anomaly Detection
Identifies outliers in thermocouple readings that deviate from historical baselines, flagging potential hot spots or cooling failures.
Real-Time
Time-Series Forecasting
Uses LSTM networks to predict future temperature trends, providing weeks of lead time before wear reaches critical thresholds.
Predictive
Thermal Modeling
Combines sensor data with finite element analysis to estimate remaining refractory thickness and hot face temperature.
Simulation
Workflow for Implementing AI Monitoring
Deploying an AI-based hearth monitoring system follows a structured process that integrates with existing operations.
1
Data Collection
Gather historical and real-time thermocouple data, along with production parameters like burden composition and casting schedule.
2
Model Training
Train AI models on normal wear patterns and known failure events to recognize early indicators of accelerated wear.
3
Dashboard Integration
Deploy a real-time dashboard showing wear maps, alerts, and trend forecasts for furnace managers and operators.
4
Action Planning
Use AI recommendations to adjust cooling, modify burden, or schedule maintenance before wear becomes critical.
Ready to Extend Your Campaign Life?
Discover how AI-driven hearth monitoring can save millions in unplanned repairs.
Common Mistakes in Hearth Wear Management
Many furnace teams fall into traps that accelerate wear and reduce campaign life. Avoiding these pitfalls is essential for maximizing profitability.
Ignoring Gradual Temperature Drift
Small, consistent temperature increases are often dismissed as noise. AI analysis reveals these drifts as early signs of refractory thinning, allowing proactive cooling adjustments.
Reactive Cooling Adjustments
Waiting for a hot spot alarm before adjusting cooling can lead to thermal shock and further damage. AI predictive models enable gradual, preemptive cooling changes.
Inconsistent Data Logging
Manual data logging often results in gaps and inaccuracies. Automated data collection ensures AI models have clean, continuous inputs for reliable predictions.
Overlooking Cooling System Health
Stave cooling efficiency directly impacts hearth wear. AI monitoring of cooling water flow and temperature helps detect blockages or scaling early.
Frequently Asked Questions
How does AI predict hearth wear from thermocouple data?
AI models analyze historical and real-time temperature readings from hundreds of thermocouples embedded in the hearth refractory and stave cooling system. They detect patterns that precede accelerated wear, such as gradual temperature increases, rapid fluctuations, or deviations from normal thermal profiles. By training on past wear events and normal operations, the AI learns to distinguish between benign temperature changes and those indicating refractory thinning. The model then provides a probabilistic wear map and forecasts future temperatures, giving furnace managers weeks of warning before critical thresholds are reached. This allows for informed decisions on cooling adjustments, burden changes, or scheduled maintenance.
Contact support for technical details on model architecture.
What are the key benefits of AI-driven hearth monitoring over traditional methods?
Traditional monitoring relies on manual thermocouple readings and periodic thermal imaging, which provide only snapshots of hearth condition. AI monitoring offers continuous, real-time analysis that detects wear progression weeks earlier. This early warning enables proactive interventions, such as adjusting cooling water flow or modifying burden distribution, to slow wear and extend campaign life. The financial benefits are substantial: avoiding an unplanned hearth rebuild saves $20-50 million and prevents 60-90 days of lost production. Additionally, AI reduces reliance on expert judgment, making consistent, data-driven decisions available to all shifts. The system also improves safety by alerting operators to potential hot spots before they become hazardous.
Book a demo to see a live comparison.
How long does it take to deploy an AI hearth monitoring system?
Deployment typically takes 4-8 weeks, depending on data availability and furnace complexity. The process begins with data collection from existing thermocouples and plant historians, followed by model training and validation against historical wear events. Integration with the furnace control system is done via secure APIs, and a custom dashboard is configured for the operations team. Most of the time is spent on data cleaning and model calibration to ensure accurate predictions. After deployment, the system requires minimal maintenance, with periodic model retraining as new data accumulates. The quick setup means furnace managers can start seeing actionable insights within the first month.
Talk to support for a detailed implementation timeline.
Can AI monitoring replace traditional hearth inspection methods?
AI monitoring complements but does not fully replace traditional inspection methods. While AI provides continuous, real-time wear estimates and early warnings, physical inspections such as thermal imaging, borescope inspections, and shell thickness measurements remain valuable for validation and detailed assessment. The AI model can prioritize which zones require physical inspection, making the process more efficient. For example, if the AI flags a potential hot spot in a specific area, inspectors can focus their efforts there rather than scanning the entire hearth. This combination of AI-driven alerts and targeted physical checks creates a comprehensive monitoring strategy that maximizes both safety and operational efficiency.
Book a demo to learn about integration with existing workflows.
What data is required to start using AI for hearth wear prediction?
The primary data source is stave thermocouple readings, ideally with at least 6 months of historical data to capture seasonal and operational variations. Additional data that improves prediction accuracy includes cooling water flow rates and temperatures, burden composition and distribution, casting schedules and tap hole information, and blast parameters such as hot blast temperature and pressure. The AI model can work with incomplete data, but accuracy improves with more comprehensive inputs. Data can be pulled from existing plant historians or PLCs via standard protocols like OPC-UA or Modbus. No additional sensors are required, though adding thermocouples in critical zones can enhance coverage.
Contact support for a data readiness assessment.
Take Control of Your Hearth Health
Start predicting wear weeks in advance and avoid costly shutdowns.