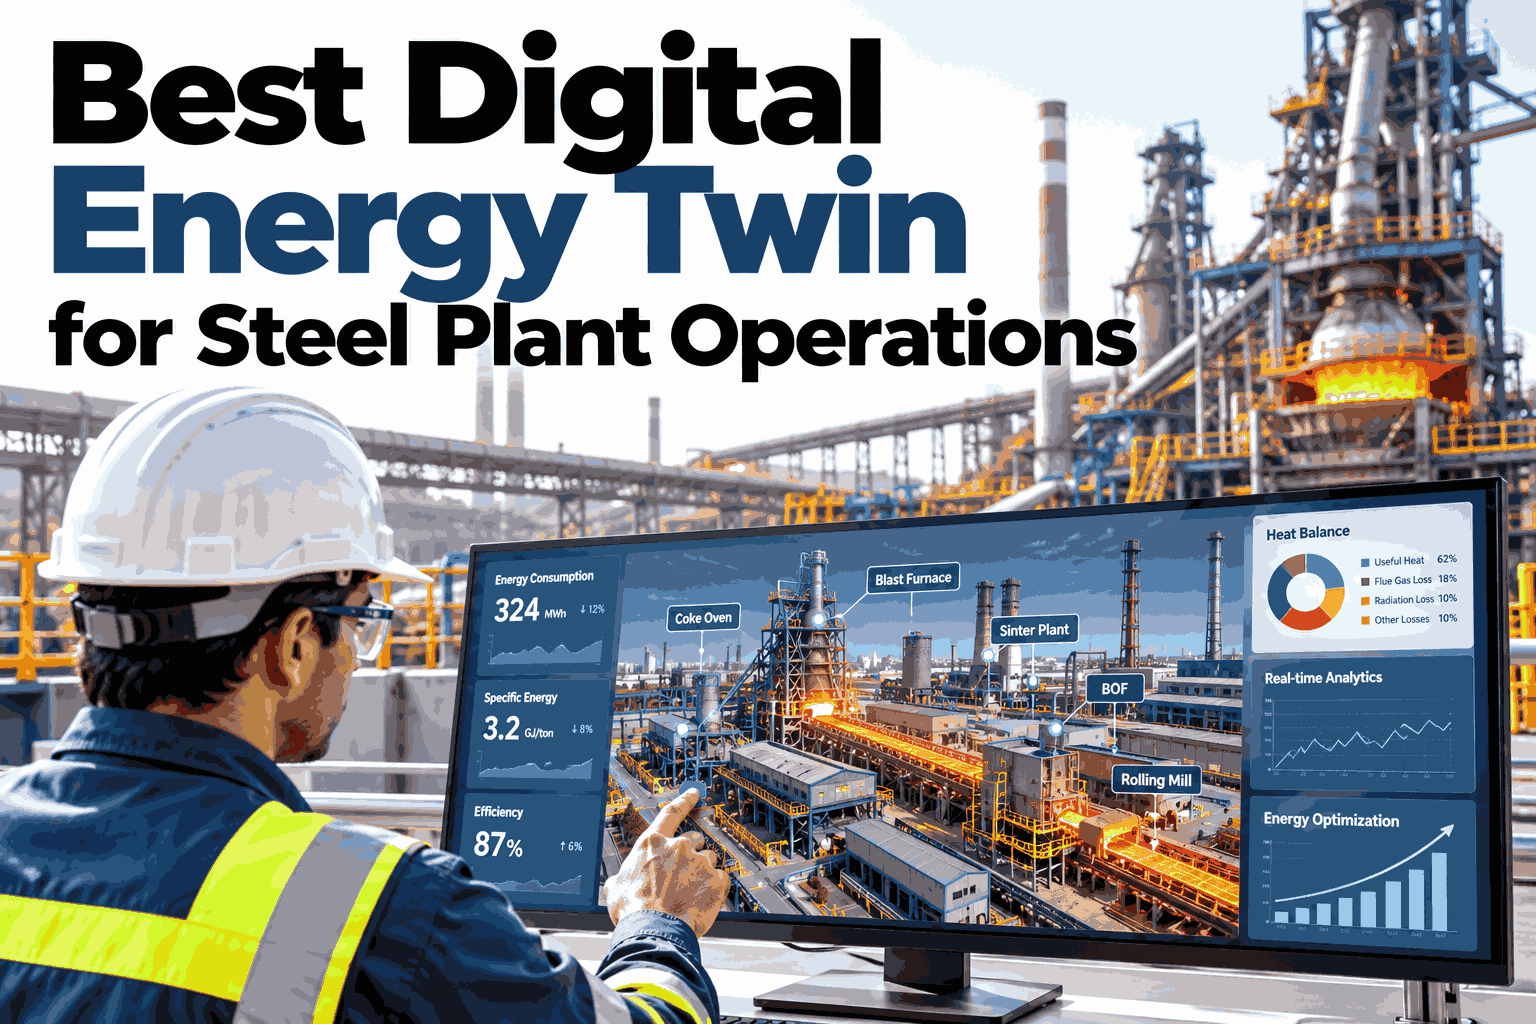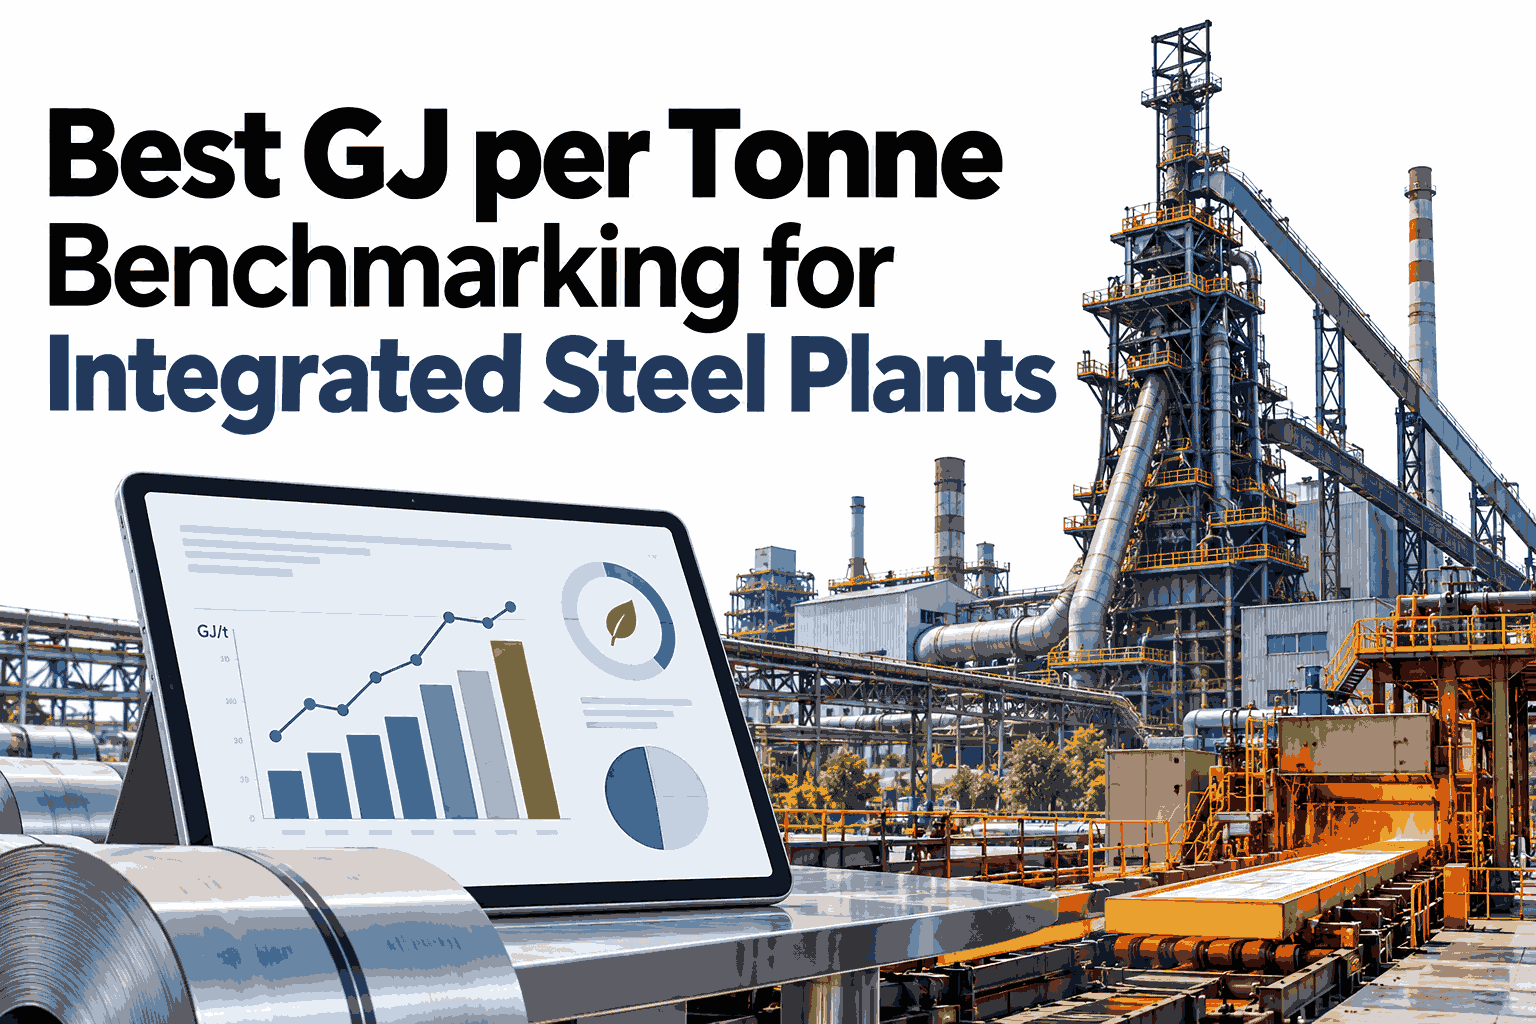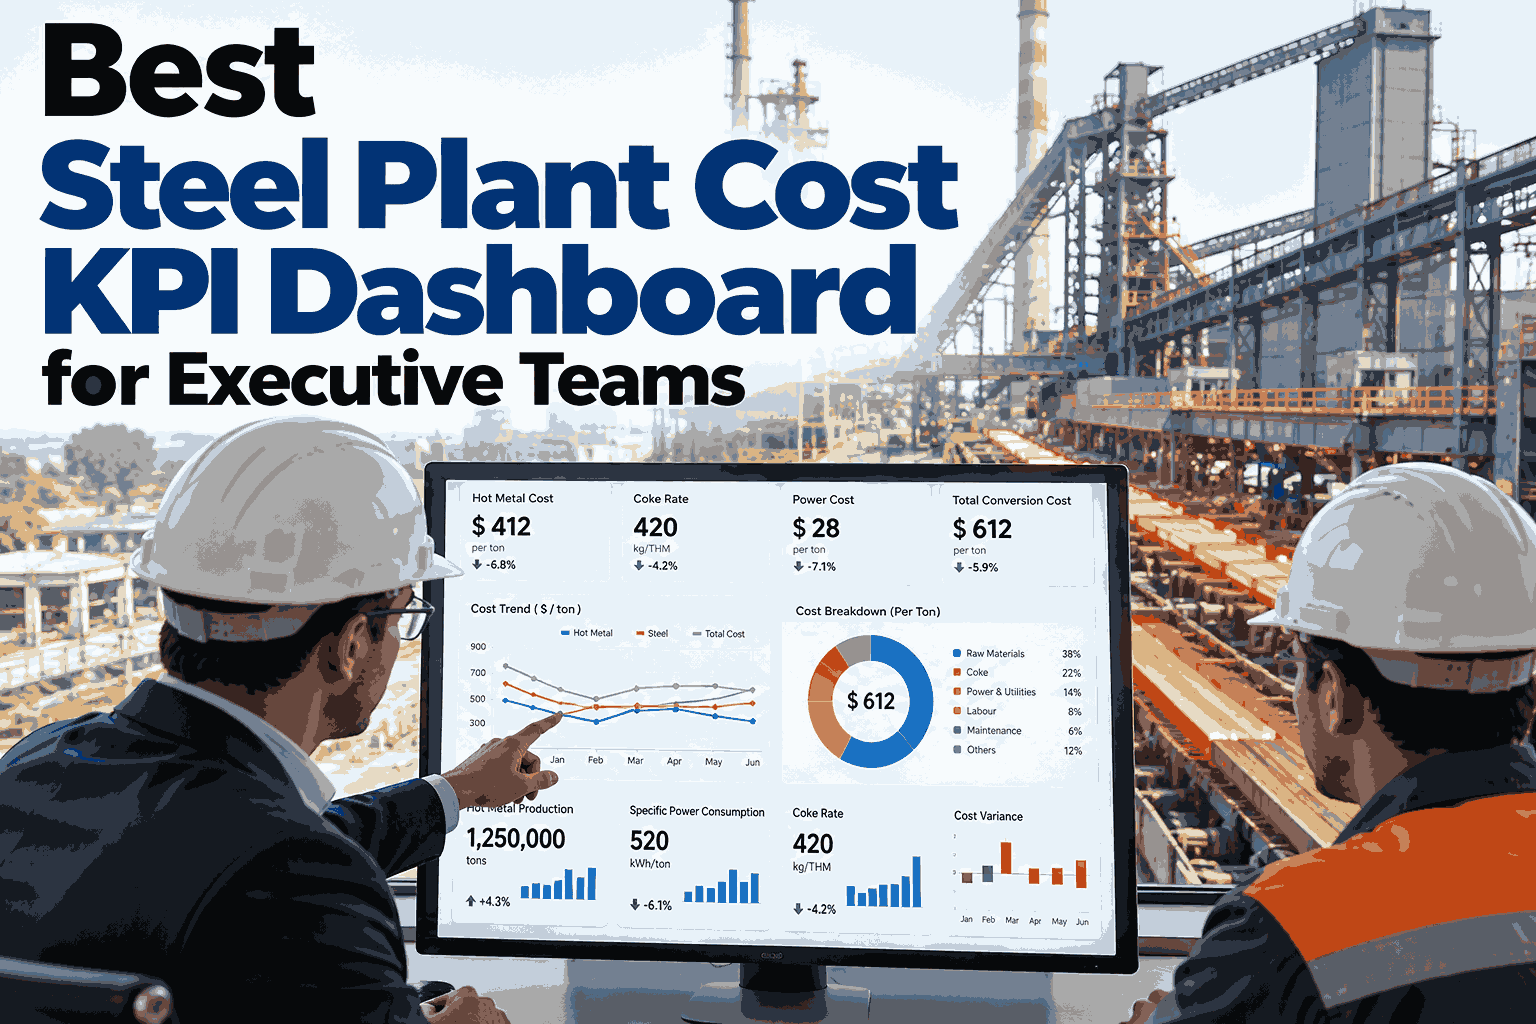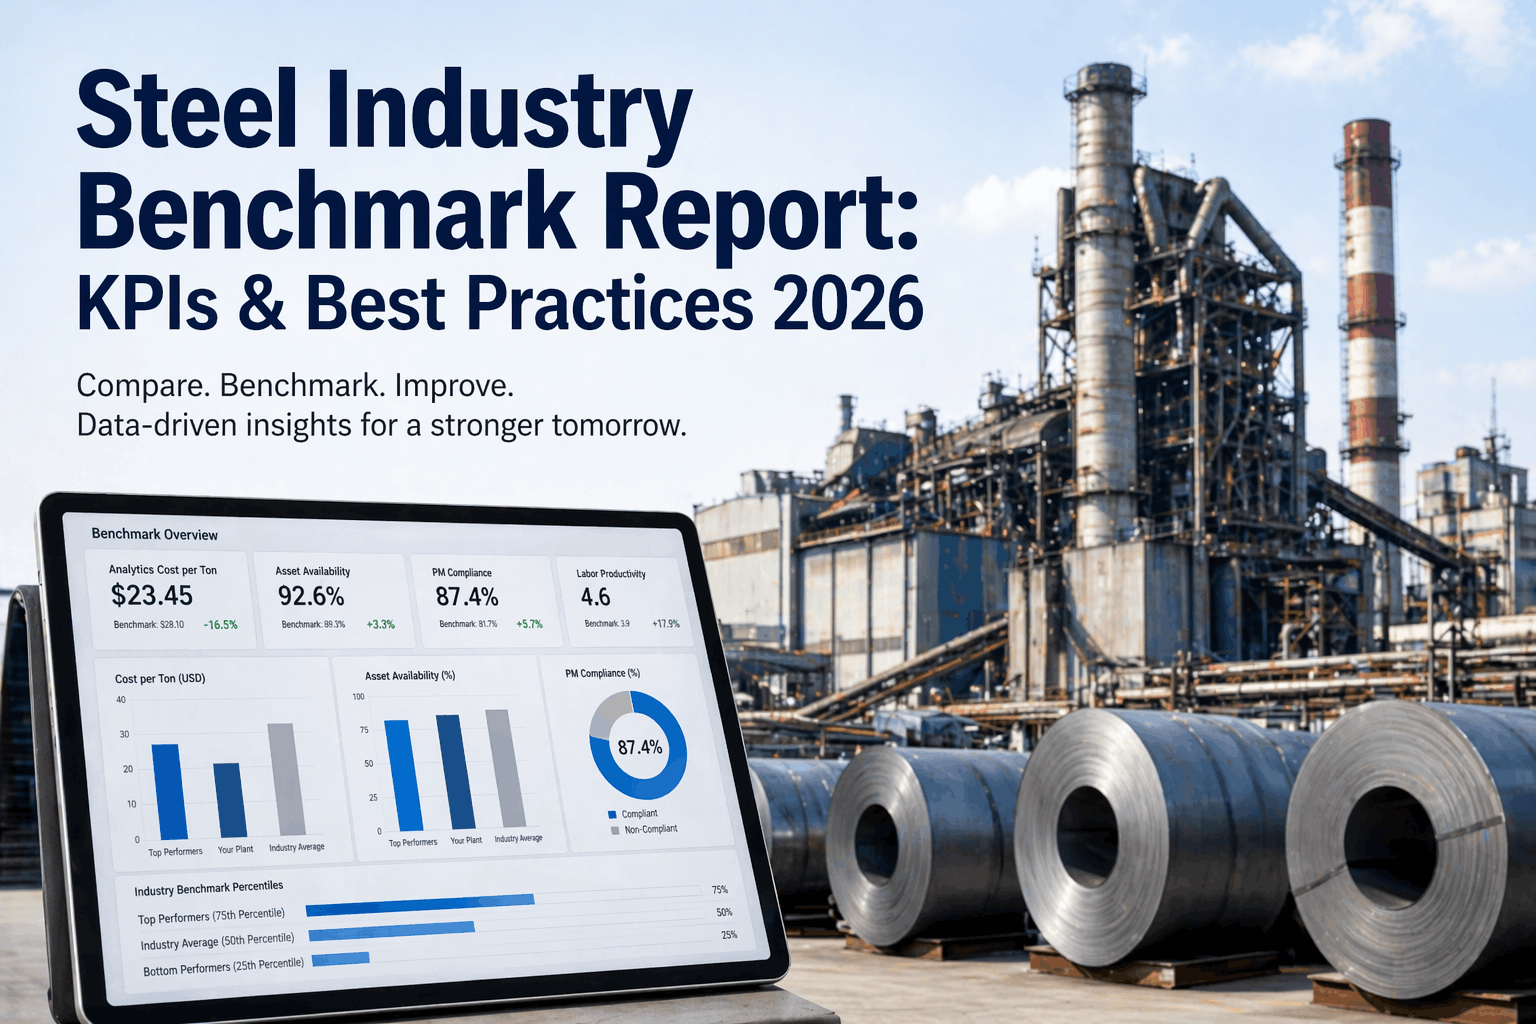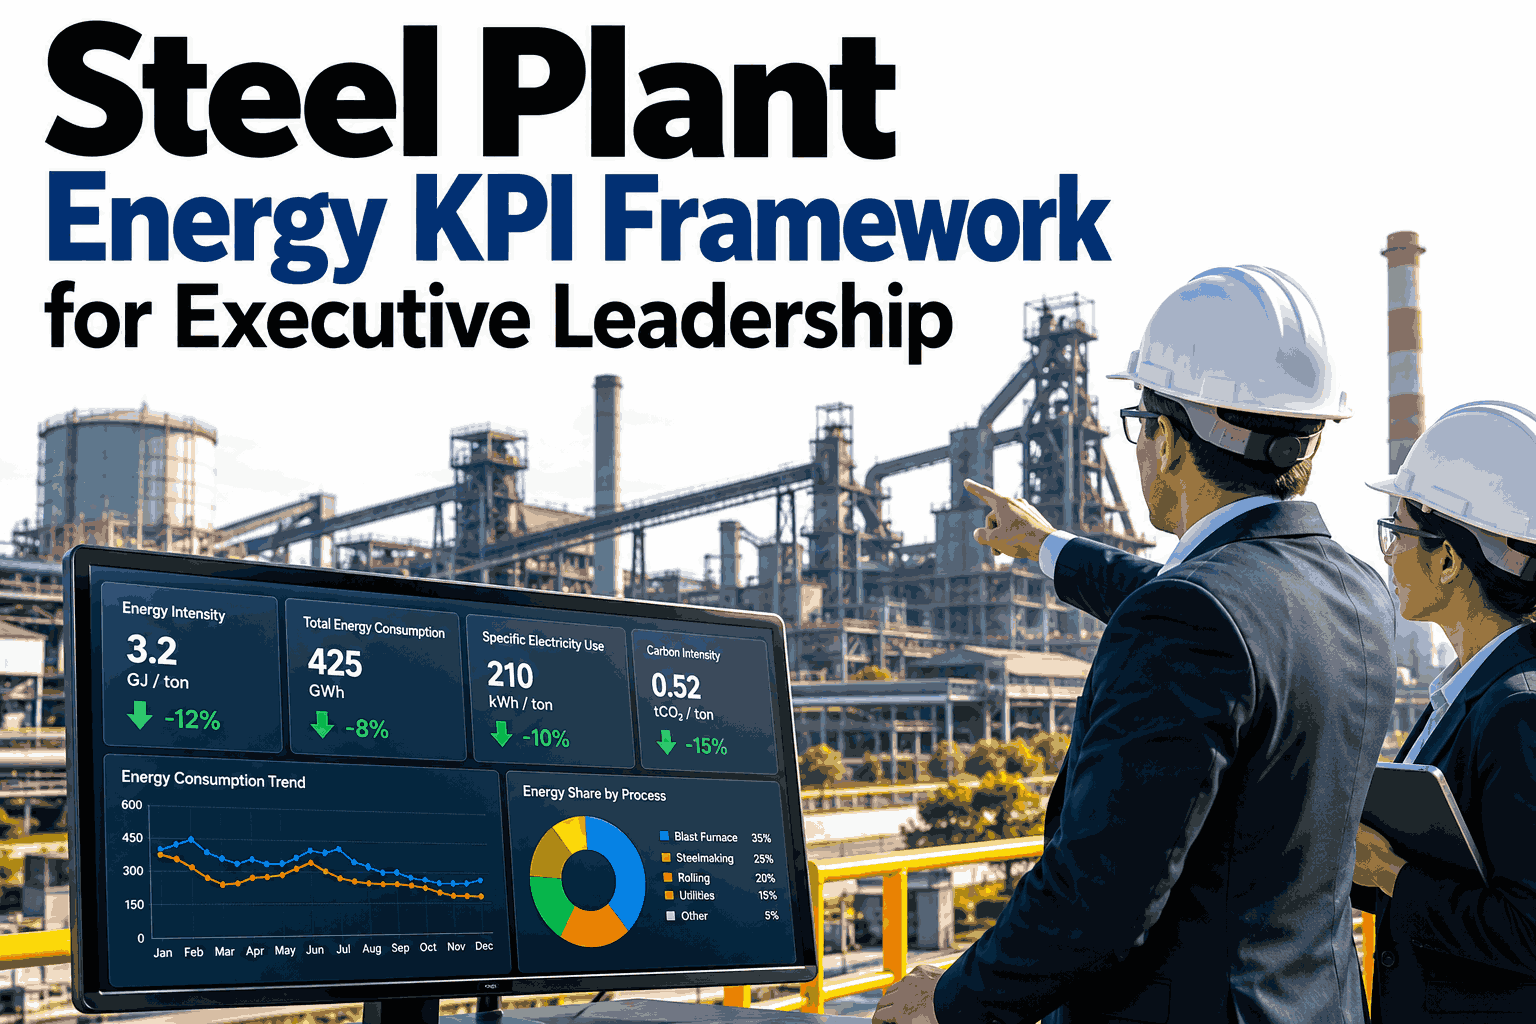
Executives are handed dozens of energy figures and still cannot answer three simple questions: are we using less energy per tonne, is it costing us less, and are our emissions moving the right way? A useful KPI framework answers those in one view, with each number defined the same way every month and tied to someone who can act on it. It also separates the few measures leadership should watch from the many that plant teams need. Leaders designing that view can see how iFactory AI assembles an energy scorecard on live plant data before the next board pack is drawn up.
Steel Plant Energy KPI Framework for Executive Leadership
Four KPI families on one page, each with a clear definition, an owner and a status leaders can read in seconds.
Why Most Energy KPI Sets Fail
Long lists feel thorough but rarely change decisions. Three failures show up again and again.
Twenty measures compete for attention, so none of them gets acted on.
A number that belongs to everyone belongs to no one when it drifts.
Boundary or tonne definitions change quietly, so trends cannot be trusted.
A good executive set is short, stable and owned. Everything else stays at plant and unit level, where it can be acted on.
The Four KPI Families
Together these cover consumption, cost, emissions and performance against benchmark. Each needs a written definition before it goes on the scorecard.
See All Four KPI Families on One Scorecard
Book a 30-minute session and iFactory AI will show how energy intensity, cost, carbon and unit benchmarks are defined, owned and tracked in one executive view.
How KPIs Cascade From Board to Unit
The same energy number should be visible at three levels, each with the detail that level needs to act.
A Sample Scorecard Reading
This illustrative table shows how status and owner appear together, so a leader knows who to ask and why.
| KPI | Owner | Status | Driver behind the status |
|---|---|---|---|
| Energy intensity | Plant head | On target | Stable fuel rate and steady utilisation |
| Energy cost per tonne | CFO | Watch | Fuel price rise, usage flat |
| Carbon intensity | Sustainability head | On target | Higher gas recovery cut purchased fuel |
| Rolling mill consumption | Unit head | Act | Long hold times after stoppages |
Pair Leading With Lagging Measures
Lagging KPIs report what happened. Leading KPIs warn early enough to change the result. A short design session on your own KPI set helps balance the two.
A Review Rhythm That Sticks
KPIs only work when reviews are regular and short. Four meetings cover the ground.
Unit heads check rates and alerts, and fix drift on the shift.
Plant team reviews drivers, actions and owners.
Executives review the scorecard, status and cost impact.
Definitions, boundaries and targets are reset for the new budget.
Where iFactory AI Fits
iFactory AI builds the scorecard from live meters, production and cost data, so every KPI is calculated the same way each time.
One definition per KPI
Boundary, tonne and unit definitions are stored with each KPI, so trends stay comparable.
Drill-down to the cause
Any headline status can be opened to show the process step, unit and driver behind it.
Cost and carbon together
Energy quantities feed both cost per tonne and carbon intensity from the same data.
Ask in plain language
Leaders can ask why a KPI turned amber and receive the ranked drivers.
iFactory AI arrives pre-configured on an NVIDIA server that ships racked and ready with software pre-loaded. Scope covers cabling, network, ERP and MES integration, team training and 24x7 remote monitoring.
Frequently Asked Questions
Which energy KPIs should executives track?
Keep the set short: energy intensity, energy cost per tonne, carbon intensity and performance against benchmark by unit. Each answers a different question, and together they show consumption, cost, emissions and efficiency. You can watch a scorecard built on sample plant data in a live session.
How do we keep KPI definitions consistent?
Write each definition down, covering boundary, energy carriers, tonne basis and calculation, then apply it in software instead of spreadsheets. Change it only at a planned review, and note the change. To agree yours, request a KPI definition session with the iFactory AI team, or ask support for the definition template.
How is carbon intensity calculated from energy data?
Energy use by carrier is multiplied by the emission factor for that carrier, then divided by tonnes. The reporting scope and factors must be stated, since they change the result. Using the same energy data for cost and carbon keeps the two consistent. A short product tour of the carbon view shows how it is built.
How many KPIs is too many for leadership?
Most executive views work best with four to six headline measures. More than that dilutes attention, and detail belongs at plant and unit level where teams can act on it. Drill-down keeps the depth available without crowding the top page. See how headline and detail views connect in a guided walkthrough.
How do we set fair targets for each KPI?
Start from a normalised baseline, then compare with best demonstrated rates by unit and adjust for mix and utilisation. State price and emission factor assumptions beside cost and carbon targets. That keeps reviews about performance, not about changing conditions. Schedule a walkthrough of target setting to see how baselines are built.
Give Leadership One Energy Scorecard
iFactory AI defines, calculates and tracks energy, cost and carbon KPIs from live plant data. Book a walkthrough to see the scorecard built around your own plant.