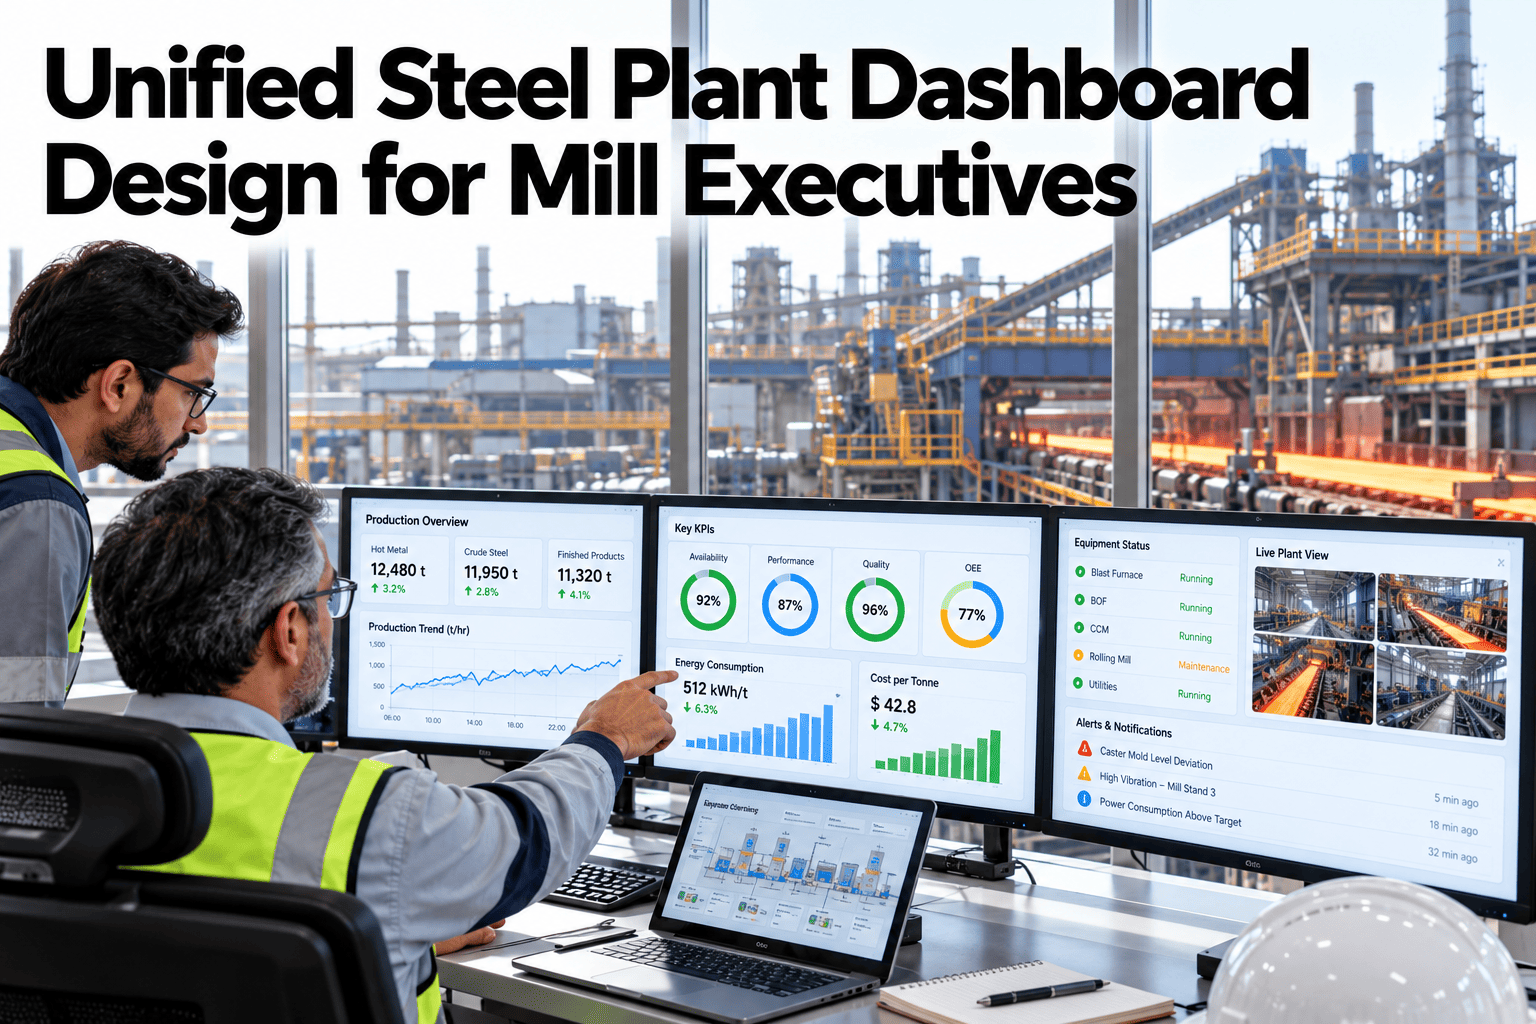
Most executive dashboards in a steel plant are monitoring instruments dressed up as decision instruments: they show whether a number is up or down, but they do not tell an executive which of thirty metrics is actually the one worth a decision this week. A north-star, guardrail, and diagnostic KPI split fixes that by giving each metric a defined job, so an executive glancing at the dashboard knows immediately whether they are looking at the goal, a constraint that must not be violated, or a detail worth investigating only if something else looks wrong. See an executive KPI framework built around your own plant's metrics.
Turn the Dashboard Into a Decision Instrument
iFactory AI structures executive KPIs into north-star, guardrail, and diagnostic tiers, so every metric has a clear job and every glance tells a leader what to do next.
A Flat List of Metrics Is Not a Framework
Most executive dashboards present every metric at the same visual weight, which means a core strategic goal sits next to a minor diagnostic detail with no signal about which one deserves attention, and an executive scanning the screen has to supply that prioritization themselves, every time, from memory rather than from the dashboard's own design.
North-Star KPI
The single metric the plant is ultimately trying to move, tied directly to strategy.
Guardrail KPIs
Constraints that must not be violated while pursuing the north-star goal.
Diagnostic KPIs
Supporting detail, useful for investigation once something else looks off.
Build Your Own KPI Tier Structure
Book a 30-minute session and structure your own plant's metrics into a north-star, guardrail, and diagnostic framework.
How Each Tier Behaves on the Dashboard
Each tier is shown differently, so an executive's eye goes to the right level of detail without having to think about it.
| Tier | Dashboard Treatment | Example for a Steel Plant |
|---|---|---|
| North-star | Prominent, always visible, trended over time | Carbon intensity per tonne of steel produced |
| Guardrail | Visible with a clear pass or breach indicator | Safety incident rate, energy cost ceiling |
| Diagnostic | Available on drill-down, not shown by default | Individual furnace energy draw, yield by shift |
Building the Framework
The framework is built around what the plant's leadership actually needs to decide, not an inherited list of available metrics.
Rolling Out the Framework
iFactory AI restructures your existing dashboard data into the three-tier framework without requiring a new data collection process.
Expert Review
The framework's real value shows up not in the dashboard layout but in the leadership meeting it enables, since a room that has already agreed on one north-star metric spends far less time debating which number matters and far more time actually deciding what to do about it.
Frequently Asked Questions
Can we have more than one north-star metric?
The framework works best with a single north-star metric to keep focus clear, though some plants use one north-star per major initiative if strategy genuinely has multiple distinct goals. Support can help think through your specific structure.
How many guardrail metrics is too many?
Guardrails work best kept to a small, memorable set, typically under ten, since the purpose is a quick pass-or-breach check rather than a comprehensive constraint list.
Can diagnostic metrics still be tracked over time?
Yes, diagnostic metrics remain fully tracked and available on drill-down, they are simply not surfaced by default on the main executive view. See the drill-down structure on a call.
Does the north-star metric ever change?
Yes, as strategy evolves the north-star can be redefined, though it is meant to be stable enough to guide decisions over a meaningful period rather than shifting every quarter.
Does this replace our existing executive dashboard?
It restructures your existing dashboard data around the three tiers rather than replacing the underlying systems, so current data sources remain in place. Ask support how restructuring works with your setup.
Give Every Metric a Job
iFactory AI structures your executive dashboard into north-star, guardrail, and diagnostic tiers. Book a demo to build your own framework.