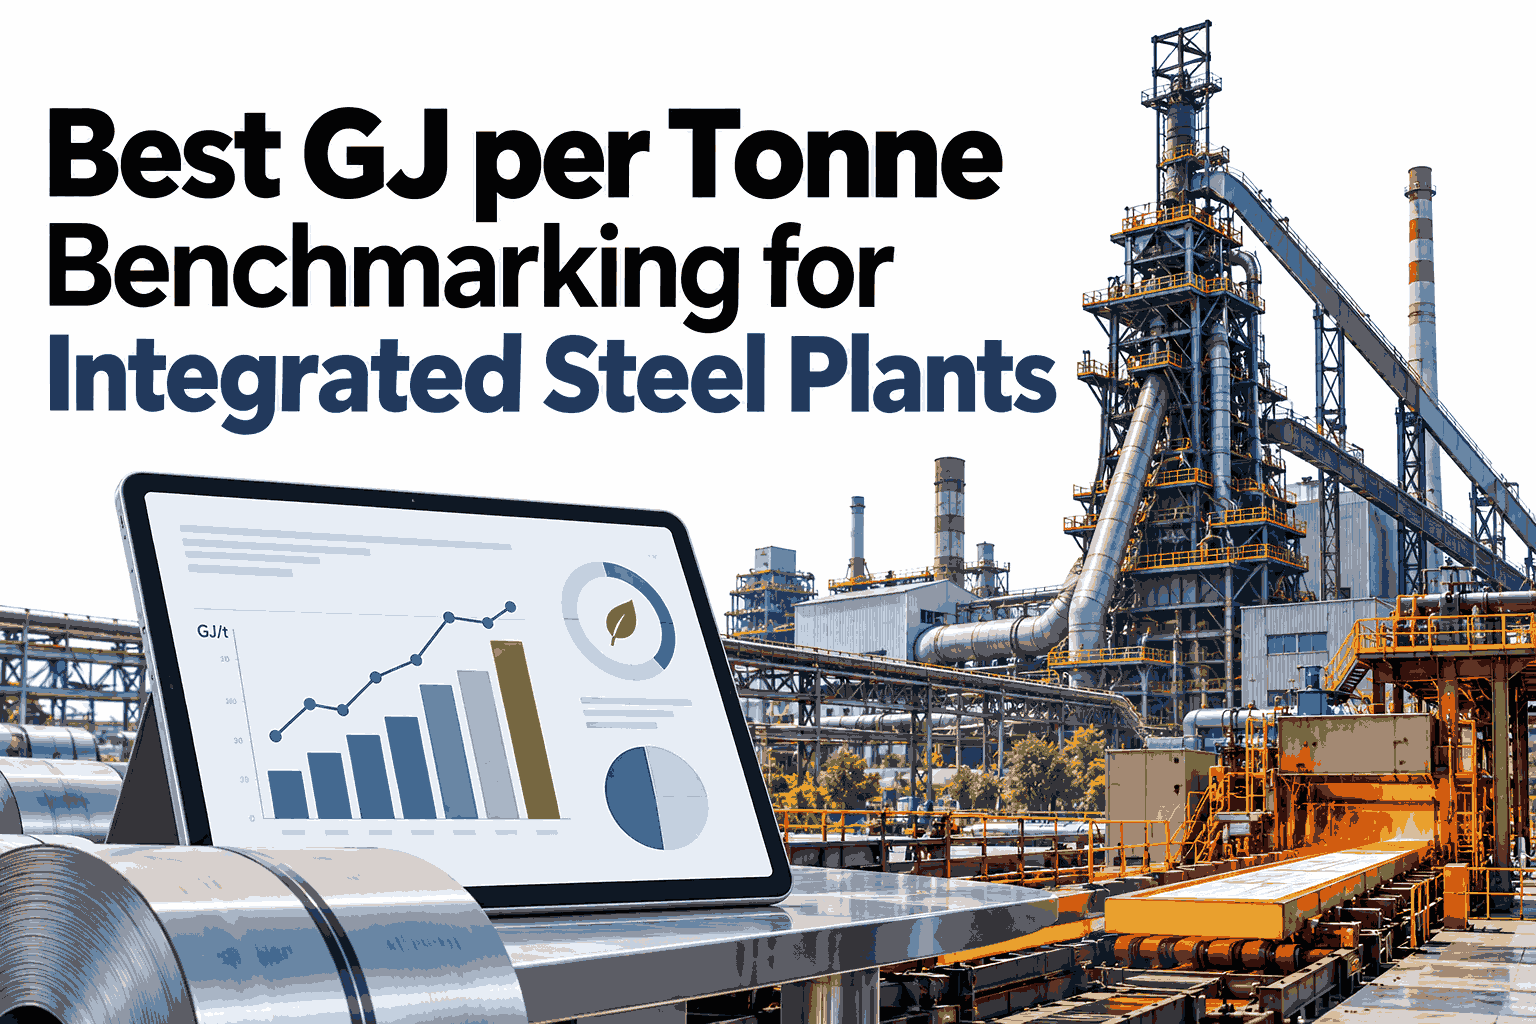
The global average steel industry CO2 intensity is 1.92 tonnes of CO2 per tonne of crude steel, and energy intensity is 20.95 GJ per tonne, based on 2024 worldsteel data (worldsteel Sustainability Indicators, 2026) — but a blast furnace plant compared directly against that blended global figure will look worse than it actually performs relative to its real peer group. iFactory, an on-premise AI platform with energy and carbon dashboard capability built in, blends route-adjusted external benchmarks with internal targets on the same shift-level view. Steel plant teams who want this benchmarking applied to their own route and process can discuss their plant data and use case with our team.
Benchmark KPIs · Steel Energy & Carbon Dashboards, 2026
A Blended Global Average Can Make an Efficient Plant Look Mediocre
iFactory AI blends worldsteel's route-specific benchmarks with your own internal targets, so shift teams see performance against a realistic, route-matched reference.
Global Average
1.92 t CO2/t · 20.95 GJ/t
BF-BOF Route
2.34 t CO2/t · 23.88 GJ/t
Why route matters more than the global number
A BF-BOF Plant Will Never Match an EAF Plant's Intensity
Production route is the single biggest driver of a steel plant's energy and carbon intensity, independent of how well-run the plant is — a blast furnace-basic oxygen furnace route inherently runs higher than an electric arc furnace route using scrap, regardless of operational excellence. Comparing a BF-BOF plant against the blended global average, which includes both routes, systematically understates how well that plant is actually performing within its own route.
What worldsteel data actually provides
Three Numbers Worth Knowing From the Latest Report
1.92 t CO2/t
Global average CO2 emissions intensity per tonne of crude steel, 2024 (worldsteel, 2026).
20.95 GJ/t
Global average energy intensity per tonne of crude steel, 2024 (worldsteel, 2026).
2.34 t CO2/t
BF-BOF route-specific average, meaningfully higher than the blended global figure (worldsteel, 2026).
Blending external and internal references
Why a Dashboard Needs Both Numbers Side by Side
| Reference | What it tells a shift team |
|---|
| Route-adjusted external benchmark | How this plant compares against credible industry peers in the same route |
| Internal target | Whether this specific shift is on track against the plant's own improvement plan |
| Both together | Context for whether a gap to target is a plant-specific issue or a route-wide limitation |
See Your Plant's Route-Adjusted Benchmark Position
Share your production route and recent energy and emissions data, and iFactory AI will show how your plant compares against the correct route-level benchmark.
Keeping benchmarks current
Industry Data Updates Annually — Your Dashboard Should Too
Worldsteel benchmark datasets are typically refreshed on an annual cycle, which means a benchmark comparison built once and left static will quietly drift out of date as the industry average moves. Refreshing the benchmark reference alongside each annual update keeps a plant's comparison honest rather than measuring against a stale industry baseline.
Building the benchmark view
Four Steps to a Route-Adjusted Benchmark Dashboard
1
Confirm the plant's route
Identify whether the plant runs BF-BOF, EAF, or a specific hybrid configuration.
2
Pull the matching route benchmark
Use the route-specific figure, not the blended global average, as the external reference.
3
Set the internal target alongside it
Display the plant's own improvement target on the same view as the external benchmark.
4
Refresh on the industry's update cycle
Update the external reference whenever worldsteel publishes new data.
Expert review
What a Sustainability Director Checks First
Benchmark KPIs earn trust when they're matched to the plant's actual production route, not borrowed from whichever industry figure is easiest to find.
Verdict
Strong when the dashboard clearly labels which route the external benchmark reflects, avoiding an apples-to-oranges comparison.
Watch for
A benchmark figure left unrefreshed for multiple years while the underlying industry data has already moved on.
Do next
Confirm your current dashboard's benchmark reference is actually matched to your plant's specific production route.
Frequently asked questions
What Steel Plants Ask About Benchmark KPIs
What's the current global average CO2 and energy intensity for steel production?
Why shouldn't we just use the global average as our benchmark?
Production route is the single biggest driver of intensity — a BF-BOF plant will always run higher than an EAF plant regardless of efficiency, so comparing against a blended global average that mixes both routes misrepresents a plant's actual relative performance.
Ask support about your route-specific benchmark.
How often is worldsteel benchmark data updated?
Industry benchmark datasets are typically updated annually, and a dashboard's benchmark reference should refresh alongside that update to stay current.
Discuss keeping your benchmark current.
Should shift teams see the external benchmark or just the internal target?
Both together give the most useful context — the internal target tells a shift whether it's on track against the plant's own plan, while the external benchmark shows whether that plan itself is ambitious relative to route peers.
Ask support about displaying both on your dashboard.
Can this benchmark comparison support a board-level capital planning discussion?
Yes — a route-adjusted gap analysis, broken down into its energy, scrap ratio, and fuel components, gives capital planning conversations a concrete, defensible starting point rather than a vague improvement target.
Talk through a board-ready benchmark view.
Compare against the right peer group
Blend Route-Adjusted Benchmarks With Your Internal Targets
Book a session with iFactory AI to see your plant's real benchmark position against the correct route-level reference.