Your hot strip mill is running at 64% OEE. Is that competitive — or are you losing millions in hidden capacity? In steel manufacturing, where a single hour of blast furnace downtime can cost $50,000+, the answer depends entirely on which process area you measure, how your peers perform, and whether your losses hide in availability, performance, or quality. The top-quartile steel plants operate above 80% OEE. The industry median sits at 68%. That gap represents recoverable throughput worth seven figures annually. This guide breaks down OEE benchmarks for every major steel process — from melt shop to finishing line — so you can set targets that actually make sense for your operation. If your plant still tracks OEE in spreadsheets, you are already behind. iFactory gives you real-time OEE by line, shift, and product — book a 30-minute assessment to see exactly where your hidden capacity lives.
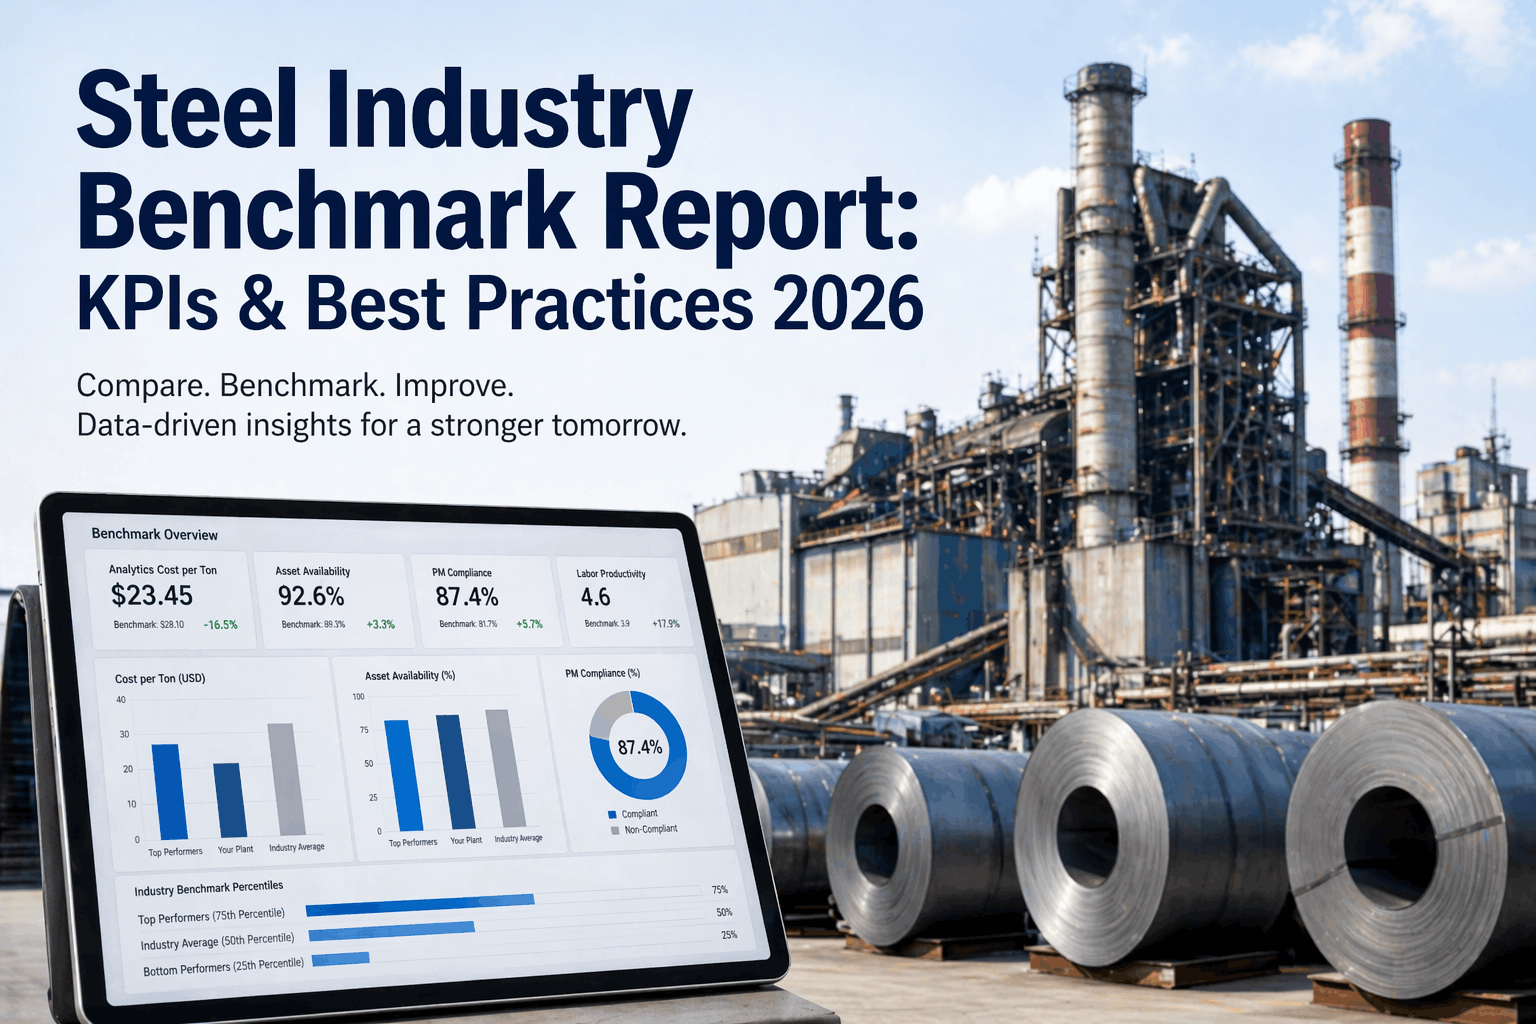
Steel Industry OEE Benchmarks 2026
Performance Standards, Asset Utilization Targets, and Efficiency Gaps Across Steel Manufacturing
68%
Median OEE Across Metals and Steel Plants
80%+
Top-Quartile Steel Plant OEE Target
$15B
Global Blast Furnace System Market (2025)
OEE in Steel: Why the Math Hits Harder Here
In steel, the three OEE factors face extreme pressures that other industries never encounter.
Steel plants face equipment intensity and maintenance demands that hammer availability harder than almost any other industry. A rolling mill case study showed availability at just 70.9%, performance at 91%, and quality at 93.5% — yielding an OEE of only 60.3%. The multiplication effect punishes every small loss.
OEE Benchmarks for Every Steel Process
Steel is not one process — it is a chain of distinct operations, each with its own OEE profile.
Melt Shop (EAF / BOF)
60–65%
75–80%
Refractory wear, electrode consumption, heat-to-heat changeover
Continuous Casting (CCM)
68–72%
82–88%
Sequence breaks, tundish changes, mold oscillation issues
Rolling Mills (HSM / CRM)
63–68%
78–85%
Roll changes, cobble events, speed reductions, grade transitions
Coating & Finishing (GAL / CGL)
70–75%
85–90%
Zinc pot maintenance, coil welds; higher OEE once running
Where Steel Plants Lose OEE: The 3-Factor Analysis
Availability is the primary constraint in steel. Knowing which factor bleeds the most points tells you exactly where to focus.
Top Losses in Steel
✗ Unplanned breakdowns (refractory, roll breakage, hydraulic leaks)
✗ Planned maintenance shutdowns
✗ Roll and tundish changes, cobble recovery
✗ Raw material delays
How Leaders Improve
✓ Predictive maintenance on critical drives and bearings
✓ Condition-based refractory monitoring
✓ SMED roll change procedures
✓ Automated CMMS work order scheduling
Top Losses in Steel
✗ Speed reductions during grade transitions
✗ Micro-stops from sensor trips and misalignment
✗ Threading speed losses on cold mills
✗ Equipment running below rated tonnage/hour
How Leaders Improve
✓ Real-time dashboards flagging speed deviations
✓ Automated grade-change speed profiles
✓ Vibration monitoring on rollers and bearings
✓ Digital twin simulation of optimal throughput
Top Losses in Steel
✗ Surface defects (scale, scratches, inclusions)
✗ Dimensional out-of-tolerance (gauge, flatness, width)
✗ Downgrade from prime to secondary
✗ Startup scrap after changeovers
How Leaders Improve
✓ AI-powered surface inspection systems
✓ Closed-loop gauge control
✓ First-pass yield tracking per coil
✓ Automated defect classification for root cause
Steel vs. Other Industries: Where Do You Stand?
Steel faces unique constraints that make generic "world-class 85%" targets misleading.
Electronics
75%
88%+
Short cycles, high automation
Automotive
75%
85%+
Changeover, lean heritage
Food & Beverage
70%
80–85%
Sanitation, changeover frequency
Metals & Steel
68%
80%+
Equipment intensity, maintenance
Aerospace
65%
78%+
Complex setups, low volumes
Pharmaceutical
37%
60–70%
Validation, batch compliance
Context determines whether your OEE is competitive. A 70% OEE in steel is above the industry median and signals a well-managed operation. Chasing a generic "85% world-class" without understanding steel-specific constraints leads to unrealistic targets and wasted effort.
Find Your Plant's Hidden Capacity
iFactory tracks OEE by line, shift, and product in real time — connecting production data to maintenance workflows so every loss gets a work order, not just a spreadsheet entry. Most steel plants discover 10–15 points of improvement opportunity in the first diagnostic.
Steel-Specific Loss Categories Ranked by Impact
The six big losses take on distinct patterns in steel manufacturing. Here is how they rank by typical OEE impact.
1
Unplanned Equipment Breakdowns
Refractory failures, hydraulic system leaks, roll breakage, and drive motor faults. Accounts for the single largest share of OEE loss in steel — roughly 34% of all efficiency losses in heavy manufacturing environments.
Impact
10–18 pts
2
Setup and Changeover Losses
Roll changes, tundish swaps, grade transitions, and furnace reblowing. In steel, changeovers involve extreme temperatures and heavy tooling — making them inherently longer than in lighter industries.
Impact
6–12 pts
3
Speed and Reduced Rate Losses
Running below rated tonnage per hour due to material quality variation, thermal profile issues, or operator caution. Often invisible because the line is technically "running."
Impact
4–8 pts
4
Minor Stoppages and Micro-Stops
Sensor trips, misalignment alarms, cobble events on rolling mills, and brief material feed interruptions. Individually small, they collectively represent up to 25% of total lost production time.
Impact
3–7 pts
5
Startup Rejects and Scrap
First slabs or coils after a changeover often fail to meet prime specifications. Startup scrap in steel is costly because the raw material value per unit is extremely high compared to lighter manufacturing.
Impact
2–5 pts
6
In-Process Quality Defects
Surface defects, dimensional deviations, and inclusion-related downgrades during normal production. Steel typically maintains 95%+ quality rates, but even small losses are expensive at high per-tonne values.
Impact
1–4 pts
Setting Realistic OEE Targets for Your Steel Plant
Do not chase a generic number. Build a target from your own baseline, your process constraints, and a realistic improvement trajectory.
Measure Accurately for 30+ Days
Many steel plants discover their actual OEE is 10–15% lower than assumed once properly measured with automated tracking
Manual logs miss micro-stops and undercount speed losses — establish your true baseline before setting any targets
Benchmark Against Steel Peers — Not Generic Manufacturing
Compare your melt shop OEE to other melt shops, your rolling mill to other rolling mills
A 68% OEE at a hot strip mill is a fundamentally different situation than 68% at a stamping plant
Target +5 OEE Points Per Year
Sustainable improvement compounds: a 5-point annual gain over three years turns a 62% OEE into a 77% top-quartile performer
Attack the biggest loss category first — in steel, that is almost always unplanned downtime
Set Different Targets per Process Area
Your galvanizing line should have a higher OEE target than your EAF
Your dedicated high-volume product line should target higher than your flexible multi-grade mill — one target across all assets is counterproductive
Rate Your Steel Plant's OEE Maturity
Where does your operation sit today? Each gap is recoverable capacity and margin.
OEE Tracking Method
Spreadsheets / Manual
Shift-Level Reports
Real-Time Automated
Downtime Classification
Unclassified or Broad
Categorized Weekly
Root-Cause per Event
Maintenance Strategy
Reactive / Run to Fail
Calendar-Based PM
Condition-Based / Predictive
Changeover Optimization
No Standard Process
Documented Procedures
SMED-Optimized
Loss Pareto Visibility
No Loss Tracking
Monthly Reviews
Live Dashboard + Alerts
If most answers land in the red or orange columns, your plant likely has 10–20 points of recoverable OEE. That translates to thousands of additional tonnes per year from existing assets — without any capital expenditure on new equipment.
Frequently Asked Questions
What is a good OEE for a steel plant?
The industry median for metals and steel is approximately 68%. Top-quartile steel plants achieve 80%+, but this varies by process area. A melt shop at 75% is excellent; a coating line at 75% has room to improve. Always benchmark against the same process type, not a generic manufacturing number.
Why is the generic "85% world-class" misleading for steel?
The 85% benchmark originated in 1970s Japanese automotive manufacturing — high-volume, highly automated, single-product lines. Steel plants face equipment intensity, extreme operating temperatures, heavy tooling changeovers, and maintenance demands that simply do not exist in automotive stamping. Only about 3% of all manufacturers achieve 85%+ OEE consistently.
Which OEE factor should a steel plant focus on first?
Almost always availability. Availability varies most dramatically in steel due to breakdowns and changeover demands. A rolling mill study found availability at just 70.9% — the single largest drag on OEE. Performance and quality in steel are typically stronger (88–95% each), meaning availability is where the biggest gains hide.
How fast can a CMMS improve steel plant OEE?
Accurate baselining takes 30–60 days. First measurable improvements typically appear within 90–120 days as preventive maintenance workflows reduce unplanned stops. Most facilities see 5–8 OEE points in the first six months, with another 5–7 points over the following 12 months as predictive analytics and changeover optimization take effect.
Stop Guessing. Start Measuring. Close the Gap.
iFactory tracks availability, performance, and quality in real time across every process area — turning raw production data into automated maintenance actions, loss Pareto charts, and OEE trends that tell you exactly where your next 5 points live.