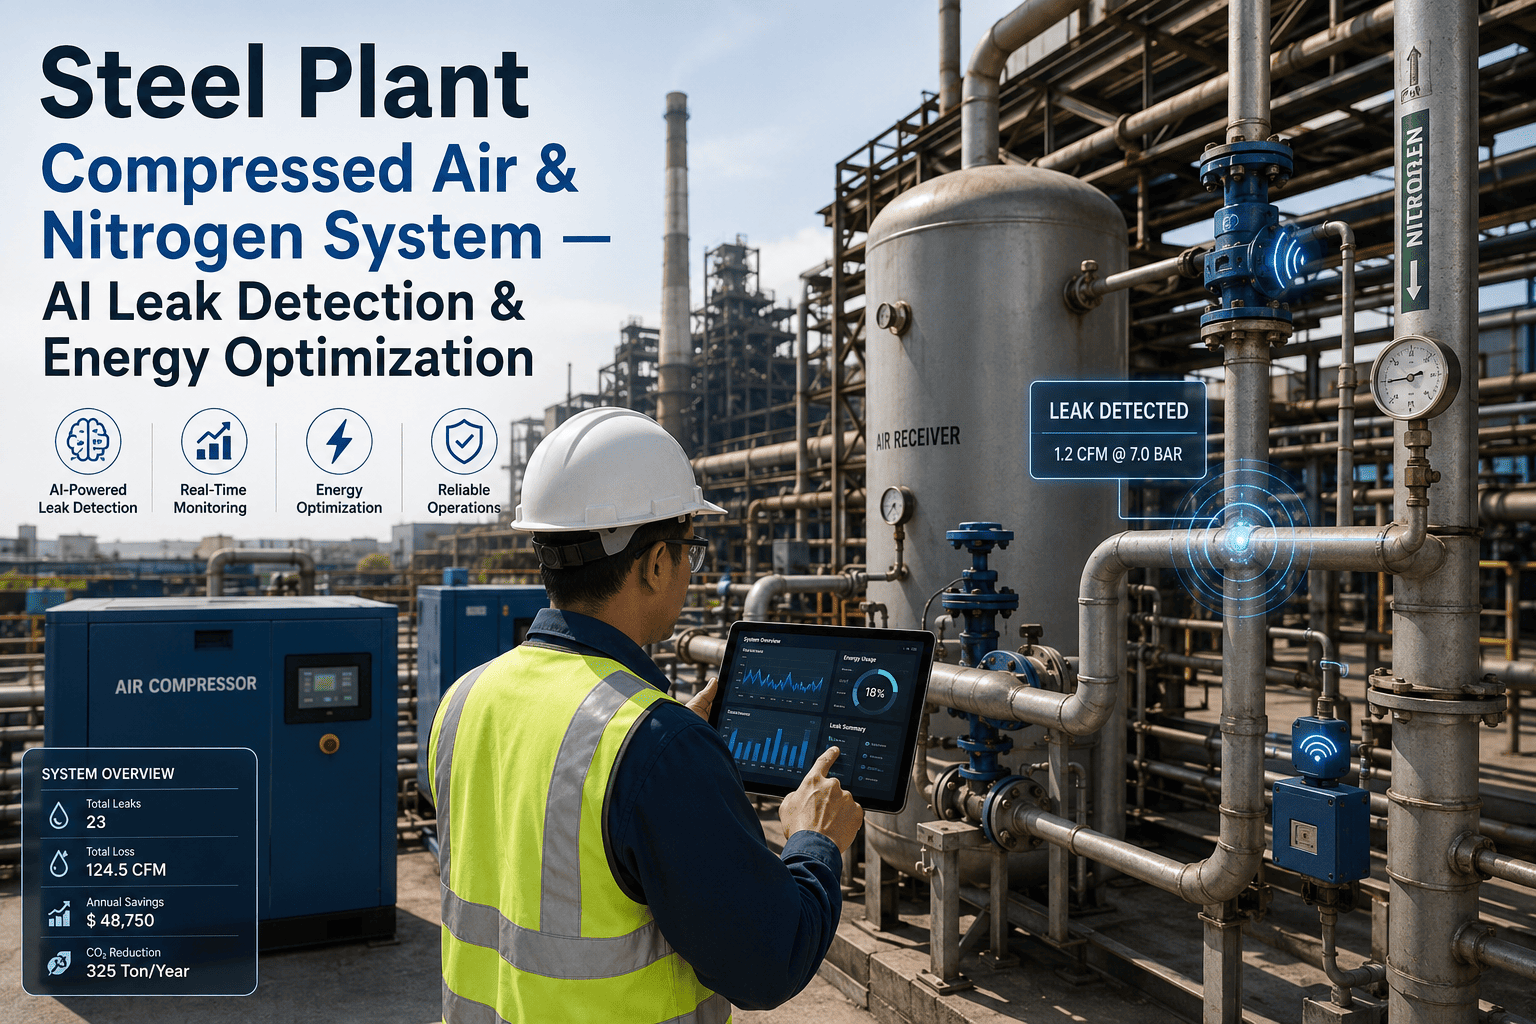
Compressed air and industrial gas systems are the most consistently underestimated energy cost in U.S. steel plant operations — and the most consistently over-tolerated source of waste. A typical integrated steel facility runs 8 to 14 compressor stations supplying instrument air, process air, and nitrogen across rolling mills, blast furnace operations, BOF shops, and utility systems. In aggregate, compressed air generation consumes 20% to 35% of a facility's total electrical load, making it the second-largest energy cost category after electric arc furnace power in most electric steelmaking configurations. The problem is not that plant engineers do not know compressed air is expensive — they do. The problem is that the analytics layer required to manage that cost systematically — leak detection rates by zone, compressor specific power trending, pressure differential monitoring across dryer banks, and demand-side consumption profiling by production area — does not exist at most facilities in any connected form. iFactory's Energy Management and Compressed Air Analytics platform addresses this gap directly, connecting compressor station health monitoring, distribution system leak tracking, dryer and filter performance analytics, and energy cost allocation into a single operational layer that converts air system management from a reactive maintenance task into a measured efficiency program. U.S. steel facilities deploying iFactory's compressed air analytics report 22% to 31% reduction in compressed air system energy cost, 67% reduction in undetected air leak volume, and an average $380,000 to $940,000 annual energy cost recovery depending on facility size and baseline leak rate.
Why Compressed Air Waste in Steel Plants Is Systematically Underestimated
The energy economics of compressed air are counterintuitive enough that most plant managers, when shown the actual figures, are surprised by the magnitude. Generating one standard cubic foot of compressed air at 100 psi requires approximately 0.22 to 0.25 kWh of electricity. At an industrial electricity rate of $0.065 to $0.095 per kWh, that translates to $0.014 to $0.024 per scf — a number that seems negligible until multiplied by the 50,000 to 200,000 scfm that a large steel facility consumes continuously. Industry studies consistently find that 25% to 35% of compressed air generated in industrial facilities is lost to leaks before it reaches a productive end-use point. In a steel plant consuming $3.2 million annually in compressed air energy, a 30% system leak rate represents $960,000 in electricity generating air that escapes through fitting connections, valve packing, condensate drain failures, and corroded distribution piping — none of which shows up as a line item in the energy budget unless someone is measuring it.
Beyond leak losses, steel plant compressed air systems suffer from pressure-flow management problems that are equally costly but even less visible. Oversized system pressure — running the header at 110 psi when the highest-demand application requires 90 psi — adds 1% to 2% energy cost per psi of unnecessary pressure. Compressors running in unloaded condition to maintain system pressure during low-demand periods consume 15% to 25% of full-load power while delivering zero productive flow. Dryer and filter maintenance deferrals cause pressure drop buildup that the compressor compensates for by running harder. iFactory's analytics platform makes all of these conditions visible and manageable. Book a Demo to see how iFactory's energy analytics platform applies to your facility's compressor infrastructure.
- Air leaks in distribution piping and end-use connections estimated at 25%–35% of total generation
- Compressor specific power trending not tracked — degradation invisible until failure
- Dryer and filter pressure drop allowed to accumulate — compressor compensates with higher energy input
- System pressure set 15–25 psi above actual demand — excess generation cost built into baseline
- Unloaded compressor runtime not measured — idle energy consumption unaccounted
- Gas network consumption by production area unknown — no basis for demand-side optimization
- Leak detection by zone with estimated flow rate and energy cost — prioritized repair queue
- Compressor specific power trended continuously — efficiency degradation detected weeks before failure
- Dryer and filter differential pressure tracked with maintenance alerts before pressure drop builds
- Demand-profiling analytics identify pressure optimization opportunities by shift and production mode
- Unloaded runtime tracked per compressor — sequencing optimization reduces idle energy waste
- Gas consumption mapped by production area — demand-side analytics drive targeted efficiency programs
Compressor Station Analytics: Equipment Health to Energy Performance in One View
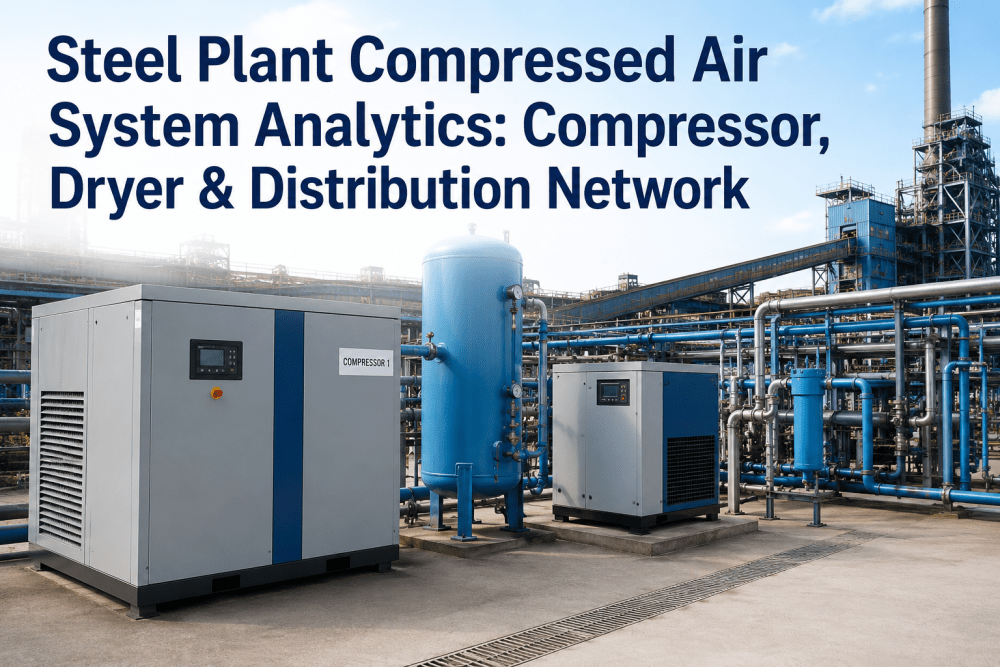
Compressor station management in most steel plants is split between the electrical team (who own the motor and drive) and the mechanical team (who own the compression stage, coolers, and lubrication), with neither team having a unified view of equipment energy efficiency. iFactory resolves this split by creating a compressor asset record that integrates motor power, flow output, inlet conditions, inter-stage temperatures, and lubrication system performance into a single specific power calculation — kWh per thousand standard cubic feet — that serves as the primary health and efficiency indicator for each machine.
Air Leak Detection and Distribution System Analytics: Quantifying the Invisible Loss
Air leaks in steel plant compressed air distribution systems are the largest single recoverable energy loss category in most facilities — and the most difficult to manage without dedicated analytics infrastructure. Manual ultrasonic leak surveys, conducted quarterly or annually, identify leaks present on the survey date but provide no information about leak development between surveys, no prioritization by energy cost impact, and no verification that repaired leaks stay repaired. iFactory's distribution system analytics layer converts leak management from a periodic survey exercise into a continuous, quantified, prioritized program with documented energy recovery for each repair completed.
| Leak Category | Typical Location in Steel Plant | Estimated Flow Loss | Annual Energy Cost (at $0.08/kWh) | iFactory Detection Method | Repair Priority |
|---|---|---|---|---|---|
| Large Distribution Leaks (>10 scfm) | Main header flanges, isolation valve packing, expansion joints | 10–50 scfm per event | $3,800–$19,000 per leak annually | Flow balance monitoring, pressure drop trending | Immediate — P1 work order |
| Medium Leaks (2–10 scfm) | Branch line fittings, quick-connect couplings, FRL units | 2–10 scfm per event | $760–$3,800 per leak annually | Zone flow metering, ultrasonic survey integration | Schedule within 2 weeks — P2 |
| Small Leaks (<2 scfm) | Pneumatic tool connections, instrument air tubing, condensate drains | 0.1–2 scfm per event | $38–$760 per leak annually | Zone metering anomaly detection, survey tagging | Batch repair — monthly PM schedule |
| Condensate Drain Failures | Dryer condensate drains, receiver tank drains, filter bowl drains | 5–30 scfm constant blow | $1,900–$11,400 per failed drain | Drain cycle monitoring, flow anomaly alerts | Immediate — P1 work order |
| Pressure Regulator Bypass | Point-of-use pressure regulators, zone pressure reducing valves | 3–15 scfm when failed open | $1,140–$5,700 per failure annually | Downstream pressure monitoring, flow vs. demand deviation | Schedule within 1 week — P2 |
iFactory's zone metering approach divides the compressed air distribution system into monitored segments with flow measurement at each branch point. By comparing zone inlet flow against zone outlet consumption, the platform calculates the implied leak rate for each zone continuously — without requiring physical access or survey scheduling. When a zone's implied leak rate exceeds a configurable threshold, a leak investigation work order is generated with the estimated energy cost of the identified leak attached, giving the maintenance team a financial justification for prioritizing the repair alongside the location data needed to find it efficiently.
Industrial Gas Network Analytics: Nitrogen, Oxygen, and Process Gas Management for Steel Operations
Beyond compressed air, U.S. steel plants operate extensive industrial gas distribution networks — nitrogen for furnace atmosphere control and purging, oxygen for BOF and EAF injection, argon for ladle metallurgy, and natural gas for reheat furnaces and annealing lines. Each gas network has its own supply infrastructure, its own energy cost profile, and its own set of operational losses that accumulate without measurement. iFactory's gas analytics layer extends the same monitoring principles applied to compressed air across every industrial gas network in the facility.
Compressed Air Analytics Deployment: From Baseline Assessment to Continuous Optimization
iFactory's compressed air and gas analytics deployment follows a four-phase methodology that converts existing metering infrastructure, SCADA data, and utility billing into a live analytics environment within 6 to 10 weeks. The methodology builds from a current-state baseline through integration, configuration, and optimization review — establishing the documented savings baseline that justifies sustained program investment.
Expert Perspective: What Energy Managers at U.S. Steel Plants Learn From Compressed Air Analytics
I managed energy programs at an integrated steel mill in Indiana for nine years before transitioning to energy management consulting, and the consistent finding at every facility I worked with was that compressed air was the most expensive utility nobody was actually measuring. We had sub-metering on the electric arc furnace, on the rolling mill drives, on the reheat furnaces — but the compressor station was on a single utility meter shared with half the facility, and the distribution system had no flow measurement beyond the station header. We were generating roughly $2.8 million in compressed air annually and had absolutely no idea what fraction of that was reaching a productive end use. When we finally installed zone metering and ran the balance calculation, the implied leak rate was 31%. That was $868,000 a year in electricity generating air that was going through fitting connections and worn valve seats in the pipe racks. The most striking thing about that number is not its size — it is that it had been there for years and nothing in our existing reporting structure had revealed it. The specific power drift on two of our older centrifugal compressors was equally invisible. Both machines had been running at 12% above design specific power for at least 18 months before we started tracking it. Between the leak losses and the compressor efficiency degradation, we were spending over $1.1 million more per year than we needed to on compressed air — in a facility that had active cost reduction programs running in every other utility category. The analytics do not require exotic instrumentation or a major capital program. They require connecting what most facilities already have — flow meters, power analyzers, pressure transmitters — into a system that calculates the right KPIs and alerts on deviations. That connection is what iFactory provides, and it is what turns compressed air from a fixed cost into a managed efficiency program."
Conclusion
Compressed air and industrial gas systems represent the largest category of recoverable energy cost in most U.S. steel facilities — and the category most consistently managed without the analytics infrastructure required to measure, track, and optimize it. The 22% to 31% energy reduction, 67% leak volume reduction, and $380,000 to $940,000 annual cost recovery that iFactory's platform delivers are not the result of new technology or major capital investment. They are the result of connecting existing instrumentation into a system that calculates specific power, tracks distribution leaks by zone, monitors treatment equipment performance, and correlates gas consumption with production outcomes — converting a utility cost that has been managed by assumption into one managed by measurement.
For steel plants where compressed air energy cost runs $1.5 million to $5 million annually, the ROI case for analytics infrastructure is not marginal — it is compelling at almost any reasonable deployment investment. iFactory's energy analytics platform deploys against existing metering infrastructure in 6 to 10 weeks with documented savings beginning in the first 90 days. Book a Demo to see how iFactory's compressed air and gas analytics platform applies to your facility's specific compressor infrastructure, distribution configuration, and gas network topology.
Frequently Asked Questions
No. iFactory integrates with existing SCADA historians, PLCs, and plant networks through standard protocols — pulling data from existing instrumentation without replacing any controls. New metering is added only where gaps exist, identified during the baseline assessment phase.
iFactory uses zone flow balance metering — comparing inlet flow to each distribution segment against measured end-use consumption — to calculate implied leak rates continuously. Physical location is identified through integrated ultrasonic survey data and maintenance team inspection, prioritized by the platform's zone-level energy cost ranking.
Yes. iFactory's energy analytics layer supports simultaneous monitoring of compressed air, nitrogen, oxygen, argon, and natural gas networks within the same platform, with separate KPI dashboards, alert configurations, and reporting by gas type and production area.
iFactory generates automated monthly energy performance reports comparing current period KPIs against the pre-deployment baseline, with cumulative savings calculations by category. Reports include work order closure data for leak repairs and maintenance actions, creating an auditable savings record for finance and capital project justification.
Deployment for a facility with 4 to 8 compressors and full distribution analytics runs $55,000 to $130,000 over 6 to 10 weeks. Most facilities achieve full payback within 3 to 5 months from leak remediation savings alone. Book a Demo for a site-specific ROI model.