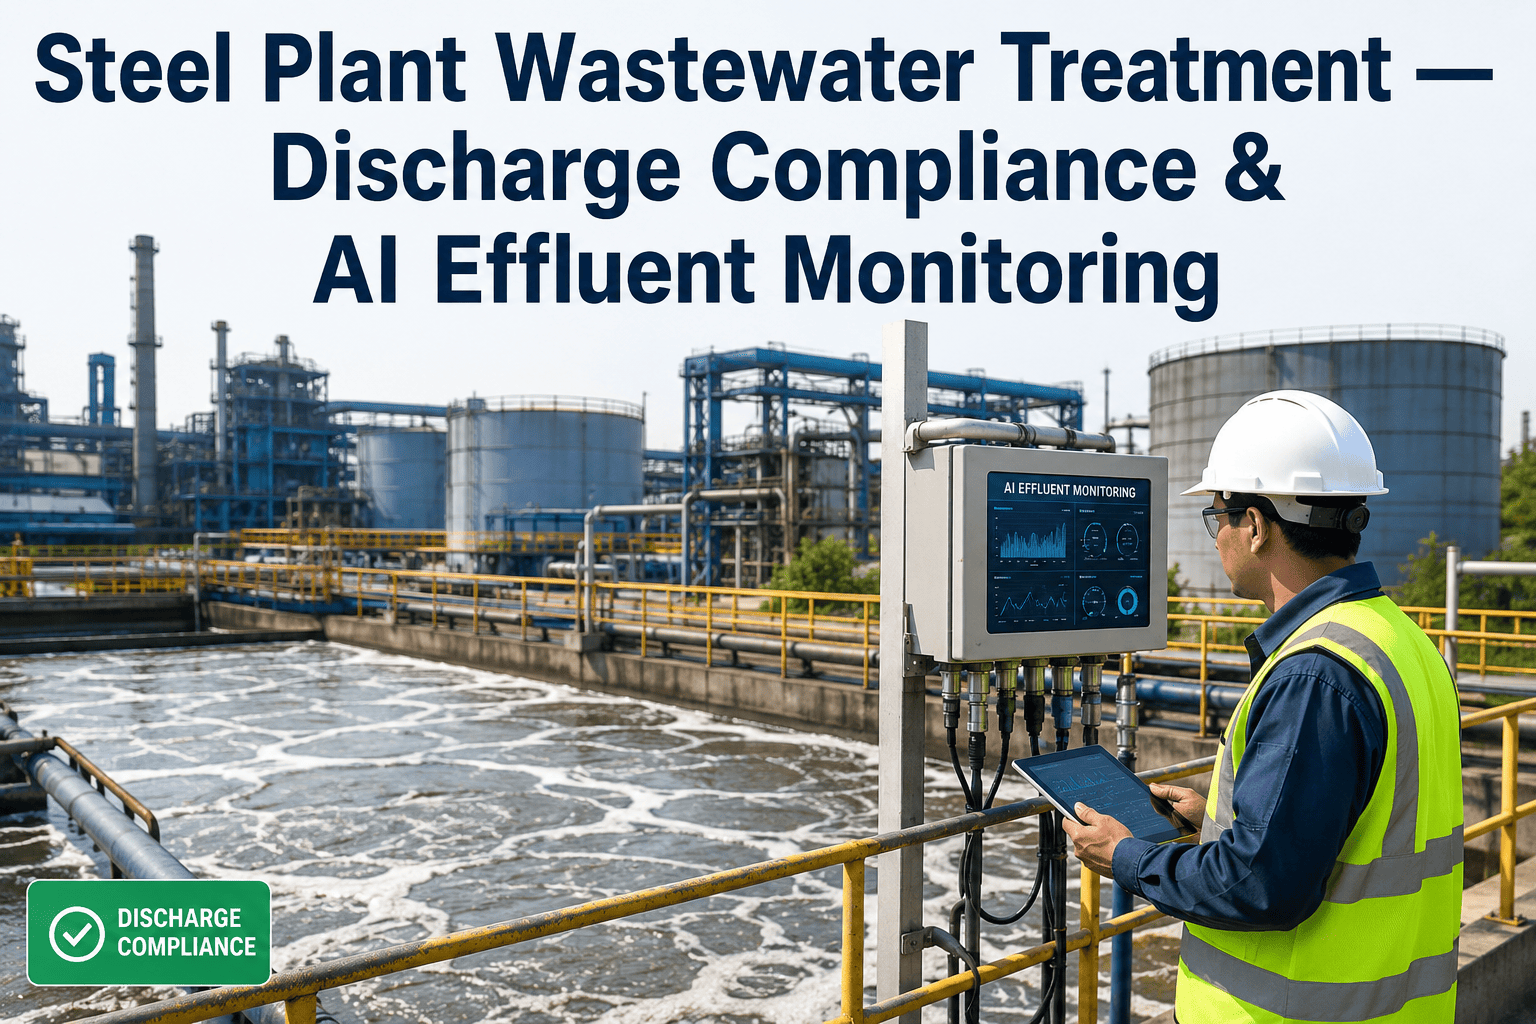
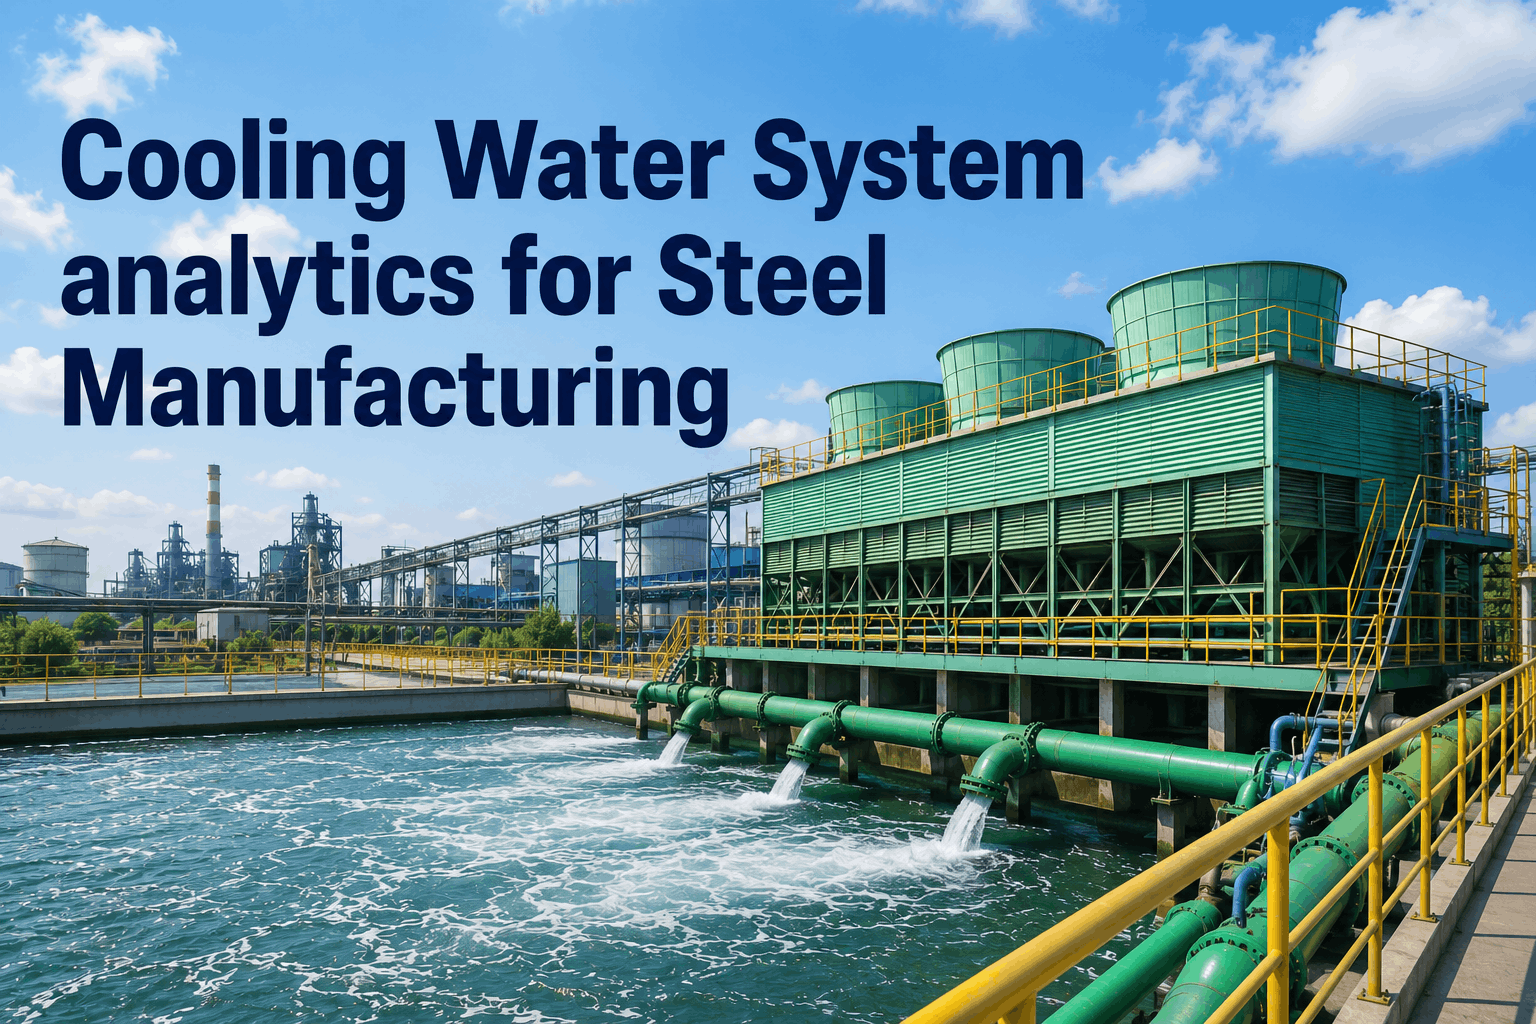
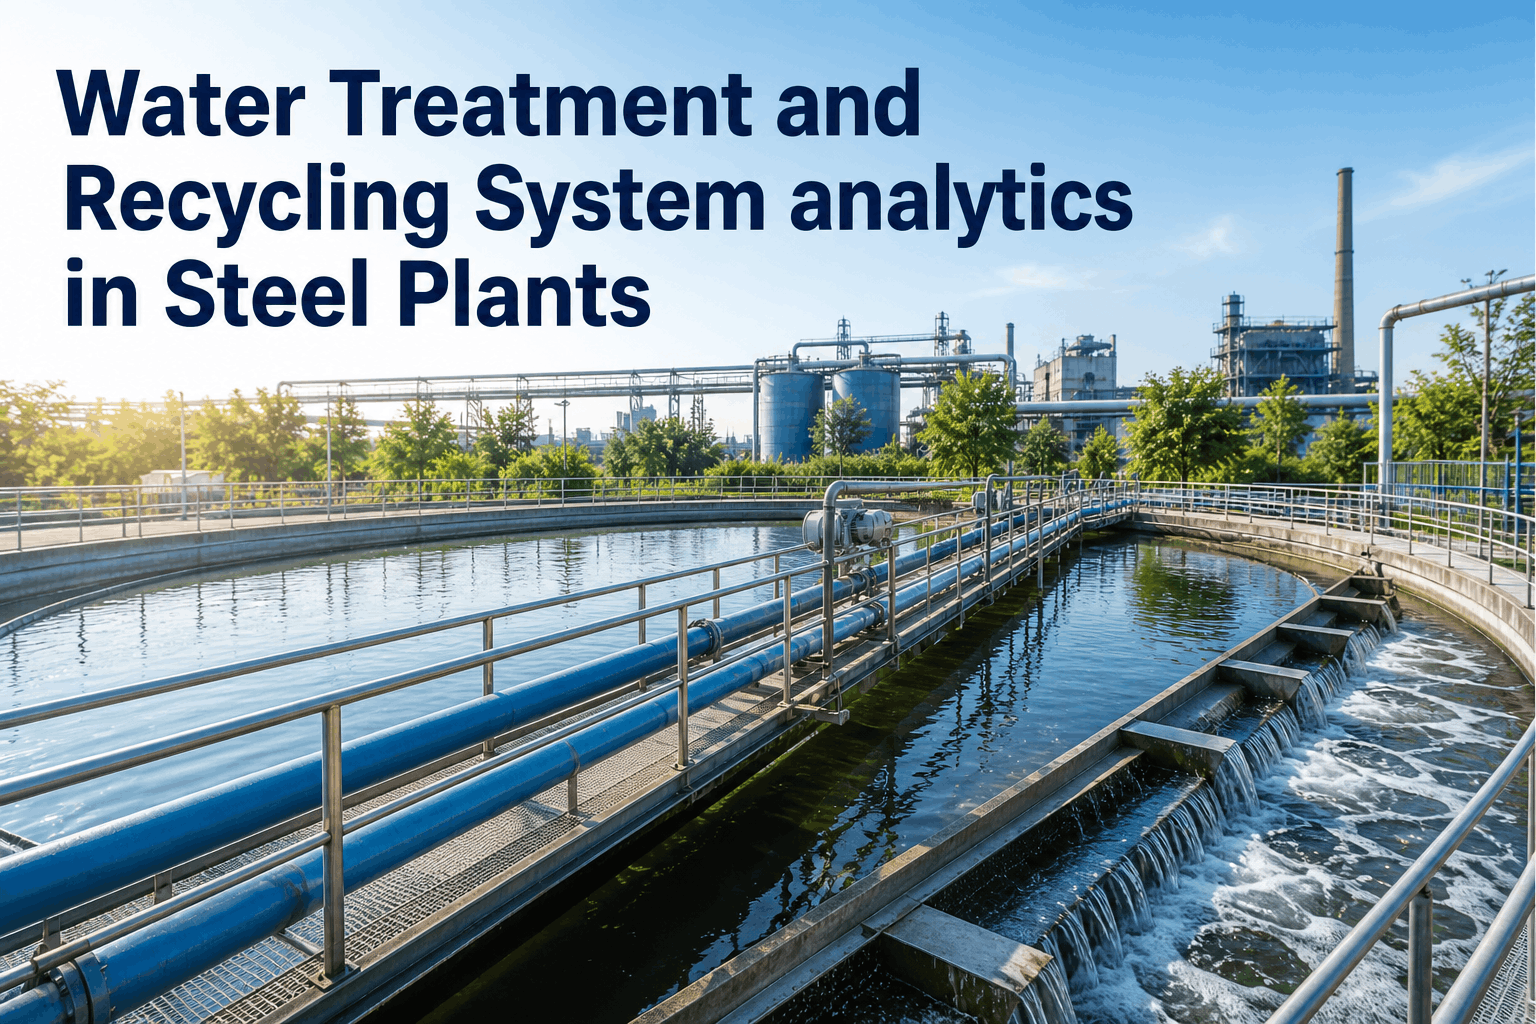
Steel mills consume between 25 and 80 cubic meters of water per ton of steel produced depending on plant configuration, and that water moves through cooling towers, descaling systems, continuous caster secondary cooling, gas cleaning circuits, and effluent treatment plants — all simultaneously, all with quality and flow requirements that paper logs and manual grab samples cannot keep pace with. When cooling water chemistry drifts unchecked, scale deposits on heat exchangers reduce heat transfer efficiency, drive up energy consumption, and eventually cause tube failure that forces an unplanned outage. When effluent treatment chemistry falls out of specification, the discharge event that follows can trigger a regulatory violation before the lab result is even posted. iFactory's water treatment analytics platform is purpose-built for the steel mill water cycle — connecting conductivity, pH, turbidity, flow, and temperature sensors across every circuit into a single operational dashboard, scheduling PM for chemical dosing systems and cooling tower basin cleanouts, and flagging drift before it becomes a compliance event or a maintenance emergency. Steel mills deploying iFactory's water treatment analytics report 31% reduction in water consumption per ton of steel, 44% reduction in unplanned heat exchanger cleaning events, and 100% on-time regulatory reporting without manual data compilation.
Real-Time Water Treatment Analytics for Steel Mills — From Cooling Tower Chemistry to Effluent Compliance, Managed in One Platform.
iFactory connects every water circuit in your steel mill — cooling towers, descalers, caster secondary cooling, and ETP — to a single analytics platform that monitors quality in real time, schedules chemical dosing PM, and generates audit-ready compliance reports automatically. Stop chasing grab samples and start managing water as a measurable operational asset.
Reduction in water consumption per ton of steel with iFactory real-time circuit analytics
44%
Fewer unplanned heat exchanger cleaning events via early scale detection and dosing alerts
100%
On-time environmental compliance reporting without manual data entry or lab-result chasing
2.4×
Increase in cooling tower cycles of concentration via chemistry optimization and blowdown control
Why Steel Mill Water Treatment Demands Dedicated Analytics — Not Generic SCADA Dashboards
The water systems in an integrated steel mill or EAF operation are not a single loop. They are five to twelve distinct circuits — each with its own chemistry requirements, contamination sources, quality thresholds, and regulatory obligations — operating simultaneously and interacting with each other through shared blowdown, makeup water, and recirculated effluent streams. A generic SCADA dashboard that shows you a conductivity reading from one point in the cooling circuit is not the same as an analytics platform that tracks the Langelier Saturation Index trend across all four cooling tower cells, correlates it with makeup water hardness from the softener outlet, and alerts the water treatment technician when the scaling tendency is crossing the threshold that historically precedes tube fouling in the rolling mill heat exchangers.
Steel-specific water analytics require domain logic built into the platform — rejection criteria for descaling nozzle pressure drop that account for water quality history, ETP chemistry correlations that flag when incoming mill scale load is spiking before the clarifier is overloaded, and ZLD system monitoring that tracks RO reject concentration so the evaporator is not shock-loaded without warning. iFactory's water treatment analytics platform embeds this domain logic rather than expecting the water treatment supervisor to manually apply it to raw sensor feeds. Book a Demo to see iFactory configured for your facility's specific water circuit architecture.
Manual / Generic SCADA Approach
Grab samples, paper logs, reactive response
Chemistry drift identified at grab sample — 4 to 12 hours after the event began
Scale deposits detected when heat transfer efficiency drops — after fouling is already established
ETP exceedance discovered at lab result — discharge may have already occurred
PM scheduling based on calendar intervals regardless of actual system condition
Compliance reports assembled manually from multiple log sources — audit gaps common
ZLD system operated reactively — evaporator overload events from concentrate spikes
Result: 18–32% higher water cost per ton, recurring compliance risk
iFactory Water Treatment Analytics
Continuous sensors, domain logic, automated PM
LSI and chemistry trend monitored continuously — drift alert before scaling threshold is crossed
Heat exchanger fouling factor tracked in real time — cleaning scheduled at optimal interval
ETP influent quality monitored upstream — treatment adjustment before effluent specification is at risk
PM triggered by condition: chemical inventory, dosing pump runtime, filter differential pressure
Compliance reports auto-generated from sensor records — audit-ready with zero manual compilation
Result: 31% lower water cost per ton, 100% on-time compliance reporting
Water Circuit Coverage — Every Loop in the Steel Mill Water System Monitored
iFactory's platform monitors all water circuits across the steel mill from a single interface. The table below maps each circuit type to the parameters monitored, the PM tasks automated, the compliance obligation managed, and the documented improvement at comparable deployments.
Water Circuit
Key Parameters Monitored
PM Tasks Automated
Compliance / Risk Managed
Improvement at Deployment
Cooling Tower Systems
Conductivity, pH, LSI, cycles of concentration, blowdown flow, makeup flow, temperature differential
Blowdown valve scheduling, chemical dosing PM, basin inspection, fill media inspection
Legionella control program, blowdown discharge permit, water conservation target
2.4× cycles of concentration, –38% blowdown volume
Descaling Systems
Nozzle pressure drop, flow rate per header, water quality at descaler inlet, scale index
Nozzle inspection PM triggered by pressure drop trend, filter backwash scheduling
Evaporator cleaning PM triggered by performance trend, crystallizer cycle management
Zero liquid discharge permit, evaporation efficiency target, salt recovery
–35% unplanned evaporator shutdowns via early scaling detection
Core Analytics Capabilities — What Steel Mill Water Managers See on the Platform
The capability architecture below describes the five core analytical functions that distinguish iFactory's water treatment platform from basic SCADA monitoring. Each capability is built around a specific failure mode observed across steel mill water systems and is designed to give the water treatment supervisor actionable information rather than raw sensor data.
Cap 1
Real-Time Chemistry Analytics — LSI, Scaling Tendency, and Corrosion Index Across All Circuits
iFactory continuously calculates Langelier Saturation Index, Ryznar Stability Index, and Puckorius Scaling Index from live sensor feeds — not from manual grab samples entered into a spreadsheet 12 hours after collection. When the cooling circuit's LSI trend indicates scaling is accelerating, the platform flags it before tube fouling reduces heat exchanger performance. When corrosion index trends toward the aggressive range, the dosing adjustment recommendation appears with the alert. The water treatment supervisor manages chemistry by trend rather than by crisis.
PM Scheduling by Condition — Chemical Dosing Systems, Filter Media, Pumps, and Nozzles
Water treatment PM in a steel mill is not best managed by calendar intervals. A chemical dosing pump that has run 240 hours at high duty cycle in August heat needs a valve inspection at a different interval than the same pump running 80 hours in February. iFactory schedules PM by condition — dosing pump runtime, filter differential pressure trend, softener hardness breakthrough history, descaler nozzle pressure drop — so maintenance resources are deployed at the point of actual need rather than at fixed calendar intervals that are either too frequent or too infrequent for the operating conditions in that period.
ETP Influent Monitoring — Upstream Load Detection Before Treatment Capacity Is Exceeded
Effluent treatment plant overloads in steel mills are almost always preceded by an upstream event — a rolling mill scale flush, an accidental oil release in a hydraulic bay, a heavy rain event mobilizing mill yard contamination. iFactory monitors ETP influent quality upstream of the clarifier so the treatment response — increased coagulant dose, reduced flow rate, sludge removal trigger — is initiated before the overload reaches the final effluent discharge point. This upstream-first monitoring architecture is what enables 100% discharge permit compliance rates at iFactory deployments.
Water Balance and Consumption Analytics — Per Circuit, Per Production Unit, Per Ton of Steel
Water consumption normalized to production output — cubic meters per ton of steel, per heat, per coil — is the metric that connects water management to cost accounting and sustainability reporting. iFactory calculates this metric automatically from flow sensor data and production records, disaggregates it by circuit and by production unit, and produces the trend analysis that identifies where water efficiency is degrading before it shows up in the annual water audit. For mills targeting water intensity reduction goals, this capability provides the baseline measurement and the ongoing tracking required to manage the target.
Automated Compliance Reporting — NPDES, Discharge Permits, and Environmental Audit Records
Environmental compliance reporting for steel mill water systems requires assembling data from multiple circuits — ETP final effluent quality, cooling tower blowdown discharge, stormwater pond overflow events, ZLD system performance — across reporting periods that do not align with operational shift boundaries. iFactory auto-generates these reports from sensor records and inspection data, formats them to the permit's reporting requirements, and archives them with the timestamp and data integrity chain that regulatory auditors require. The water treatment manager's monthly compliance report goes from a 4-hour manual compilation to a 10-minute review of a system-generated document.
Manage Every Water Circuit in Your Steel Mill From One Platform — Chemistry, PM, Compliance, and Water Cost in One View.
iFactory's water treatment analytics connects your cooling towers, descalers, caster cooling, ETP, and ZLD system into a single operational dashboard that alerts before exceedances, schedules PM by condition, and generates audit-ready compliance reports automatically.
ZLD and Water Recirculation: Managing the Closed-Loop Water System in a Modern Steel Mill
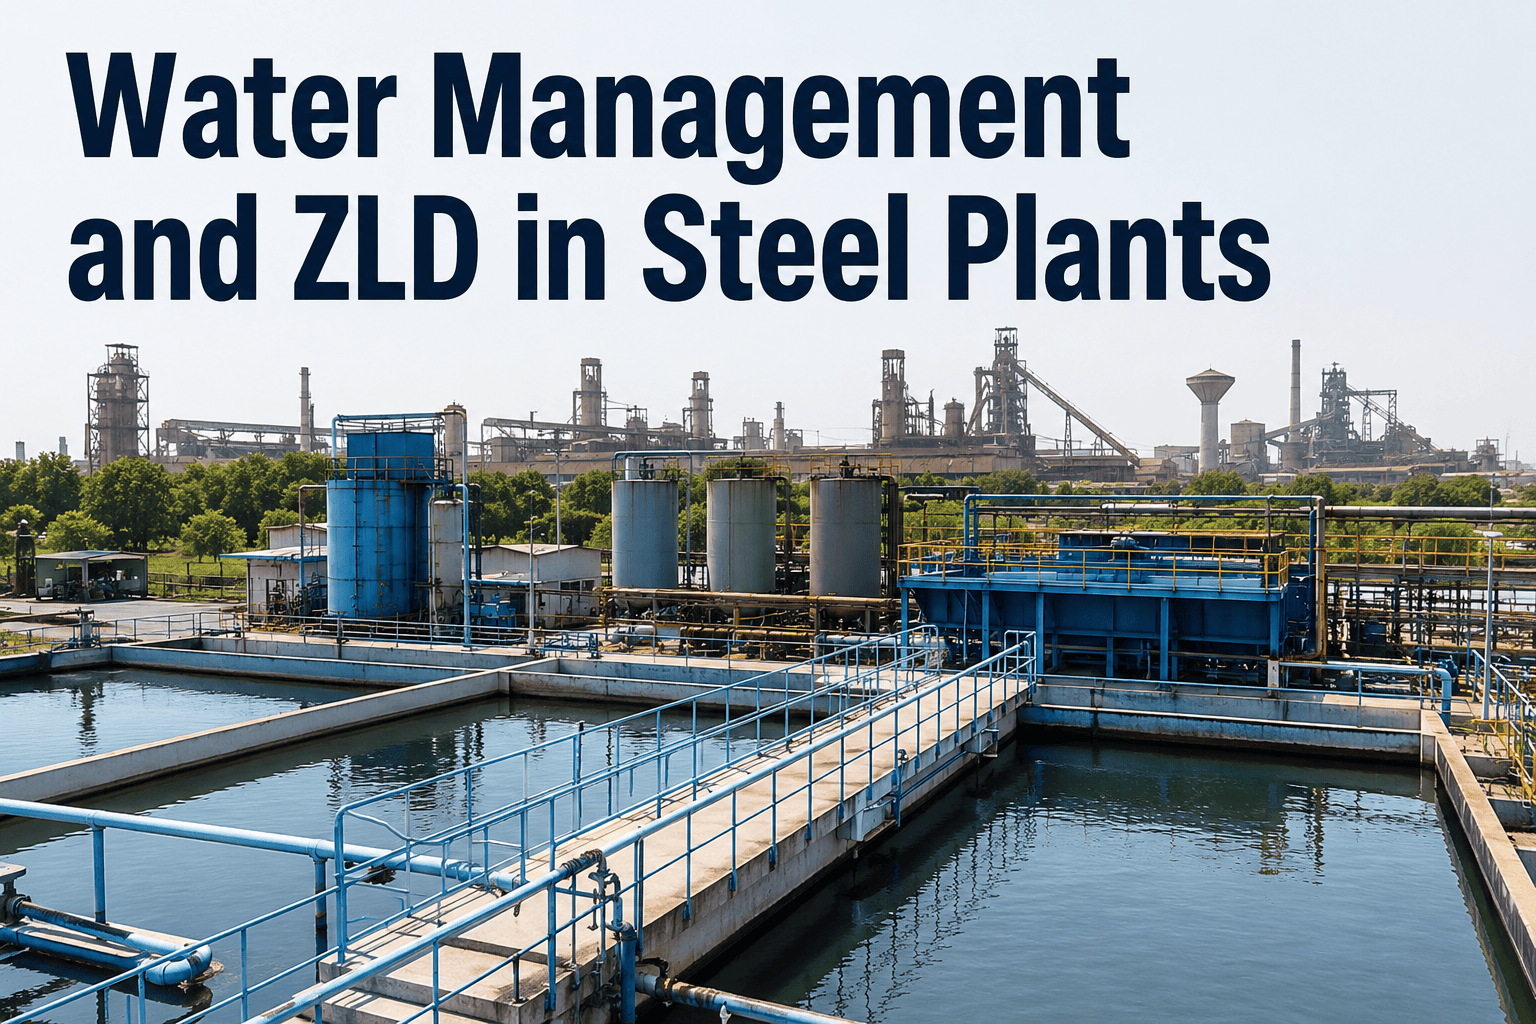
Zero liquid discharge targets and water scarcity pressures are reshaping how steel mills manage their water circuits. A mill that operated on once-through or minimal-recirculation water systems a decade ago is now under regulatory and operational pressure to maximize recirculation, minimize makeup water draw, and achieve zero or near-zero discharge. The operational challenge this creates is significant: higher cycles of concentration in cooling circuits increase scaling and corrosion risk, higher suspended solids in recirculated water accelerate nozzle plugging in descalers and caster cooling, and ZLD systems require active management of concentrate chemistry to prevent evaporator scaling that reduces availability.
iFactory's analytics platform is built for this closed-loop operating reality. The water balance model tracks recirculation ratios across all circuits, monitoring cycles of concentration against the chemistry-based maximum for the current water quality. When the system indicates that blowdown reduction is possible without crossing the scaling threshold, the recommendation is surfaced — enabling water conservation without compromising equipment protection. When ZLD concentrate TDS is trending toward the evaporator's design maximum, the alert gives the water treatment supervisor time to adjust blowdown routing before the evaporator is shock-loaded. Book a Demo to see this recirculation optimization applied to your mill's current water balance.
Water Recirculation Optimization — How iFactory Manages the ZLD Transition
Phase 1: Baseline Water Balance
iFactory maps all water inputs, recirculation loops, and discharge points. Consumption per circuit per ton of steel is established as the baseline for improvement measurement. Blowdown volumes, makeup water draw, and recirculation ratios are quantified for the first time with consistent sensor-based data.
Phase 2: Chemistry Optimization for Higher Cycles
With continuous LSI and corrosion index tracking, blowdown rates are reduced incrementally while chemistry stability is confirmed by sensor data. Cycles of concentration increase from an average of 3.2 to 5.8 at comparable deployments, reducing makeup water draw by 28 to 38% without scaling events.
Phase 3: Upstream Contamination Control
Higher recirculation ratios concentrate contaminants — oil, suspended solids, heavy metals — that degrade water quality and risk ETP overload. iFactory's upstream monitoring identifies contamination sources before they impact treatment capacity, enabling source control at the mill circuit level rather than remediation at the ETP.
Phase 4: ZLD System Performance Monitoring
For mills with evaporator/crystallizer ZLD systems, iFactory monitors concentrate TDS, evaporation rate, and scaling indicators continuously. Evaporator cleaning is scheduled by condition-based PM rather than fixed calendar intervals, extending mean time between cleanings from 45 to 78 days at comparable deployments.
Phase 5: Compliance Reporting and Continuous Target Management
Water intensity targets — cubic meters per ton, recirculation ratio, discharge permit compliance rate — are tracked automatically against the mill's stated goals. Monthly environmental compliance reports are generated without manual data compilation. Water conservation progress is documented with the data quality required for sustainability reporting and regulatory submissions.
Integration With iFactory CMMS — Water Treatment PM in the Same System as Equipment Maintenance
Water treatment assets — chemical dosing pumps, clarifier mechanisms, filter presses, softener vessels, cooling tower fan motors, ZLD evaporator components — are equipment assets that require preventive maintenance, spare parts inventory, and work order management just like rolling mill gearboxes and ladle crane hoists. The failure mode in most steel mill water programs is that water treatment PM runs on a separate paper schedule or a standalone spreadsheet while the main CMMS manages equipment maintenance — and the two systems never communicate. A cooling tower fill media replacement that should be triggered by a drift eliminator pressure drop reading instead gets missed because the reading lives in a SCADA historian and the work order system never sees it.
iFactory integrates water treatment analytics directly into the CMMS work order system. A conductivity trend that indicates imminent softener resin breakthrough generates a condition-based PM work order in the same system where the rolling mill's weekly lubrication route lives. Chemical inventory levels monitored at the dosing skid trigger a purchase requisition when the biocide drum drops below the two-week supply threshold. Cooling tower basin inspection intervals are adjusted based on the season's actual chemistry load, not a fixed calendar date. The water treatment supervisor manages water assets as first-class maintenance objects, not as a separate manual process running parallel to the CMMS. Book a Demo to see iFactory's CMMS integration applied to your water treatment asset register.
Condition-Based PM Triggers
Work orders for dosing pump valve inspection, filter backwash, and softener regeneration are triggered by sensor-measured condition — pump runtime hours, differential pressure trend, hardness breakthrough — not fixed calendar dates. Maintenance happens when needed, not on a schedule that is wrong half the time.
Chemical Inventory Management
Corrosion inhibitor, scale inhibitor, biocide, coagulant, and flocculant inventory levels are tracked against dosing consumption rates. Low-inventory alerts appear before the minimum stock threshold is reached, and purchase requisitions are auto-generated so the chemical program is never interrupted by a stockout.
Auto Compliance Report Generation
NPDES monthly discharge monitoring reports, cooling tower Legionella inspection records, and stormwater permit documentation are auto-generated from sensor data and inspection records. Zero manual data compilation, zero audit gaps, and a complete digital chain of custody for every reported parameter.
Real-Time Exceedance Alerts
When any monitored parameter crosses the action threshold — ETP effluent TSS approaching permit limit, cooling circuit pH outside treatment range, descaler nozzle pressure drop above plugging threshold — the responsible person receives an alert with current trend, historical context, and recommended action. Response in minutes, not hours.
SAP PM and Maximo Integration
Work orders generated from water treatment analytics flow directly into SAP PM, IBM Maximo, or Infor EAM via REST API integration — pre-populated with asset ID, circuit location, parameter reading, deviation from spec, and recommended action. No duplicate entry, no re-keying between systems.
Water Cost Reporting by Production Unit
Water consumption is disaggregated to the production unit level — blast furnace, caster, rolling mill, finishing line — so the cost-per-ton contribution of each circuit is visible to plant management. Water intensity trends appear in the same production performance dashboard as energy and yield metrics.
Expert Review: What Steel Mill Environmental and Maintenance Managers Say About Water Analytics Deployment
"We were spending 22% of our water treatment budget on reactive chemistry correction — dosing adjustments made after the chemistry had already drifted far enough to cause a scaling or corrosion event. The paper-and-grab-sample workflow we were running meant that by the time the lab result came back, the damage to the heat exchanger tubes or the descaler nozzles was already progressing. The thing that changed with iFactory's analytics platform was not just the speed of detection — it was that for the first time we had trend data across all six of our major water circuits simultaneously rather than six separate grab sample programs that each had a 6-to-12-hour information lag. We could see that when the blast furnace gas cleaning circuit's suspended solids spiked, it correlated with a pH drop in the cooling circuit 40 minutes later via the shared blowdown routing — a connection we had never been able to document on paper. That kind of cross-circuit intelligence is what the platform enables. Our water cost per ton of steel dropped 27% in the first 18 months. Our ETP compliance record went from two permit exceedances per year to zero in the same period. The environmental manager's monthly reporting workload dropped from two days of manual compilation to 45 minutes of system-generated report review. For a plant that was skeptical of another technology deployment, the ROI evidence was fast enough and clear enough that the water analytics program became the reference case for every other digital deployment we evaluated."
Director of Environmental and Utilities EngineeringMidwestern Integrated Steel Mill — 3.8 Million Ton Annual Production — 17 Years Utility Management — PE Licensed
Conclusion: Water Treatment Analytics Is an Operational Necessity, Not a Monitoring Add-On
The water systems in a steel mill are not background infrastructure — they are production-critical assets whose condition directly affects equipment reliability, product quality, environmental compliance, and operating cost. Descaler nozzles that are 15% plugged from scale buildup reduce surface quality on the rolled product. Cooling circuit chemistry that has drifted outside specification for 8 hours while the grab sample sat waiting for a lab result has already deposited scale that will cost twice as much to remove as it would have to prevent. ETP treatment that is overloaded by an upstream contamination event the operator learned about from a turbid effluent sample — not from an upstream sensor — has already generated the discharge record that the regulator will see at the next inspection.
iFactory's water treatment analytics platform changes the information architecture of steel mill water management from reactive and lagging to continuous and predictive. Every circuit is monitored in real time. Chemistry trends are evaluated against domain-specific scaling and corrosion indices, not just raw sensor thresholds. PM is scheduled by condition, not by calendar. Compliance reports are generated automatically from sensor data, not assembled manually from log sheets. The 31% water cost reduction, 44% reduction in unplanned heat exchanger cleaning, and 100% compliance reporting accuracy at comparable deployments are the documented outcomes of replacing grab samples and paper logs with a purpose-built analytics platform. Book a Demo to see iFactory's water treatment analytics configured for your mill's specific circuit architecture and compliance obligations.
Connect Every Water Circuit in Your Steel Mill to Real-Time Analytics — From Cooling Tower Chemistry to ETP Discharge Compliance.
iFactory's water treatment analytics platform monitors chemistry, schedules condition-based PM, tracks water consumption per ton of steel, and auto-generates environmental compliance reports — so your water program runs on sensor data and domain logic, not grab samples and paper logs.
Does iFactory's water treatment analytics platform work with existing pH, conductivity, and flow sensors already installed in our steel mill?
Yes — iFactory connects to existing sensors via Modbus, OPC-UA, 4-20mA, and HART protocols. Most steel mills have significant existing instrumentation that integrates without hardware replacement, reducing deployment cost and timeline.
How does iFactory handle the compliance reporting requirements for NPDES discharge permits and Legionella cooling tower programs?
Pre-configured report templates for NPDES DMRs and OSHA Legionella control programs auto-populate from sensor records and inspection data. Reports are archived with full data provenance for regulatory audit.
Can iFactory monitor ZLD evaporator and crystallizer performance for steel mills with zero liquid discharge requirements?
Yes — ZLD system monitoring includes concentrate TDS trending, evaporation rate performance, scaling indicator tracking, and condition-based PM for evaporator cleaning. Unplanned evaporator shutdowns are reduced by early scaling detection.
What is the typical deployment timeline and investment for iFactory water treatment analytics at a U.S. integrated steel mill?
Deployment runs 6 to 10 weeks at $38,000 to $95,000 covering sensor integration, chemistry index configuration, PM template setup, CMMS integration, and compliance report configuration. Most mills achieve full deployment within 90 days.
Does iFactory integrate with SAP PM, IBM Maximo, or other CMMS platforms for water treatment work order management?
Yes — iFactory integrates via REST API and SAP RFC/BAPI calls. Work orders generated from water treatment condition-based PM triggers flow directly into SAP PM, Maximo, or Infor EAM pre-populated with asset ID, deviation data, and recommended action.