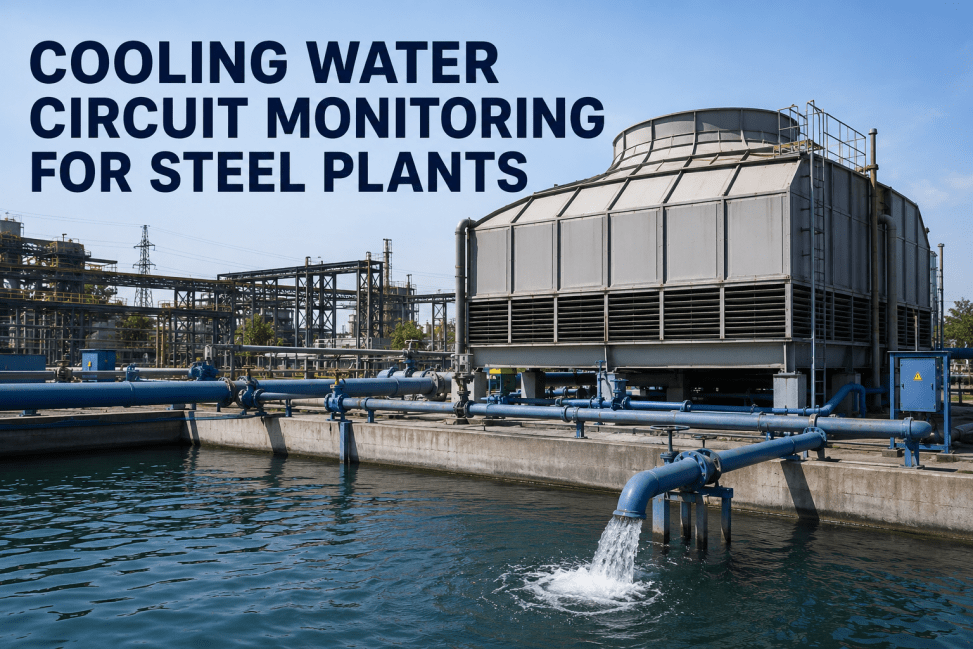
July hits and suddenly the cooling tower that handled winter production without complaint can't pull enough approach temperature to keep up with hot blast demand. Maintenance teams scramble to figure out whether it's fouled fill, a slipping fan belt, or just ambient wet-bulb doing what ambient wet-bulb does in summer, and by the time anyone traces the real cause the plant has already throttled output for a week. Cooling towers are one of the few assets in a steel plant where the equipment itself rarely changes but its performance swings by season, load, and fill condition in ways that a fixed maintenance calendar can't track. iFactory built thermal performance monitoring specifically for that gap, and maintenance managers can walk through it directly at this booking link.
Your Cooling Tower Is Losing Capacity Long Before Anyone Notices
AI thermal performance tracking, fill condition assessment, and fan health monitoring catch capacity loss while there's still time to fix it before summer peak demand hits.
The Three Numbers That Actually Tell You a Tower Is Failing
Cooling tower performance conversations tend to focus on outlet temperature alone, but that single number is affected by ambient conditions and tells you almost nothing about the tower's own condition. These three metrics, tracked together, separate a weather problem from a maintenance problem.
Approach temperature
The gap between cold water outlet temperature and ambient wet-bulb temperature. A widening approach over weeks, independent of weather, points directly at fill fouling or airflow loss rather than ambient conditions.
Range efficiency
The difference between hot water inlet and cold water outlet temperature relative to design range. A shrinking range under constant load signals reduced heat rejection capacity in the fill or distribution system.
Fan power draw per airflow unit
Rising motor amperage without a corresponding increase in measured airflow usually means belt slip, bearing drag, or blade fouling reducing mechanical efficiency well before a fan failure would show up on a vibration check.
See Where Your Towers Stand Before Peak Season Hits
A short scoping call reviews your current tower fleet against summer demand projections and flags which units are running closest to their capacity limit right now.
Fill Condition Assessment Reference
Fill degradation follows a fairly predictable pattern in most steel plant cooling towers exposed to particulate-heavy air. This reference table shows how each stage of fouling shows up in the performance data before a visual inspection would confirm it.
Summer Readiness Checklist for Cooling Towers
Baseline approach and range efficiency documented for every tower cell under known load conditions
Fan motor amperage and belt condition inspected on a schedule tied to actual runtime hours, not calendar months
Fill inspection or cleaning completed at least 60 days before projected peak wet-bulb season
Redundant tower capacity mapped so a single-unit failure during peak demand doesn't force a production throttle
A Maintenance Manager's Summer Before and After
Before
Cell 3 lost enough capacity from fill fouling that the plant had to reduce hot blast temperature for four days during peak July demand, discovered only after production questioned why furnace performance was dropping.
After
Approach temperature drift on Cell 3 was flagged three weeks before peak season, cleaning was scheduled into an existing planned outage window, and full capacity was confirmed before the first heat wave arrived.
Frequently Asked Questions
How is this different from the vibration monitoring we already have on our fan motors?
Vibration monitoring is valuable for catching mechanical fan problems like bearing wear, but it tells you nothing about fill condition, water distribution issues, or heat rejection efficiency. This platform adds thermal performance tracking alongside your existing mechanical monitoring so you get a complete picture of both the mechanical and thermal health of each tower cell, rather than just one half of the story.
Do we need new sensors on every tower cell?
Most towers already have hot and cold water temperature sensors as part of basic instrumentation, and the main addition is typically a wet-bulb ambient sensor and fan amperage monitoring if not already present. Talk to support about auditing your current instrumentation before assuming new hardware is required on every cell.
Can this predict how much capacity we'll have during a specific summer heat wave?
Once baseline performance data has been collected across a range of ambient conditions, the model can project expected approach temperature and cooling capacity at forecasted wet-bulb conditions, which is particularly useful for planning production schedules around known heat events. This projection improves in accuracy as more seasonal cycles of data accumulate.
What's a realistic timeline to see value from this before next summer?
A typical rollout installs sensors and establishes baseline data over four to six weeks, giving several months of lead time before peak season if started in late winter or early spring. Book a demo now to make sure a full baseline cycle is captured before your next high-demand period.
Does this work for both mechanical draft and natural draft towers?
Yes, though the specific parameters tracked differ somewhat between the two designs since natural draft towers don't have fan power draw as a diagnostic input. The core approach temperature and range efficiency tracking applies to both tower types, with fan-specific diagnostics added for mechanical draft installations where applicable.
Don't Wait for the First Heat Wave to Find Out Your Towers Are Behind
Book a 30-minute call and bring your tower fleet layout. iFactory will walk through which cells are most at risk of falling short this summer.