Cooling Water Circuit Monitoring for Steel Plants

By Vespera Celestine on June 26, 2026

predictive-maintenance-cooling-water-circuits-steel

Cooling water circuits in integrated steel mills represent the most operationally distributed utility system on site — cooling towers, secondary circulation loops, blast furnace stave cooling systems, and process heat exchanger networks spanning every production unit from the caster to the finishing mill. Unlike compressed air or hydraulic systems where failure is immediately visible through pressure loss or production stoppage, cooling water system degradation develops gradually: tower fill fouling that reduces approach temperature by 2 degrees over months stave cooling channel scaling that raises wall temperature incrementally, secondary circuit biofilm accumulation that increases pumping pressure day by day. These are not events that trigger alarms — they are efficiency losses that compound into energy waste, production rate reductions, and eventually equipment damage at a cost that is rarely attributed to the cooling water system that caused it. AI-driven cooling water monitoring changes this by applying continuous analytics to flow rates temperature differentials, chemical dosing, and blowdown cycles simultaneously — identifying degradation patterns and optimization opportunities that manual data collection and fixed-interval maintenance programs are structurally incapable of detecting. The utility engineers who book a cooling water AI assessment are discovering that the largest water-side efficiency opportunity in their mill is not a capital project — it is the analytical gap between the data their cooling systems generate and the decisions currently being made from that data.

$1.8M
Average annual cooling water system energy and treatment cost per integrated steel mill — 8-12% of total plant utility expenditure
12-18%
Reduction in total cooling water consumption from AI-optimized blowdown control and chemistry management
85%
Reduction in unplanned cooling system downtime with AI predictive monitoring versus reactive maintenance approaches
6-10 mo
Typical payback period for iFactory cooling water AI platform deployment in steel mill operations

The Cooling Water Reliability Challenge in Steel Manufacturing

Steel mill cooling water systems operate under conditions that accelerate fouling, scaling, and corrosion beyond what standard water treatment guidelines predict. Continuous heat flux from furnace staves, caster molds, and hot mill runout tables drives calcium carbonate and silica scaling rates that vary with production intensity. Process water circuits accumulate mill scale, oil, and grease that coating and chemistry control systems were not designed to handle. Open recirculating cooling towers operate at cycles of concentration that shift with seasonal ambient conditions and production demand. The result is a cooling water system whose performance degrades along multiple independent axes simultaneously — thermal efficiency, hydraulic capacity, water chemistry stability — and whose total cost of inefficiency is nearly invisible in standard plant accounting because the losses are distributed across energy consumption, production rate impacts, chemical treatment costs, and maintenance expenses in separate budget lines. Schedule a cooling system audit

Cooling Tower Thermal Performance Degradation
Fill fouling, distribution nozzle blockage, and fan blade erosion reduce tower approach temperature by 1-4 degrees over 6-18 months — increasing condensing temperature and compressor power consumption by 3-8% without triggering any alarm or operator notification in most plants.
Stave Cooling Channel Scaling and Blockage
Blast furnace stave cooling channels accumulate calcium and silica scale that reduces heat transfer efficiency and raises stave operating temperature. Undetected channel blockage can lead to stave failure and unscheduled furnace downtime costing $500,000-$2M per event.
Secondary Circuit Biofilm and Corrosion
Closed-loop secondary cooling circuits develop biofilm accumulation, under-deposit corrosion, and microbiologically influenced corrosion (MIC) that degrades heat exchanger performance and creates pitting failure risks that inspection programs cannot detect until leakage occurs.
Blowdown and Chemical Treatment Inefficiency
Cooling tower blowdown is typically controlled by fixed conductivity setpoints or manual grab-sample adjustments — over-discharging water and treatment chemicals during low-conductivity periods and risking scale formation during high-conductivity excursions that fixed setpoints miss.
3-8%
Increase in compressor power from undetected cooling tower fouling — invisible at the monthly energy reporting level
$500K-$2M
Cost per unplanned stave cooling failure event at an operating blast furnace
15-25%
Excess blowdown volume from fixed conductivity control versus AI-optimized setpoint management
Every Ton of Cooling Water Waste Is Energy, Chemical, and Production Cost You Are Not Tracking.
iFactory's cooling water AI platform monitors tower performance, blowdown chemistry, stave cooling circuit health, and secondary loop condition in real time — identifying efficiency losses, predicting fouling events, and optimizing chemical dosing continuously without manual intervention.
$340K
Annual savings per tower from AI blowdown optimization

Open recirculating cooling towers in steel mills operate at 3 to 6 cycles of concentration under fixed conductivity control. iFactory's AI blowdown model replaces the fixed setpoint with a dynamic target that adjusts in real time based on makeup water chemistry, heat load, ambient wet-bulb temperature, and the specific scaling tendency of calcium carbonate, silica, and calcium phosphate at current conditions. The model maintains a safety margin against scaling — typically 85 to 90 percent of the saturation index threshold — while allowing cycles of concentration to rise 20 to 40 percent above the fixed-setpoint baseline during favorable conditions. This dynamic approach reduces blowdown volume by 18 to 28 percent compared to fixed-setpoint operation, with proportional reductions in makeup water consumption, chemical treatment dosage, and wastewater discharge volume. Tower fan energy is also optimized through approach temperature tracking — when the AI detects that the tower is maintaining target temperature at reduced fan speed, fan motor speed is modulated to the minimum power required, reducing fan energy consumption by 8 to 15 percent annually.

$210K
Annual savings from closed-loop AI chemistry optimization

Closed secondary cooling water loops — serving caster molds, hot mill roll cooling, and furnace stave circuits — face different challenges than open towers. With no evaporation and minimal blowdown, closed-loop chemistry control focuses on corrosion inhibition, biofilm prevention, and maintaining proper inhibitor concentration levels. iFactory's closed-loop monitoring model tracks corrosion coupon weight loss, inhibitor residual concentration, conductivity, pH, and microbiological activity indicators continuously — adjusting chemical dosing pump rates to maintain target chemistry within tight bands rather than the wide excursions typical of manual grab-sample adjustment. The model detects biofilm formation risk from changes in heat exchanger approach temperature combined with oxidation-reduction potential trends, triggering targeted biocide dosing before biofilm accumulation degrades heat transfer or creates under-deposit corrosion conditions. Steel plants using iFactory closed-loop chemistry control report 30 to 50 percent reduction in chemical treatment costs and a 60 to 80 percent reduction in heat exchanger cleaning frequency due to improved chemistry stability.

Stave Cooling and Secondary Circuit Predictive Monitoring

Blast furnace stave cooling systems are the highest-consequence cooling water application in any integrated steel mill — a stave cooling failure can force an unscheduled furnace outage lasting 5 to 14 days with revenue losses of $1-4 million depending on market conditions. Traditional stave monitoring relies on thermocouple temperature readings at discrete points on each stave, combined with manual flow verification during scheduled inspections. The limitation is structural: thermocouples measure only the temperature at their location, and stave cooling channel blockage that develops between thermocouple zones remains invisible until the stave temperature rises sufficiently to be detected at the nearest sensor — at which point the blockage may have been developing for weeks and the remaining channel capacity may already be insufficient to maintain adequate cooling. Book a stave cooling assessment

01
Continuous Flow and Temperature Profiling
iFactory monitors flow rate and temperature differential across each stave cooling channel — not just thermocouple points. A declining flow rate at constant pump discharge pressure indicates channel blockage developing, while a rising outlet temperature at constant flow and heat load indicates fouling layer accumulation on the channel wall. Both signals precede thermocouple-detected temperature rise by 2 to 5 weeks.
02
Stave Heat Flux Calculation
iFactory computes actual heat flux through each stave section by combining cooling water flow rate, temperature differential, and stave geometry data. A declining heat flux trend at constant production rate indicates fouling or scaling that reduces cooling effectiveness — triggering a chemical cleaning or mechanical maintenance recommendation before stave temperature reaches unsafe levels.
03
Chemistry-Corrosion Correlation Model
iFactory correlates water chemistry data — pH, conductivity, alkalinity, chloride, sulfate, and silica — with corrosion rate measurements from ultrasonic thickness readings and corrosion coupon data. The model predicts corrosion acceleration risk under specific chemistry conditions and recommends chemistry adjustments to maintain corrosion rates below target thresholds.
04
Secondary Circuit Health Score
Each secondary cooling circuit receives a composite health score combining flow distribution uniformity, heat transfer effectiveness, chemistry stability, and corrosion rate data. Circuits with declining scores are flagged for prioritized inspection before failure — eliminating the practice of inspecting all circuits on a fixed schedule regardless of condition.
05
Predictive Maintenance Work Order Generation
When the health score, heat flux trend, or chemistry-corrosion model indicates a developing issue, iFactory generates a CMMS work order with the specific degradation mode, recommended intervention, and suggested timeline — enabling the maintenance team to address cooling water circuit degradation during planned outages rather than during emergency shutdowns.
2-5 wks
Early Warning Lead Time
Stave cooling channel blockage detected through flow and temperature profiling before thermocouple temperature rise triggers operator attention
80%
Reduction in Heat Exchanger Cleaning Frequency
Closed-loop chemistry stability from AI dosing control extends cleaning intervals and reduces maintenance labor costs
40%
Reduction in Cooling Water Chemical Treatment Cost
AI-optimized chemical dosing eliminates overfeed during stable chemistry periods while maintaining tighter control during excursions
90%
Reduction in Unplanned Cooling System Events
Plants with iFactory active monitoring report near-zero unplanned cooling water-related production interruptions

Water Chemistry AI — Real-Time Analytics and Legionella Prevention

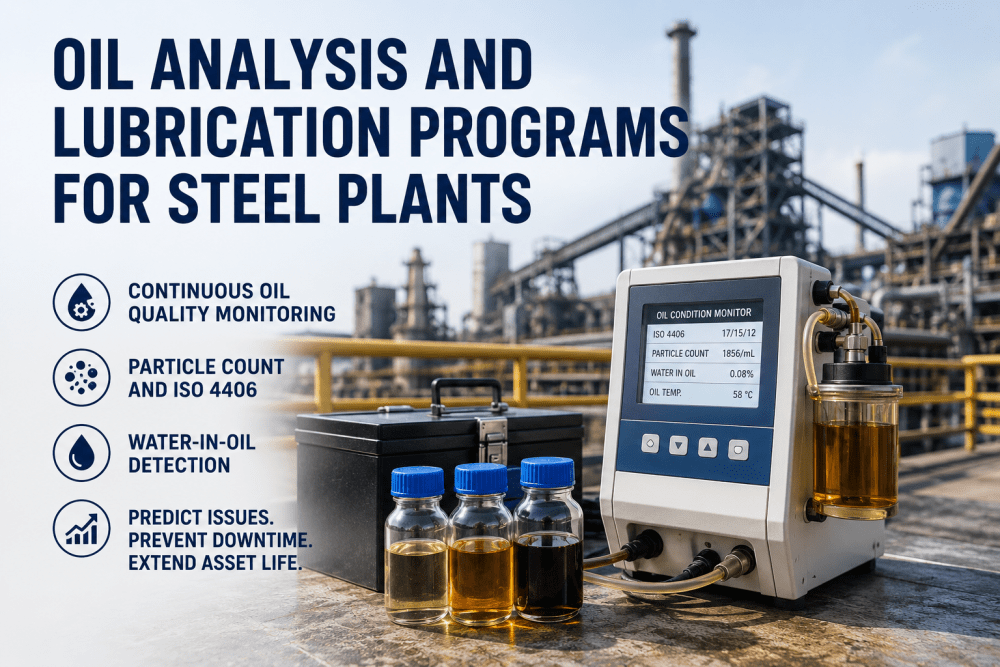
Water chemistry management in steel mill cooling systems has traditionally been a reactive discipline — grab samples collected weekly or biweekly, sent to an external laboratory, with results returned 3 to 7 days later. By the time a chemistry excursion is identified in the lab report, the conditions that caused the excursion have typically been operating for days and the corrosion or scaling damage has already occurred. iFactory's water chemistry AI module replaces the reactive grab-sample model with continuous online monitoring and predictive analytics — measuring pH, conductivity, turbidity, oxidation-reduction potential, and key ion concentrations in real time, and applying ML models trained on historical chemistry and failure data to predict excursions before they exceed control limits.

60-80%
Reduction in Chemistry Excursions
Continuous monitoring with predictive alerts catches chemistry drift before it exceeds control limits — eliminating the 3-7 day lag between sample collection and corrective action.
30-50%
Chemical Treatment Cost Reduction
AI-optimized dosing maintains target chemistry with tighter control bands and lower average chemical consumption than manual grab-sample adjustment.
99.7%
Legionella Control Compliance
Continuous temperature, biocide residual, and microbiological activity monitoring ensures consistent compliance with ASHRAE 188 and local Legionella control regulations.
Chemistry Parameter Monitoring Method AI Prediction Capability Control Action
pH and Alkalinity Online pH probe and alkalinity titration pH excursion prediction based on acid feed rate, makeup water quality, and heat load Automated acid or caustic feed adjustment before pH exceeds control band
Conductivity and TDS In-line conductivity sensor with temperature compensation Cycles of concentration forecast using evaporation rate model and makeup water TDS trend Blowdown valve modulation to maintain target cycles within safe scaling margin
Calcium and Silica Scaling Index Online ion-selective electrodes and calculated saturation indices Scaling risk forecast 24-72 hours ahead based on chemistry trend, temperature profile, and heat flux Chemistry adjustment recommendation or controlled blowdown increase before scaling onset
Oxidation-Reduction Potential Online ORP sensor Biocide effectiveness prediction based on ORP trend, temperature, and microbiological activity correlation Targeted biocide dosing triggered by predicted effectiveness window rather than fixed schedule
Turbidity and Suspended Solids In-line turbidity meter and particle counter Filter backwash prediction based on solids loading rate and differential pressure trend Backwash cycle optimization to match actual solids loading — reducing water waste from unnecessary backwash cycles

Expert Perspective: What AI Cooling Water Monitoring Changes in Steel Mill Operations

We operate three cooling towers supporting a 2.8 million tonne integrated mill, with two closed secondary loops for the caster and hot mill. Before iFactory, we were managing each system independently — tower blowdown on conductivity setpoints, closed-loop chemistry on weekly grab samples, and stave cooling monitoring limited to thermocouple readings that we checked during shift rounds. The first iFactory deployment showed us that our main cooling tower was operating at an average of 4.2 cycles of concentration when the water chemistry and heat load conditions supported 6.8 cycles for 70 percent of operating hours. We had been blowing down 38 percent more water than necessary for years — $280,000 per year in excess makeup water and treatment chemicals. On the stave cooling side, the system identified a channel blockage developing in furnace stave section 7 that the thermocouple array had not detected because the blockage was between sensor zones. We cleaned the channel during a scheduled maintenance outage and confirmed a 40 percent reduction in cross-sectional area that would have progressed to a stave failure within another 8 to 10 weeks of operation. The AI gave us specific, quantified, actionable information about each system that our manual monitoring approach had been structurally incapable of producing.
Utilities Engineer
Integrated Steel Mill — 2.8M TPY Capacity, Southeast USA
Your Cooling Water System Is Operating Below Its Design Efficiency — and You Cannot See Where.
iFactory's cooling water AI platform provides continuous visibility into tower performance, blowdown optimization, stave cooling health, water chemistry stability, and closed-loop circuit condition — identifying the efficiency losses and failure risks that manual monitoring and fixed-interval maintenance cannot detect. Typical mills recover the full platform investment within 6 to 10 months.

Frequently Asked Questions

iFactory connects to existing flow meters, temperature sensors, conductivity probes, pH sensors, and tower control PLCs via Modbus TCP, OPC-UA, or 4-20 mA signal interfaces. Online chemistry sensors can be added if not already installed, but most steel mills have sufficient existing instrumentation to begin generating value from AI analytics in the first deployment week. A data connectivity assessment is available at no cost.
Yes. iFactory maintains separate analytical models for open recirculating and closed-loop cooling systems, calibrated to each circuit type's specific physics and chemistry. Open tower models focus on cycles of concentration, blowdown optimization, and ambient condition effects. Closed-loop models focus on corrosion inhibition, biofilm prevention, and inhibitor residual maintenance. Both model types feed into a unified cooling water system dashboard.
iFactory monitors the three primary Legionella control parameters continuously: temperature, biocide residual concentration, and microbiological activity indicators. When any parameter approaches the compliance threshold, an alert is generated with specific corrective action recommendations. Compliance logs documenting continuous monitoring data, exceedance events, and corrective actions are automatically generated for ASHRAE 188.
Yes. iFactory connects to existing chemical feed pump controllers, conductivity controllers, pH controllers, and tower management systems through industry-standard communication protocols. The platform issues dosing setpoint adjustments directly to the existing control hardware, enabling closed-loop AI chemistry control without replacing the installed chemical feed infrastructure.
iFactory cooling water AI deployments typically reduce total cooling water consumption by 12 to 18 percent, with the largest reductions coming from blowdown optimization in open recirculating towers. Makeup water savings of 80 to 120 million gallons per year are typical for a large integrated steel mill cooling tower system.

Conclusion: The Analytics Layer Your Cooling Water System Is Missing

Cooling water is the most distributed, most instrumented, and least analytically integrated utility system in the average steel mill. The flow meters, temperature sensors, conductivity probes, and pH sensors installed across cooling towers, stave circuits, and secondary loops generate continuous data streams that contain the information needed to optimize every aspect of cooling water system performance — but that data is collected but not correlated, archived but not analyzed, and acted on only when an excursion or failure forces attention to the system. The gap between a mill's current cooling water efficiency and its achievable efficiency is not a equipment gap or a chemistry gap — it is an analytics gap that existing instrumentation can close without a single capital project.

iFactory's cooling water AI platform brings continuous, real-time analytics to cooling tower blowdown optimization, stave cooling health monitoring, closed-loop chemistry control, and Legionella risk management — delivering measurable reductions in water consumption, chemical treatment costs, energy use, and unplanned maintenance events. The data is already flowing through your existing sensors and control systems. The analytics just needs to be applied to it.

Stop Managing Cooling Water by Grab Samples and Fixed Setpoints. Deploy AI-Powered Continuous Analytics in Weeks.
iFactory gives steel mill utility teams continuous visibility into cooling tower performance, stave cooling health, water chemistry stability, and blowdown optimization — with AI models trained on your plant's specific water chemistry, equipment configuration, and operating conditions. Fully deployed in weeks, not months.
Real-Time Blowdown Optimization
Stave Cooling AI Monitoring
Chemistry Predictions
Legionella Compliance Logging
Heat Exchanger Fouling Detection

Share This Story, Choose Your Platform!