Blast Furnace Cooling System — Plate Cooler, Stave & Water Circuit AI Leak Detection

By James Smith on July 16, 2026

blast-furnace-cooling-plate-stave-water-circuit-ai

A blast furnace cooling system rarely fails all at once. Copper staves and plate coolers degrade gradually through water-side fouling, thermal fatigue cracking, and slow flow reduction — and by the time a leak is confirmed visually or a shell hot spot appears on thermal imaging, the furnace may already be facing an emergency water shutoff decision mid-campaign. iFactory's Cooling System AI continuously analyzes water circuit flow, temperature differential, and pressure data across every plate cooler, stave, and cooling zone to catch leak precursors and flow degradation weeks before they become shell integrity events. Book a demo to see live cooling circuit analytics running on an operating furnace.

92%
Water leaks identified before visual confirmation or shell hot spot detection
5–8 wks
Typical advance warning gained on stave and plate cooler flow degradation
$1.1M
Median annual value from avoided emergency shell repairs and unplanned outages
100%
Cooling zone coverage across staves, plate coolers, and tuyere cooling circuits
A Cooling Water Leak Reaching the Furnace Shell Is Not a Maintenance Problem — It's a Safety Event
iFactory tracks flow, temperature differential, and pressure across every cooling zone simultaneously, flagging the specific staves and plate coolers trending toward failure before water finds its way somewhere it shouldn't be.

How Cooling System Failures Actually Progress

Copper stave and plate cooler failures follow a recognizable progression long before they become visible leaks. Understanding this progression is what allows early intervention instead of emergency response.

1
Water-Side Fouling Begins
Scale and mineral deposits gradually reduce internal flow channel diameter, increasing local temperature differential across the cooling element.
2
Thermal Cycling Stress Accumulates
Reduced cooling efficiency increases thermal cycling amplitude on the copper element, accelerating fatigue crack initiation at weld points and channel walls.
3
Micro-Cracking Develops
Small cracks form and slowly propagate, producing minor, intermittent flow anomalies that are easy to dismiss as sensor noise on a single-point reading.
4
Flow Loss Becomes Measurable
As cracking progresses, flow and pressure differential shift in a consistent, trackable direction — the window where iFactory's model reliably flags the element.
5
Breach and Water Ingress
Without intervention, the crack breaches fully, and water reaches the furnace shell — the outcome every earlier stage was building toward.

Cooling Zone Coverage Across the Full Furnace Shell

Cooling circuits vary meaningfully by shell elevation, and failure patterns differ zone to zone. iFactory's model is built around this zonal reality rather than treating the cooling system as a single uniform circuit. See how zone-specific thresholds are configured for your furnace's cooling design.

Bosh & Belly Staves
Highest thermal load zone, where stave failures typically progress fastest and carry the greatest shell integrity risk if undetected.
Tuyere Cooling Jackets
Small cooling volume relative to thermal load makes tuyere jackets especially sensitive to even minor flow restriction.
Stack Plate Coolers
Lower thermal load but larger population of individual coolers, where the challenge is prioritizing which unit needs attention first.
Hearth Cooling Circuit
Directly tied to campaign life planning, since hearth cooling performance is a key input to erosion and refractory wear models.

iFactory vs. Manual Rounds and Single-Point Alarms

Most furnaces already have flow meters and temperature sensors on major cooling circuits. The gap is in how that data gets interpreted — element by element, alarm by alarm — rather than as a connected picture of cooling system health.

CapabilityManual Rounds & Single-Point AlarmsiFactory Cooling AI
Leak Detection TimingTypically confirmed visually or via shell hot spot, often after water has already reached the shell.Flags flow and pressure degradation 5–8 weeks ahead of typical breach points on average.
Element-Level PrioritizationRequires manual review of individual sensor trends across potentially hundreds of cooling elements.Automatically ranks elements by degradation severity across the entire cooling circuit.
False Alarm RateSingle-point thresholds generate noise from normal operating fluctuation, eroding trust over time.Multi-signal correlation reduces false positives by filtering normal variation from genuine degradation trends.
Shell Integrity RiskWater ingress events carry safety and unplanned outage risk that manual detection cannot reliably prevent.Early warning window allows planned isolation and repair before shell integrity is threatened.
Campaign Life InputCooling performance data rarely feeds systematically into hearth erosion or campaign planning models.Hearth cooling trends feed directly into campaign life and reline planning models.
Know Which Stave or Plate Cooler Needs Attention Before It Becomes an Emergency
Get element-level prioritization across your entire cooling circuit, built from the flow and temperature instrumentation you already have installed.

Why Maintenance Managers Miss Slow Cooling Degradation

A blast furnace cooling system can include hundreds of individual staves and plate coolers, each with its own flow and temperature reading. Reviewing every element manually against historical baseline on every shift is not realistic for any maintenance team, which is why most cooling system monitoring defaults to simple threshold alarms on the most critical zones only.

That default leaves a large population of elements essentially unmonitored in any meaningful sense — technically instrumented, but not actively reviewed for the slow drift that precedes most failures. A plate cooler in a lower-thermal-load zone might show a gradual flow reduction for months without crossing any alarm threshold, simply because the threshold was set conservatively enough to avoid nuisance alerts. By the time that same element does cross a threshold, the underlying crack may already be well advanced.

iFactory addresses this by applying the same correlation and trend analysis across every instrumented cooling element, not just the highest-priority zones. The output is a ranked list — which elements are degrading fastest, which are stable, and which deserve the next available maintenance window — rather than a binary alarm state that only distinguishes normal from critical.

Built to Sit Alongside Existing Cooling Water Systems and Control Rooms

iFactory does not require replacing flow meters, temperature transmitters, or the water treatment systems already protecting your cooling circuit. The platform reads from instrumentation already reporting to your DCS or historian and layers correlation analysis on top, which is why most furnaces can move from audit to live monitoring within five weeks.

Connectivity is established through standard OPC-UA and Modbus TCP protocols compatible with Honeywell, Siemens, Emerson, and Rockwell control environments, along with historian platforms like OSIsoft PI and AVEVA Historian. For control room operators, this means cooling circuit health data appears in a format consistent with what they already monitor, rather than requiring a separate system with its own login and interface to check throughout a shift.

The Difference Between Zone-Level and Element-Level Visibility

Most cooling circuit monitoring today operates at the zone level — bosh, belly, stack, hearth — because that is the practical limit of what a maintenance team can review manually across a shift. Zone-level alarms are useful for catching acute events, but they average out the condition of every element within that zone, which means one severely degrading stave can be masked by dozens of healthy neighbors reporting normal readings.

Element-level visibility changes this by evaluating each stave, plate cooler, and tuyere jacket against its own historical baseline rather than a zone average. This distinction matters most in exactly the situation that causes the most damage: a single element failing while its neighbors remain healthy. Zone-level monitoring is structurally unable to catch this pattern early, since the zone-wide average simply does not move enough to trigger a threshold alarm until the failing element's condition has progressed significantly.

Deployment Path: From Cooling Circuit Audit to Live Monitoring

Deployment follows a structured path built around your existing cooling circuit instrumentation and historical operating data.

Week 1–2
Full cooling circuit instrumentation audit — staves, plate coolers, tuyere jackets, and hearth circuit — mapped to historian tags.
Week 3–4
Element-level baseline models built against historical flow and temperature data, incorporating any known past failure events.
Week 5
Live monitoring activated with ranked element prioritization dashboard delivered to the maintenance team.
Week 6–7
Alert thresholds tuned against real-world flagged elements; CMMS work order integration finalized.

Results from Furnaces Running iFactory Cooling Analytics

The following outcomes reflect maintenance teams that deployed iFactory's cooling circuit correlation model across staves, plate coolers, and hearth cooling systems. Request the detailed case data for a cooling design comparable to yours.
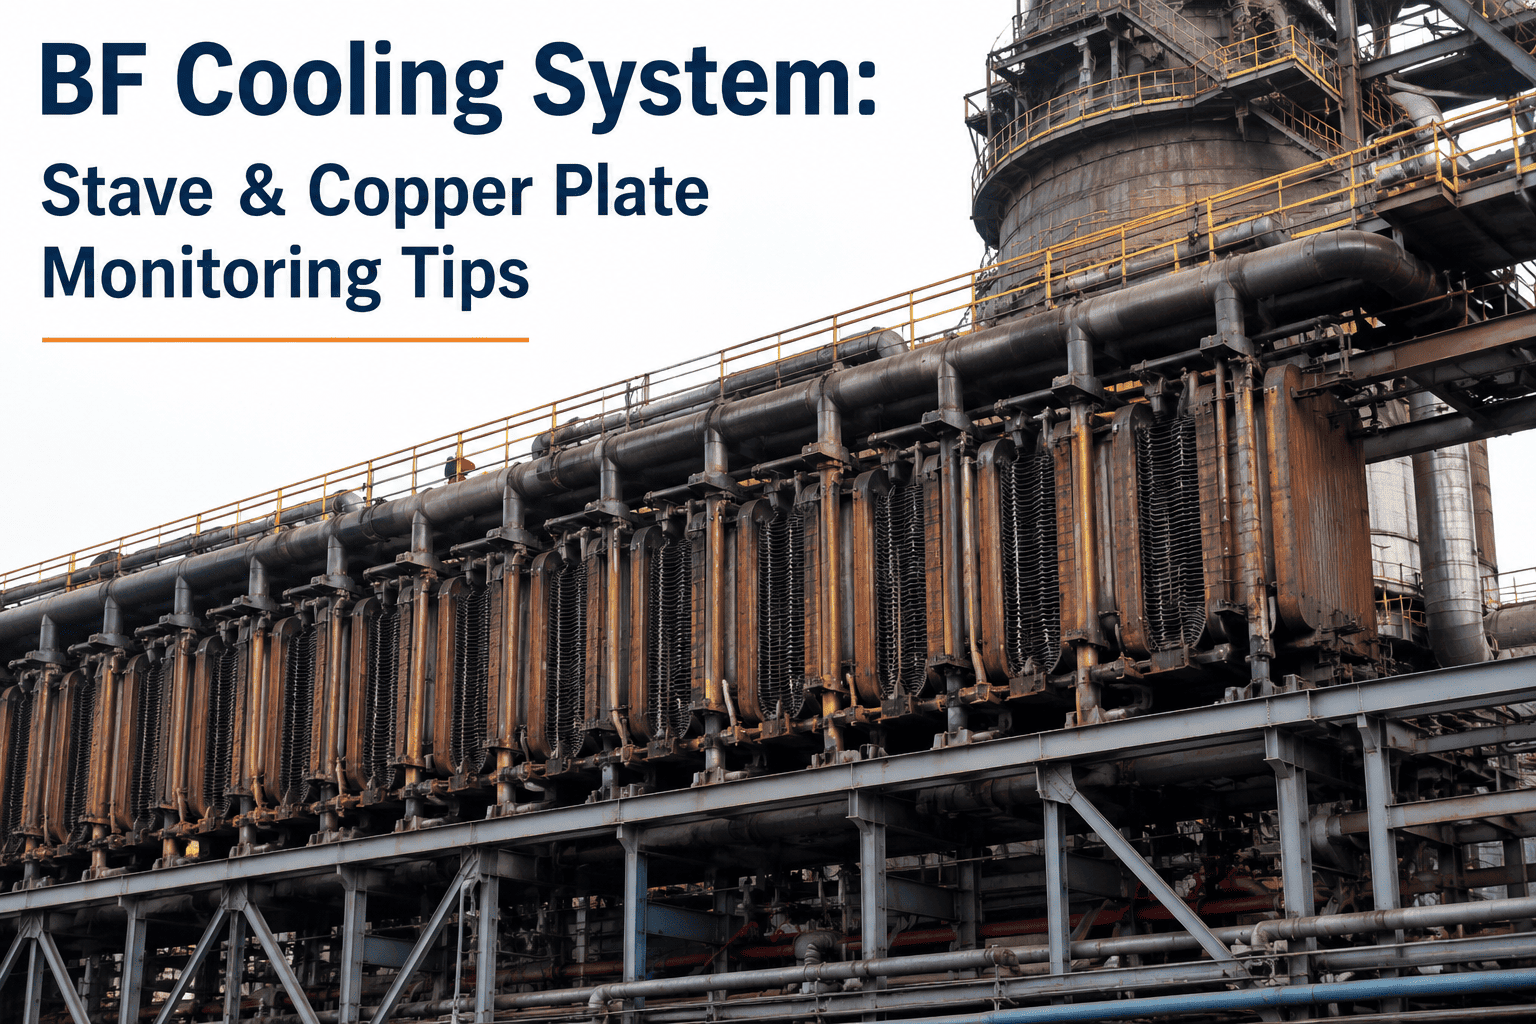
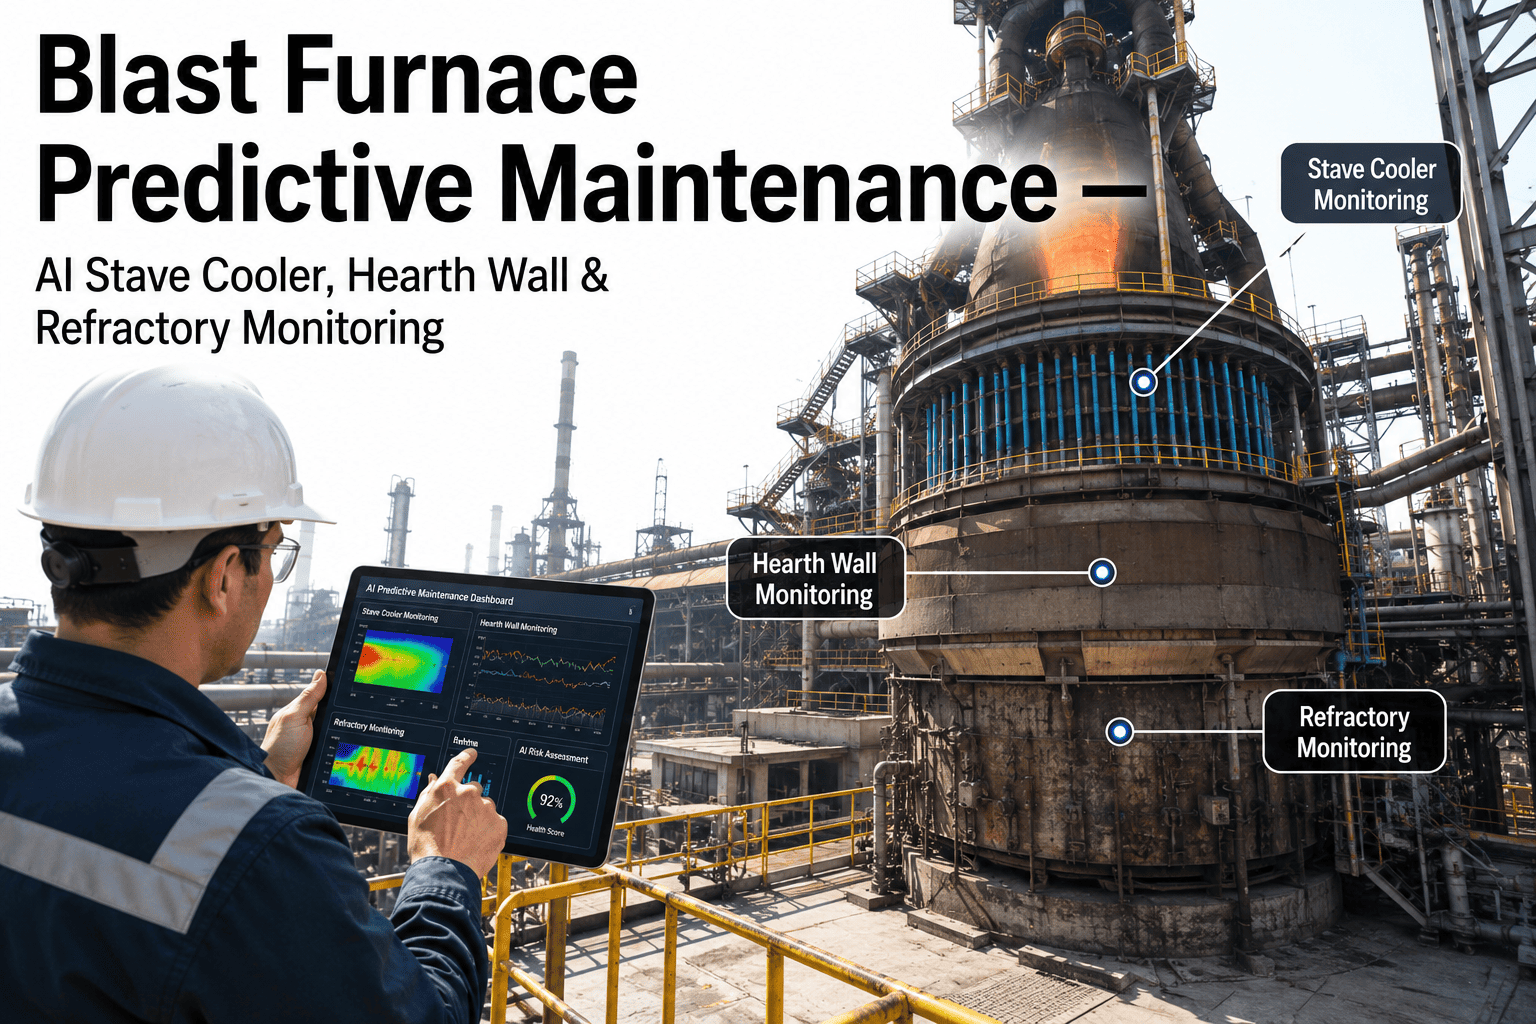
Integrated Steelworks — 3,200 m³ Furnace, Copper Stave Design
A bosh zone stave had been showing minor, intermittent flow anomalies for approximately six weeks, each individually below the alarm threshold and attributed to normal water balance fluctuation across the circuit. iFactory's correlation model flagged the consistent directional trend and ranked the stave as the highest-priority element in the circuit, allowing isolation and inspection during a scheduled maintenance window rather than an emergency shutdown.
6 wksAdvance warning before projected breach point
$950KAvoided emergency shell repair and outage cost
0Water ingress events since deployment
Mini-Mill BF Operation — 1,400 m³ Furnace, Plate Cooler Design
With over 200 individual plate coolers instrumented but reviewed only at the zone level, several lower-priority zone coolers had been degrading unnoticed for months, since zone-wide averages consistently stayed within normal range. iFactory's element-level ranking identified twelve coolers requiring near-term attention, letting the maintenance team plan a targeted replacement campaign during the next scheduled outage instead of a reactive one-at-a-time response that had previously stretched across the operating year.
12Degrading coolers identified in first ranking cycle
65%Reduction in reactive cooling maintenance events
$310KAnnual maintenance planning savings

Frequently Asked Questions

Does iFactory require new sensors on every stave and plate cooler?
In most cases, no. iFactory connects to existing flow meters and temperature instrumentation already installed on cooling circuits. Where instrumentation coverage is limited to zone-level rather than element-level sensors, the Week 1–2 audit identifies coverage gaps and recommends where additional monitoring points would add the most value.
How does the model avoid flagging normal water balance fluctuation as a false alarm?
Element-level baseline models are built against 6-12 months of your own historical flow and temperature data, learning what normal variation looks like for each specific stave or plate cooler at different burden rates and operating conditions. Multi-signal correlation across flow, temperature differential, and pressure further reduces the false positive rate compared to single-point threshold alarms.
Can this help with hearth cooling and campaign life planning specifically?
Yes. Hearth cooling circuit performance is tracked as its own zone and feeds directly into campaign life and reline planning models, since hearth cooling efficiency is a key input to erosion progression estimates. You can talk to support about how cooling data integrates with any existing campaign life model your team already uses.
What happens when an element is flagged as high priority?
A prioritized work order is generated automatically in your CMMS with the supporting trend data attached, so maintenance planners can see exactly why the element was flagged without reconstructing the analysis manually. This typically allows isolation and inspection to be scheduled into a planned maintenance window rather than requiring an unplanned response.
How much advance warning is realistic for our specific cooling design?
Furnaces running iFactory's cooling correlation model have typically gained 5 to 8 weeks of lead time on flow degradation compared to relying on visual confirmation or shell hot spot detection. The exact window depends on cooling element type, thermal load zone, and instrumentation density, which is why the historical data review in Weeks 3-4 is used to calibrate expectations for your specific furnace.
Turn Hundreds of Cooling Elements Into a Ranked, Actionable Priority List
No new hardware in most cases. No manual review of hundreds of individual sensor trends. Just a ranked view of which staves and plate coolers need attention next, before water ever reaches the shell.

Share This Story, Choose Your Platform!