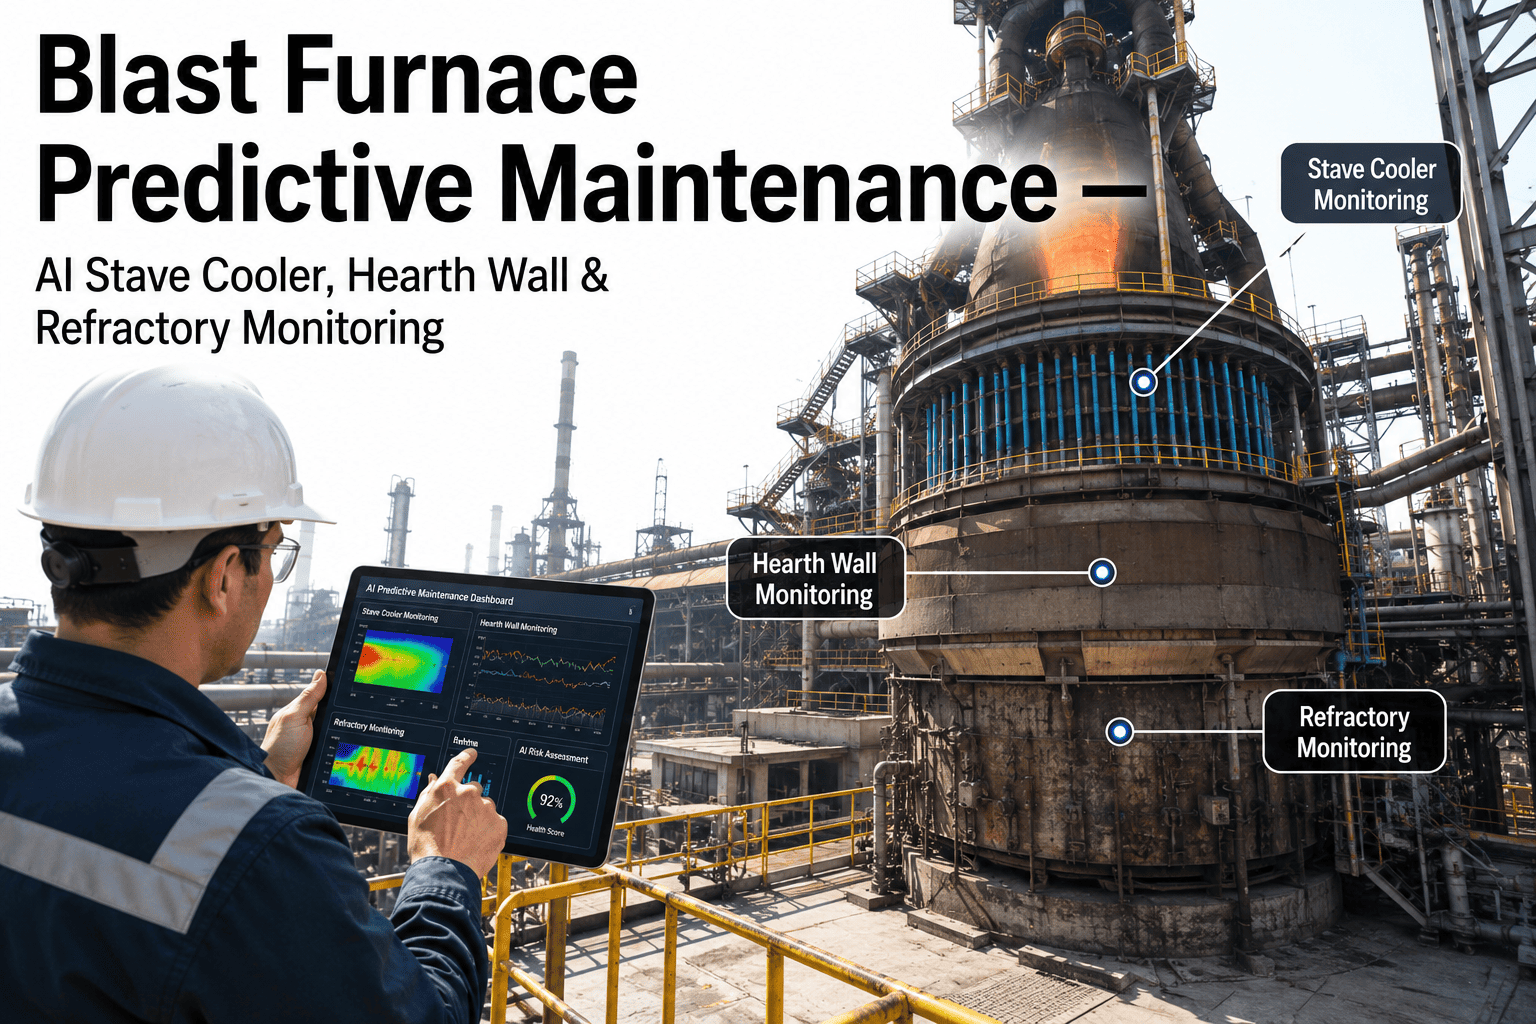
Blast Furnace Predictive Maintenance — AI Stave Cooler, Hearth Wall & Refractory Monitoring

By James Smith on July 29, 2026

blast-furnace-predictive-maintenance-ai-stave-cooler-hearth

A blast furnace is the single most capital-intensive and least forgiving asset in an integrated steel plant, running continuously for ten to twenty years between reline campaigns while converting iron ore, coke, and limestone into hot metal at temperatures exceeding 1,500 degrees Celsius. Unlike almost every other piece of plant equipment, a blast furnace cannot be shut down for inspection without enormous cost, so plant managers depend on indirect signals — stave cooler water temperatures, hearth wall thermocouples, and refractory wear models — to infer the internal condition of a vessel they can never directly see. When those signals are read manually on a delay, a slow-developing hearth erosion problem or a failing stave cooler can progress for weeks before anyone notices the pattern, by which point the remaining options are limited and expensive. AI-powered predictive analytics from iFactory continuously reads every thermocouple and cooling channel across the furnace shell to surface the early wear signatures that precede a hearth or stave failure.

Stave Cooler Health Hearth Erosion Profile Refractory Remaining Life

Blast Furnace Predictive Maintenance with AI Stave Cooler and Hearth Wall Monitoring

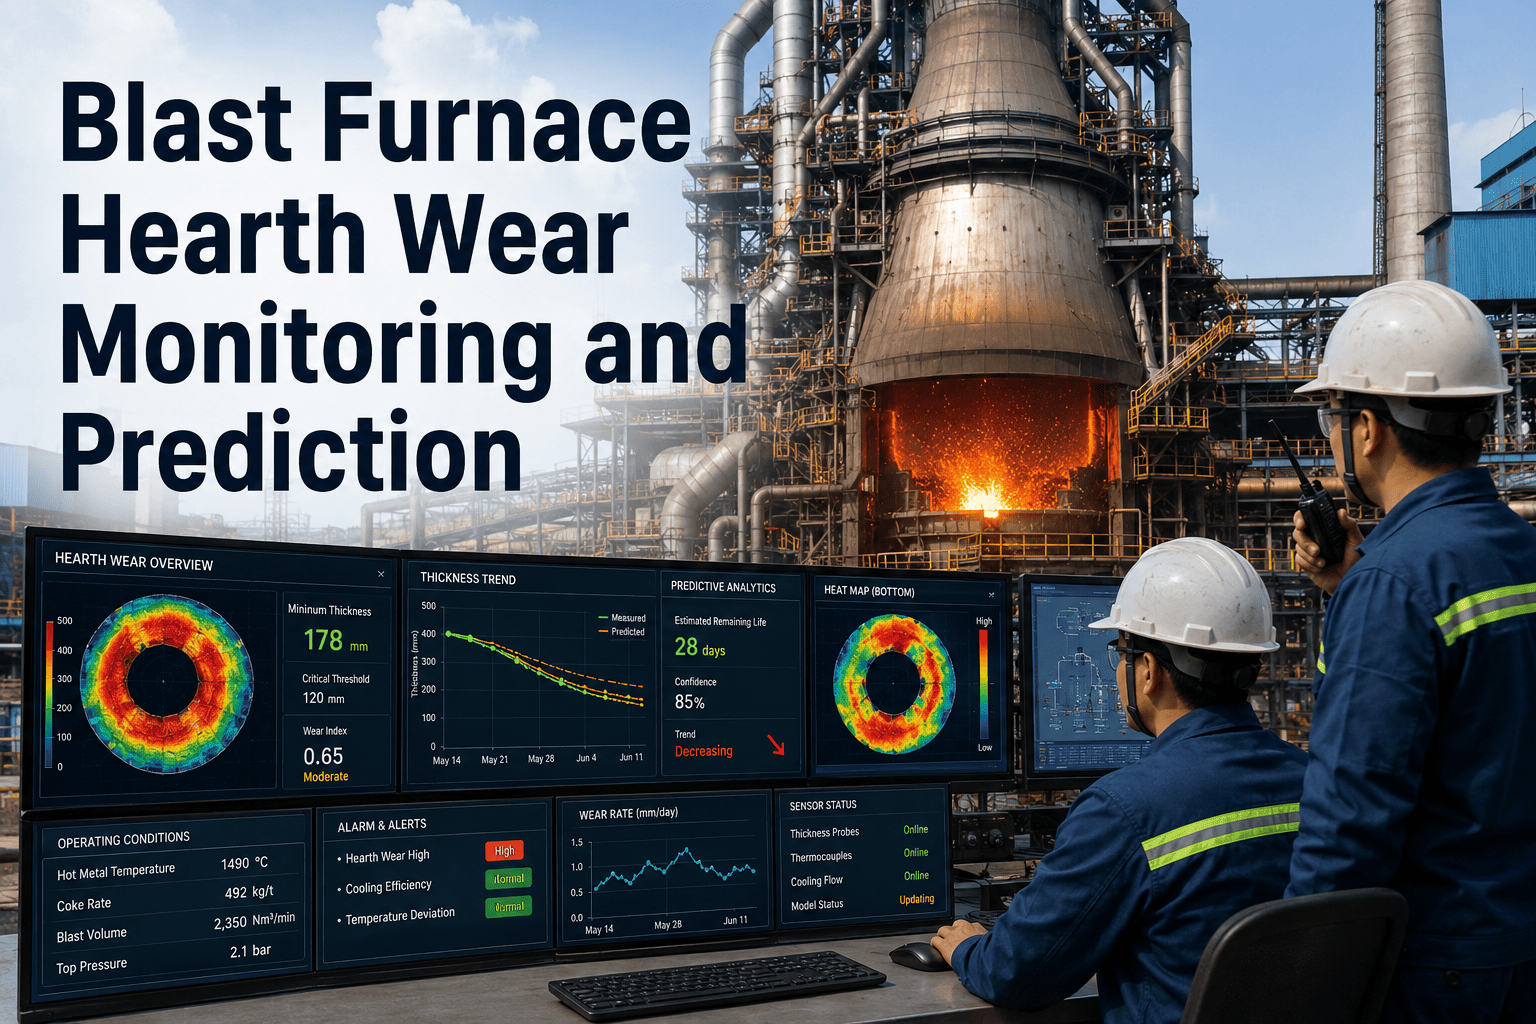
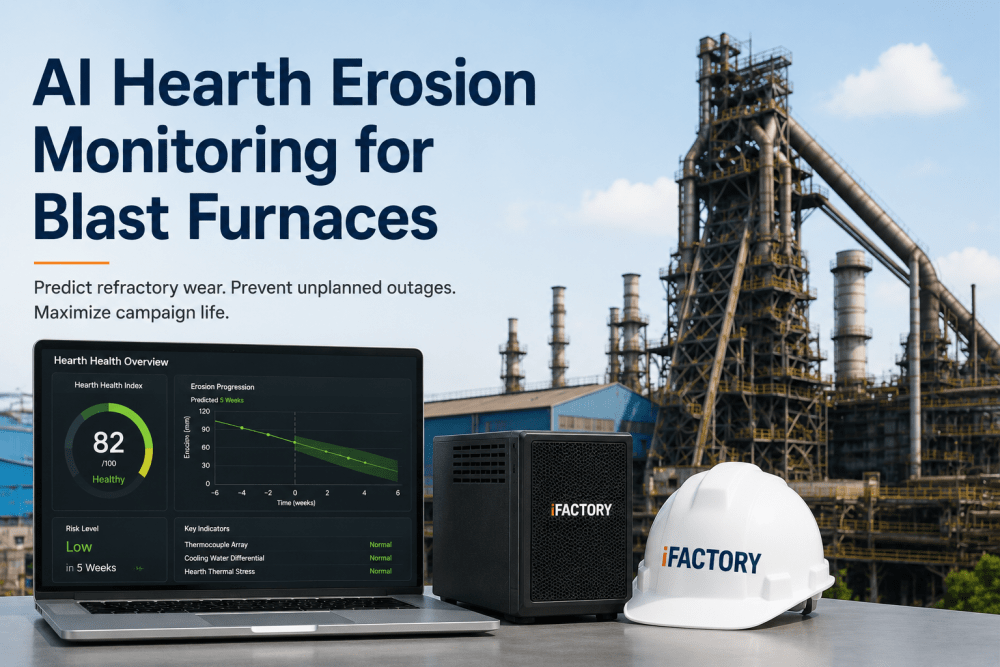
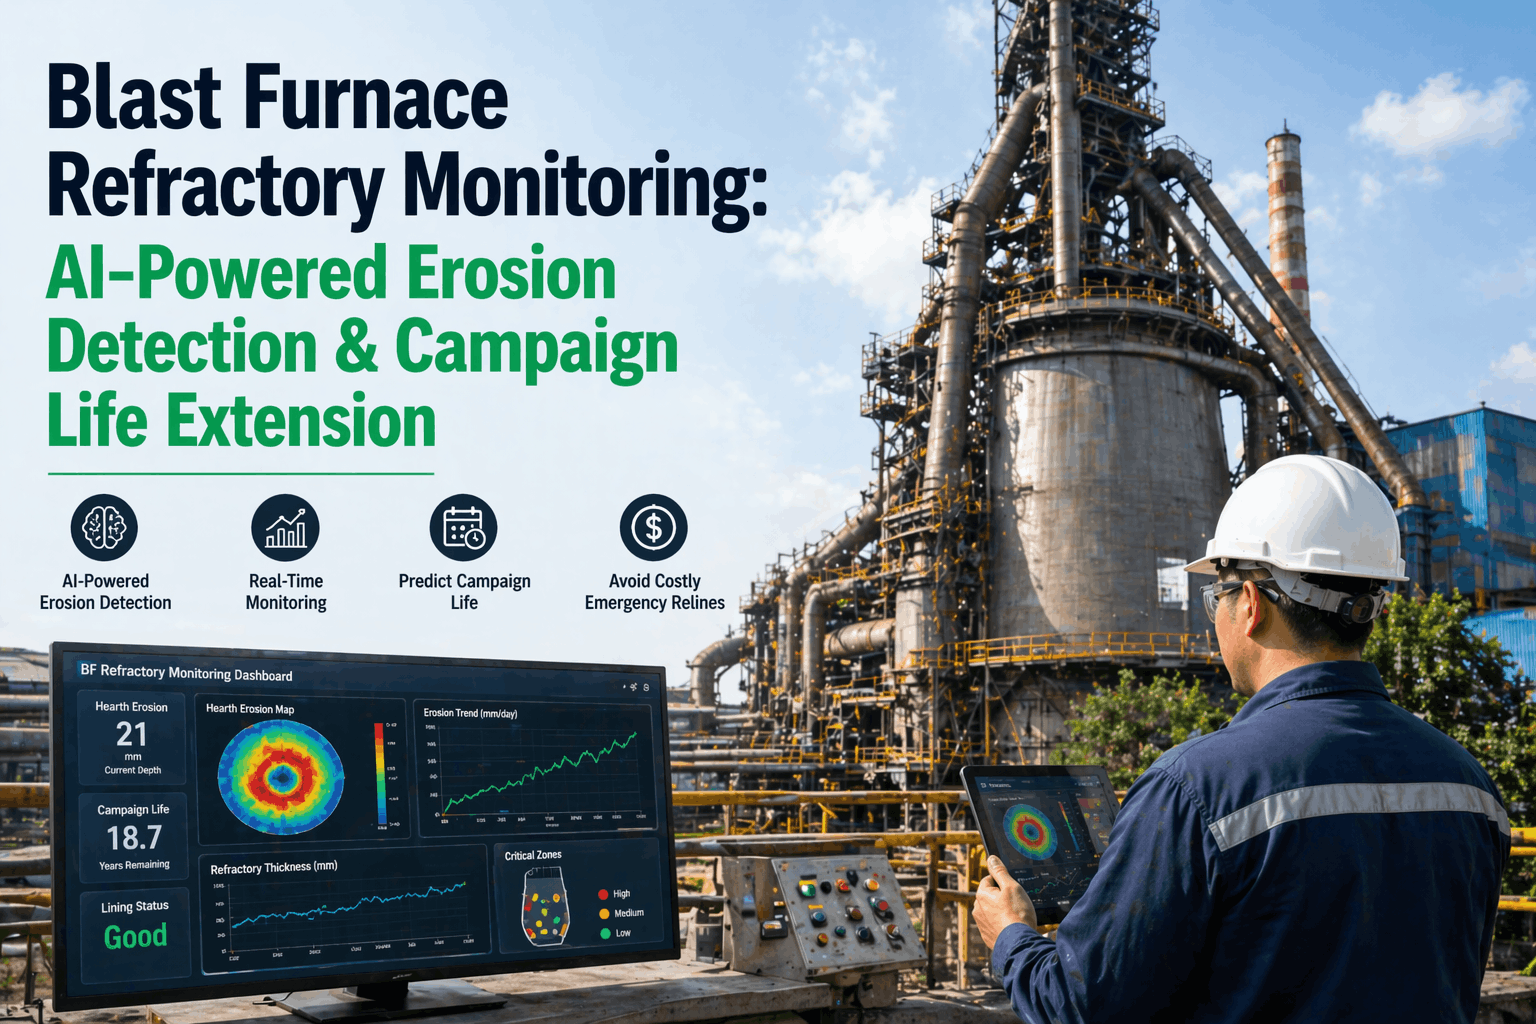
iFactory continuously analyzes thermocouple arrays, stave cooler water temperature differentials, and hearth wall heat flux data to build a live erosion and wear model of your blast furnace campaign — flagging developing weak points 30 to 90 days before they become production-limiting or safety-critical events.

10-20 Years Typical campaign length between blast furnace relines
$150M-$400M Cost of an unplanned early reline including lost production
30-90 Days Early warning window AI erosion modeling provides ahead of critical wear
18% Typical extension in usable campaign life from proactive hearth management

How Hearth Wear Progresses: The Erosion Timeline Plant Managers Rarely See Clearly

Hearth and stave wear is not a single event — it is a slow accumulation that moves through recognizable stages, each of which is visible in the data long before it becomes visible in production performance. The challenge is that each stage produces a subtle signal buried inside thousands of temperature readings taken every few minutes across hundreds of cooling elements, which is exactly the kind of pattern recognition problem that overwhelms manual review but is well suited to continuous AI analysis.

01
Refractory Thinning Begins
Normal operational wear starts reducing refractory thickness in the hearth pad and sidewall, with heat flux through the shell rising gradually as insulating brick thickness decreases across the campaign.
02
Localized Hot Spots Emerge
Uneven erosion creates localized zones where shell temperature rises faster than the surrounding area, often at the tap hole region or elephant foot zone where hot metal flow patterns concentrate wear.
03
Stave Cooler Stress Increases
Rising internal heat load pushes individual stave coolers toward their thermal limits, with water temperature differentials across the cooling circuit beginning to drift from the established baseline for that furnace zone.
04
Critical Thinning and Breakout Risk
Refractory thickness approaches the safety margin in the affected zone, with skull formation becoming unstable and the risk of a hot metal breakout through the shell rising sharply without corrective action.

Monitoring Every Critical Zone of the Furnace Shell

A blast furnace shell is not uniform in wear risk — the tap hole area, the bosh, the belly, and the hearth pad each experience different mechanical and thermal stresses over a campaign. Effective predictive maintenance requires a model calibrated to each zone rather than a single furnace-wide average, because a zone with historically higher wear rates needs a tighter alert threshold than a zone that has remained stable for years.

Hearth Pad and Bottom
Continuous heat flux modeling of the hearth floor tracks refractory remaining life against the original design profile, flagging any zone where erosion is outpacing the campaign wear curve.
Tap Hole and Elephant Foot
The highest-wear zone on most furnaces gets dedicated thermal tracking that correlates tap hole clay quality, drilling depth, and cast frequency against localized temperature trends.
Bosh and Belly Staves
Stave cooler water differential and copper plate condition are tracked individually across the bosh and belly, identifying coolers trending toward failure well before a cooling water leak occurs.
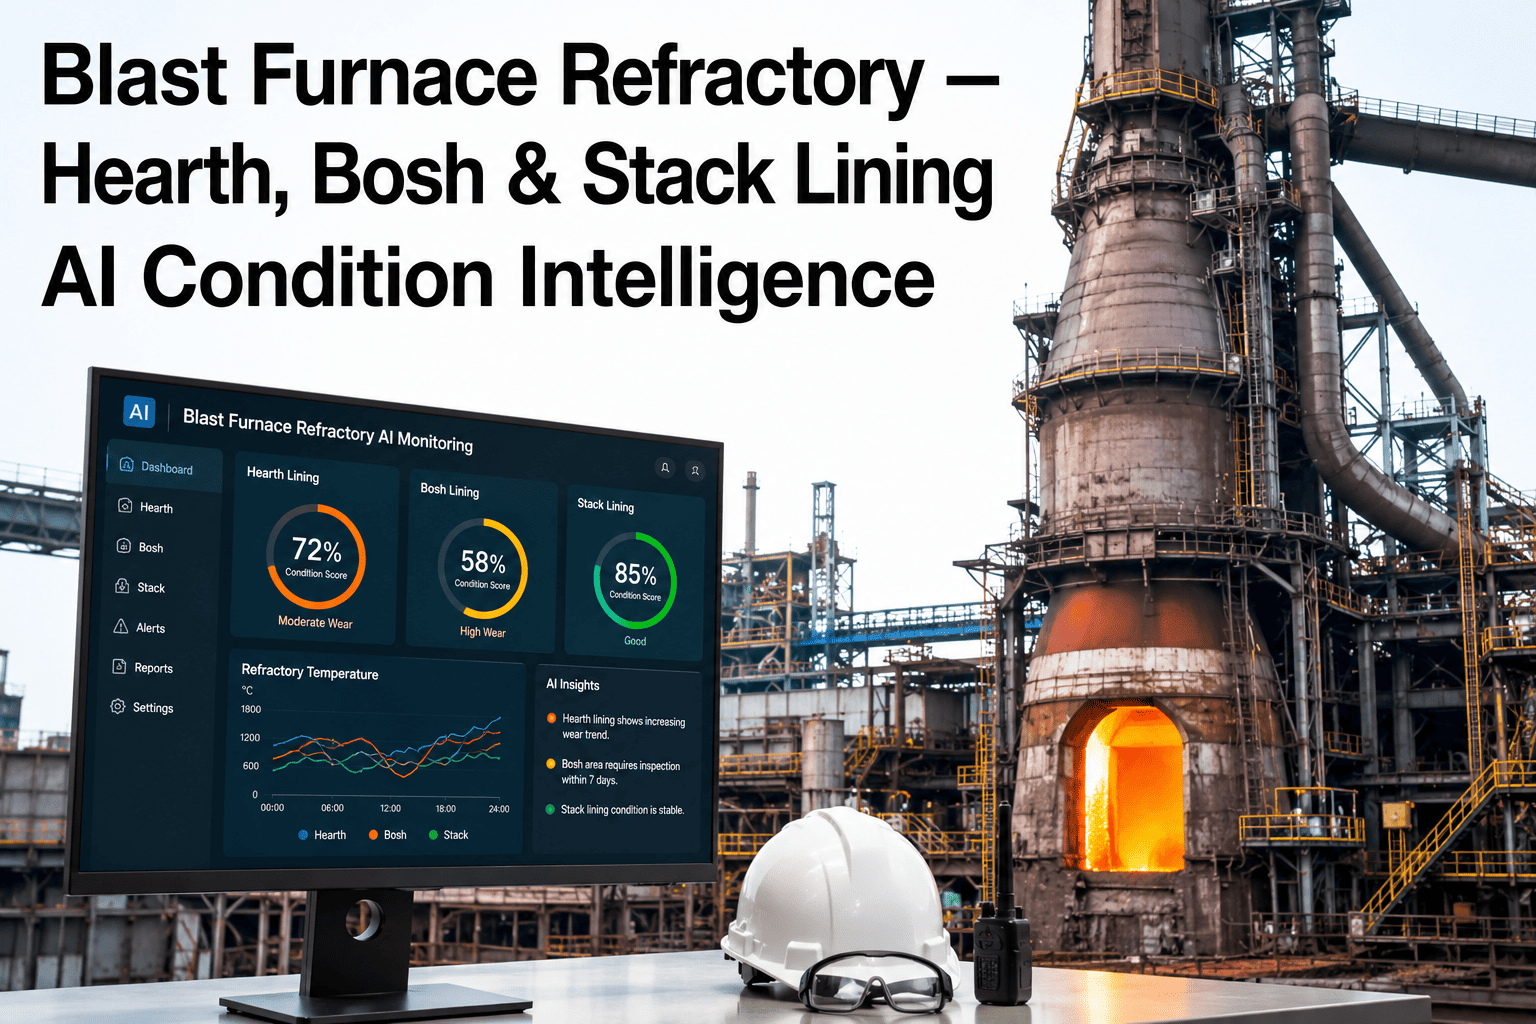
Stack and Shaft Refractory
Upper stack refractory wear is modeled against burden distribution and gas flow patterns, connecting charging practice decisions to long-term lining condition in the shaft region.
Scroll to compare monitoring approaches
Monitoring Capability Manual Thermocouple Review iFactory AI Erosion Modeling
Data Review Frequency Shift reports reviewed once or twice daily, with trend analysis typically limited to weekly or monthly summaries Every thermocouple and cooling channel reading analyzed continuously in real time as data arrives
Cross-Zone Pattern Detection Engineers compare individual sensor charts manually, making it hard to spot a slow multi-zone pattern developing over months AI models correlate hundreds of sensors simultaneously, surfacing multi-zone wear patterns invisible to single-chart review
Remaining Life Estimation Refractory remaining life estimated periodically using generalized wear curves not specific to actual furnace history Remaining life continuously recalculated using the furnace's own erosion history and current heat flux trends
Stave Cooler Failure Warning Cooler failures often discovered when a water leak is visually noticed or water flow alarm triggers Water differential drift flagged weeks before failure threshold, allowing planned isolation instead of emergency response
Reline Planning Confidence Reline timing decisions rely heavily on experience and periodic ultrasonic thickness surveys taken during scheduled outages Continuous remaining-life tracking supports data-driven reline scheduling months in advance of the actual campaign end
See Your Furnace Erosion Model Before You Commit to a Reline Date

iFactory connects directly to your existing thermocouple network and stave cooler instrumentation without new hardware installation, building a continuously updated erosion and remaining-life model calibrated to your specific furnace campaign history within the first weeks of deployment.

Before and After: What Changes When AI Monitors Every Cooling Element

Before AI Monitoring
Stave cooler water differentials reviewed on fixed schedules, with slow drift toward failure easy to miss between review cycles
Hearth erosion assessed mainly through periodic ultrasonic thickness surveys taken only during scheduled outages
Reline timing decisions made under uncertainty, often erring toward earlier and more conservative campaign lengths
Cooling water leaks discovered reactively, sometimes requiring emergency furnace response and production loss
After iFactory AI Monitoring
Every stave cooler's water differential tracked continuously against its own historical baseline, with drift flagged weeks in advance
Hearth erosion modeled continuously between outages using live heat flux data rather than periodic snapshots alone
Reline planning supported by a continuously updated remaining-life estimate specific to actual furnace wear conditions
Developing cooler issues addressed through planned isolation and repair rather than emergency shutdown response

Expert Perspective: What Changed After Continuous Erosion Modeling

For most of my career, hearth condition was something we inferred from a handful of thermocouples and our own experience reading the trend lines during the morning meeting. What AI monitoring changed was the granularity — instead of watching six or eight key points, the model is watching every single cooling element continuously and telling us which specific zone is drifting away from its own historical pattern. We caught a developing hot spot near the tap hole nearly two months before it would have shown up as a visible concern using our old review process, which gave us time to adjust cast practice and monitor it closely rather than face a surprise later in the campaign. The confidence this gives for reline planning alone has changed how we budget capital years in advance.
— Blast Furnace Plant Manager, Integrated Steel Producer · 22 Years in Ironmaking Operations

Frequently Asked Questions

Q: Does iFactory require new sensors installed on the blast furnace?
iFactory connects to your existing thermocouple network, stave cooler water flow and temperature instrumentation, and any hearth monitoring systems already installed on the furnace. No new sensor installation is required in most deployments, since integrated steel furnaces typically already carry extensive instrumentation for basic operational control. The platform ingests this existing data stream and applies AI erosion modeling on top of it. Book a Demo to review your specific instrumentation.
Q: How accurate is AI remaining-life estimation compared to ultrasonic thickness surveys?
AI erosion modeling is designed to complement ultrasonic surveys rather than replace them entirely, using continuous heat flux and thermocouple data to track trends between survey intervals and calibrating the model against each survey result as it becomes available. Over successive campaigns, this calibration process improves accuracy and gives plant teams a continuously updated estimate rather than only point-in-time snapshots taken during scheduled outages.
Q: Can the system distinguish normal seasonal variation from actual erosion progress?
Yes. The model is trained on your furnace's own historical operating data across multiple seasons and burden conditions, allowing it to separate expected variation from genuine wear-driven trends. This is a core part of why the models require a calibration period specific to each furnace rather than using a generic wear curve applied across different facilities and campaign histories.
Q: How does iFactory help with reline campaign budget planning?
Continuous remaining-life estimates give capital planning teams a data-backed view of likely reline timing months and even years in advance, rather than relying primarily on generalized industry benchmarks. This supports more accurate long-range capital budgeting and can help avoid both premature relines driven by excess caution and unplanned emergency relines driven by insufficient warning. Contact our team to discuss your campaign planning timeline.
Q: How long does it take to deploy AI monitoring across a full furnace?
Most furnace deployments are operational within four to six weeks from data access to a live erosion model, though full model confidence typically builds over the following months as the system observes a wider range of operating conditions. The exact timeline depends on the completeness of existing historical data available for initial model calibration and the number of cooling elements and thermocouples being integrated.
Protect Your Furnace Campaign with Continuous AI Erosion Monitoring

iFactory's predictive maintenance platform tracks stave cooler health, hearth wall erosion, and refractory remaining life across every zone of your blast furnace shell, giving plant managers weeks to months of advance warning before wear becomes production-limiting or safety-critical.


Share This Story, Choose Your Platform!