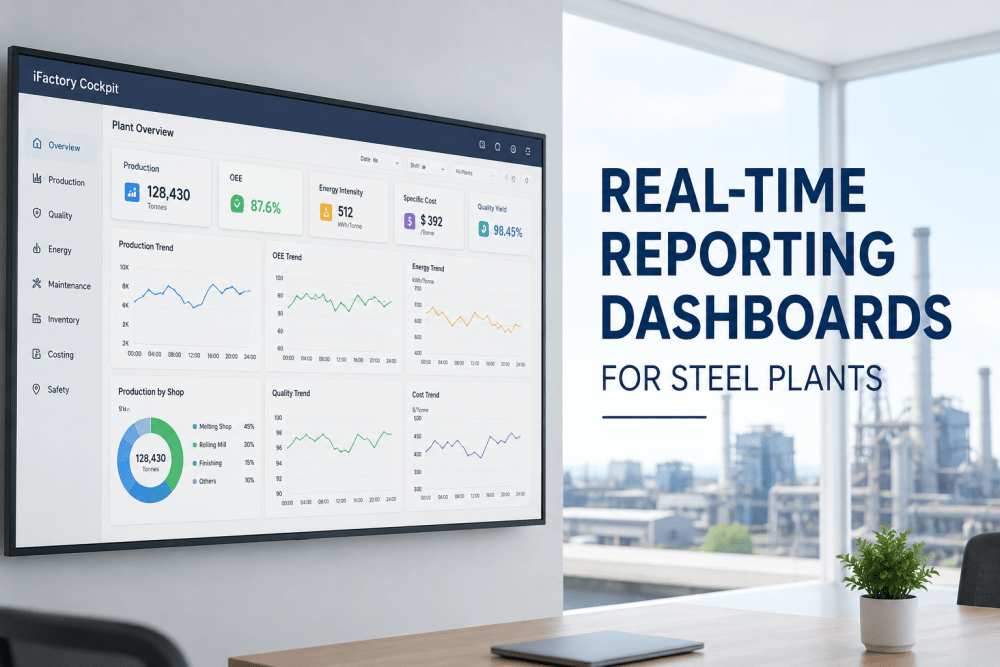
Every steel plant generates more data per shift than a team of process engineers could meaningfully analyze in a week. Production rates, energy consumption, quality measurements, equipment condition signals, inventory movements, and order status updates stream in continuously from Level 1 and Level 2 systems across the melt shop, caster, rolling mill, and finishing lines. The operational intelligence gap is not a data availability problem — it is a data structure, latency, and presentation problem. Real-time reporting dashboards purpose-built for steel manufacturing close that gap by transforming raw process data into decision-ready visual intelligence that operators, shift managers, plant managers, and executives can act on in the same moment the data is generated. This guide examines the architecture, metrics framework, and deployment methodology for AI-powered reporting dashboards in integrated and mini-mill steel plants, and how iFactory's iFactory Cockpit delivers live operational visibility without the months-long IT projects that have historically made real-time BI inaccessible to steel producers.
Why Real-Time Dashboards Fail in Steel Plants — and How AI Fixes It
The steel industry has attempted real-time dashboards for over two decades, and the failure rate of these projects — measured by sustained user adoption beyond six months — remains high enough that many plant managers remain skeptical of new BI initiatives. The reasons are structural rather than technological. Standard BI platforms designed for discrete manufacturing or commercial applications assume clean, structured, consistently formatted data arriving at predictable intervals. Steel plant data does not behave that way. A tundish temperature reading may update every 200 milliseconds during casting and then stop abruptly during a sequence change. A rolling mill force measurement may drift as load cells warm up over a campaign. A caster speed signal may contain transient spikes when the dummy bar is inserted that would distort any moving average calculation that is not explicitly conditioned to exclude them. Standard BI platforms treat these signal irregularities as data quality problems to be solved before dashboards can be built — a position that effectively defers dashboard deployment indefinitely while IT teams attempt to enforce data cleanliness standards that production systems were never designed to meet. Book a Demo to See the Difference
iFactory Cockpit was built from the ground up for process manufacturing data — specifically for the signal characteristics, latency requirements, and query patterns that define steel plant operations. The platform applies AI-based signal conditioning at ingestion time: transient detection filters out sensor artifacts before they enter the analytics pipeline, adaptive smoothing adjusts for sensor drift on multi-hour timescales without masking short-duration events that matter for quality analysis, and missing data interpolation bridges the gaps during sensor calibration or communication interruptions without breaking trend lines that operators depend on for situational awareness. The result is a dashboard layer that presents reliable, conditioned data without requiring upstream data cleanup projects that delay value delivery by quarters or years. See How AI Signal Conditioning Works
- 6 to 18 months of data cleansing and schema design before first dashboard goes live
- Standard visualizations that require custom development to handle process data
- Static refresh cycles — data is minutes to hours old by the time it reaches the user
- IT-dependent dashboard modifications — every layout change requires a support ticket
- No process data models — steel-specific metrics must be built from scratch
- 80% of project budget consumed by data plumbing, not analytics value
- Pre-built data connectors for OSIsoft PI, Siemens, ABB, and 40+ industrial historians
- Steel-specific chart types: cast sequence timelines, pass-by-pass rolling charts, caster thermal maps
- Sub-second to near-real-time data latency — conditioned and available for dashboard rendering immediately
- User-configurable dashboard layouts — drag-and-drop widget editing accessible to non-technical users
- Pre-built steel manufacturing KPI library — OEE, energy intensity, yield, cost per tonne, quality rate
- 90%+ of project budget directed toward analytics configuration and user enablement
The iFactory Cockpit Metrics Framework: Dashboards for Every Role
A real-time dashboard that tries to serve every stakeholder equally ends up serving none of them effectively. An operator on the caster platform needs different data, at different latency, in a different layout than the plant manager reviewing shift performance from an office terminal, and neither set of needs is met by the same dashboard configuration. iFactory Cockpit solves this through role-specific dashboard templates that share a common data foundation while presenting metrics, visualizations, and alert configurations tailored to each user's decision scope and response time requirements. The metrics framework is organized into five dashboard families that cover the full operational intelligence surface of a modern steel plant. Request a Role-Specific Dashboard Demo
| Dashboard Family | Primary Users | Key Metrics Displayed | Refresh Latency | Decision Scope |
|---|---|---|---|---|
| Operations Cockpit | Shift managers, production supervisors, operators | Production rate vs. target, cast sequence status, rolling campaign progress, bottleneck identification, downtime tracking by cause code | Near real-time (seconds) | Shift-level tactical decisions — resource allocation, sequence adjustment, intervention priority |
| Quality Dashboard | Metallurgists, quality engineers, lab managers | First-pass yield by grade and caster, defect trend by type and location, LIMS integration with process parameter overlay, statistical process control for key quality characteristics | Real-time to 5-minute latency | Quality trend detection, process parameter adjustment, product release decisions |
| Energy & Sustainability Dashboard | Energy managers, sustainability officers, plant controllers | Specific energy consumption by process stage, power demand profile, natural gas and oxygen usage, carbon intensity tracking, peak demand monitoring | 1- to 5-minute windows | Energy cost optimization, emissions reporting, demand response participation, efficiency initiative targeting |
| OEE & Asset Performance Dashboard | Reliability engineers, maintenance managers, plant engineers | OEE by asset class, availability by equipment group, performance efficiency, quality rate, MTBF and MTTR trending, maintenance backlog by priority | Shift-based with real-time alerting for threshold breaches | Maintenance strategy optimization, capital replacement planning, reliability improvement prioritization |
| Executive Control Tower | Plant managers, VPs of operations, C-suite | Overall plant OEE, cost per tonne by product group, yield by process route, safety incident tracker, order book vs. production status, financial performance summary | Daily with intra-day alert escalation for significant deviations | Strategic planning, operational target setting, capital allocation, commercial-operational alignment |
How Real-Time Dashboards Reduce Cost Per Tonne in Practice
The business case for real-time dashboards in steel manufacturing is straightforward when it is tied to measurable cost reduction levers. The challenge is that most BI platform proposals present the value proposition in terms of data accessibility and visualization capability — "see your data in real time" — without connecting those capabilities to specific cost reduction mechanisms that plant controllers and CFOs recognize. iFactory Cockpit's metrics framework is explicitly designed to link dashboard visibility to cost per tonne improvement across four primary levers: yield improvement, energy reduction, maintenance cost optimization, and labor productivity. Each dashboard family includes metric trees that trace from the top-line KPI down to the specific operational parameters that drive it, so that when a manager sees cost per tonne trending above target, the dashboard indicates which underlying parameter — scrap rate, specific energy consumption, unscheduled downtime hours, or production rate — is the primary contributor. Calculate Your Potential Cost Savings
Dashboard Architecture for On-Premise and Hybrid Steel Plant Deployments
Data residency requirements in the steel industry — whether driven by corporate IT policy, national data sovereignty regulations, or operational security concerns around process data — frequently require that real-time dashboards operate on premise rather than in a public cloud. This architectural constraint has historically been a significant barrier to deploying modern analytics platforms in steel plants, because most BI and visualization tools are designed for cloud-native deployment and, even when nominally available on-premise, lack the operational tooling for reliable deployment and maintenance in an industrial environment. iFactory Cockpit is architected for on-premise deployment as a first-class capability, not as an afterthought. The entire analytics stack — data ingestion, signal conditioning, metrics calculation, alert engine, and dashboard rendering — runs on a hardened appliance or virtual machine within the plant network, with no external data dependencies and no requirement for internet connectivity to maintain core functionality. Discuss Your Deployment Architecture
Expert Perspective: What Changes When Plant Leadership Has Real-Time Visibility
Before iFactory Cockpit, our Monday morning production review meeting was a retrospective exercise based on printed reports from the previous week. We would spend the first twenty minutes resolving data discrepancies between the MES report, the shift supervisor's log, and the energy spreadsheet — all of which claimed to track the same production numbers but never agreed. The first time we displayed the Operations Cockpit on the conference room screen during that meeting, the plant manager stopped the discussion mid-sentence. He could see that the previous shift had run 12% below target rate because of a caster slowdown that no one had flagged in the shift handoff. That single visibility gap — a 12% production loss that took 36 hours to surface — was costing us roughly $4,800 per hour of unrecovered throughput. We identified four similar visibility gaps in the first month and recovered enough production in the next quarter to justify the entire platform investment. The meetings never went back to printed reports.
Frequently Asked Questions: Real-Time Dashboards for Steel Plants
iFactory Cockpit includes pre-built connectors for OSIsoft PI, Siemens Process Historian, ABB Ability Historian, Rockwell FactoryTalk, and over 40 additional industrial data platforms. Level 2 process control systems, Level 3 MES platforms (including PSI, SMS, and IMS), LIMS systems, and SCADA networks are all supported. A typical deployment connects to 4 to 8 data sources in the first phase, with additional sources added incrementally during subsequent phases. A free data readiness assessment identifies which of your existing systems can feed dashboards immediately.
Yes. iFactory Cockpit is designed for fully air-gapped on-premise deployment with no external network dependencies required for core dashboard functionality. All data ingestion, signal conditioning, metrics calculation, alert processing, and dashboard rendering occurs locally on the appliance. Hybrid cloud connectivity is available as an optional feature for multi-plant roll-up views, but it is never required. Deployment architecture is determined during the scoping phase based on your plant's IT security policy and data residency requirements.
The standard deployment timeline is 6 to 12 weeks from project kickoff to live dashboards in production use. The timeline depends on the number of data sources, the complexity of signal conditioning requirements, and the number of dashboard user groups being configured. A phased deployment approach is available — the Operations Cockpit can typically be live within 4 to 6 weeks while additional dashboard families are configured in subsequent phases. No custom software development is required at any stage of deployment.
iFactory Cockpit includes a drag-and-drop dashboard editor designed for non-technical users. Shift managers, process engineers, and production supervisors can add, remove, or rearrange widgets, change time ranges, modify alert thresholds, and create new metric calculations without submitting IT requests. Power user training is included in the deployment package, and most plants have a cohort of users comfortable making their own dashboard modifications within the first two weeks of go-live. IT is only required for new data source connections or infrastructure changes.
iFactory Cockpit deployments typically achieve full cost recovery within 6 to 14 months of go-live, with documented measurable improvements including 3 to 8% reduction in cost per tonne, 4 to 9% reduction in specific energy consumption, and 12 to 18% reduction in unplanned maintenance events. The ROI modeling approach uses your plant's specific production economics — throughput, yield, energy cost, maintenance spend, and labor cost — to calculate projected savings before deployment commitment. A no-cost ROI modeling session using your plant's data is available as part of the evaluation process.
Conclusion: The Visibility Gap Is the Largest Unrecovered Cost in Your Plant
Every steel plant has production losses, quality deviations, and energy inefficiencies that go undetected for hours, shifts, or days before they surface in end-of-period reports. The cost of those unrecovered losses compounds across every tonne of steel produced during the detection gap — and that cost is not captured in any standard accounting report because the accounting system never knew the loss occurred. Real-time dashboards close that visibility gap by making every relevant metric visible to every relevant decision-maker in the same moment the data is generated. The result is not simply better reporting. It is faster decisions, smaller losses, and more saleable tonnes per operating hour — delivered by an analytics platform that was built for the data environment that steel plants actually operate in.
iFactory Cockpit brings production, quality, energy, OEE, cost, and maintenance visibility to every role in your plant within 6 to 12 weeks — with no custom development, no multi-year IT project, and no data cleanup prerequisite. The dashboards are pre-built for steel manufacturing. The connectors are ready for your existing data infrastructure. The only missing piece is the decision to deploy it. Book your live demo today.