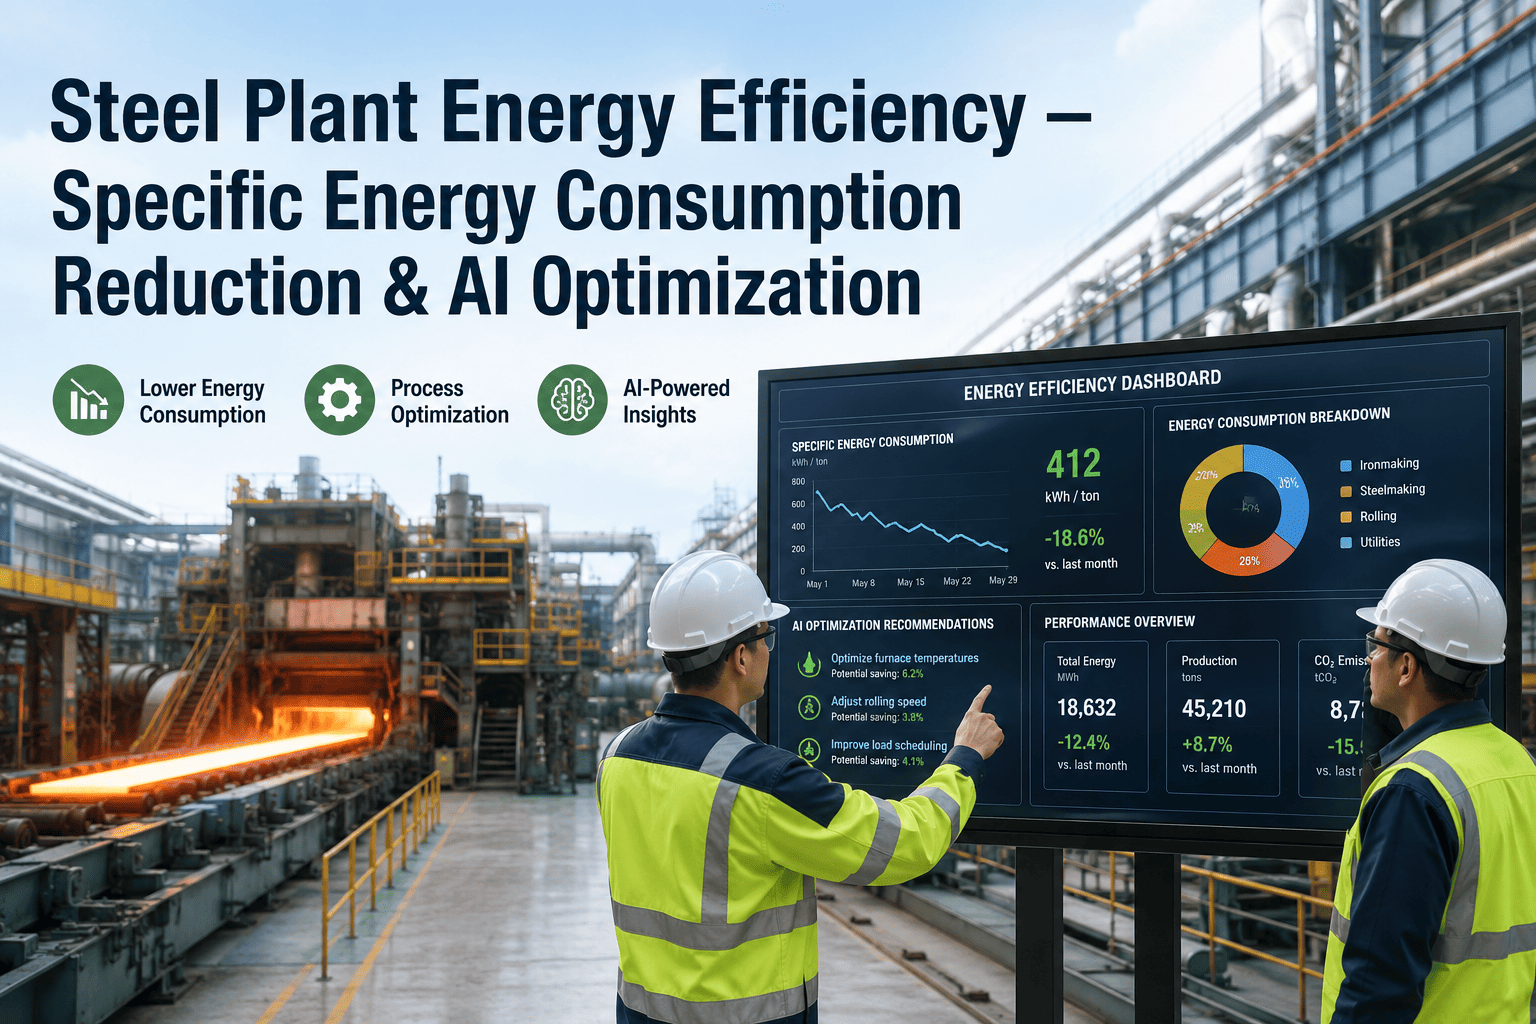
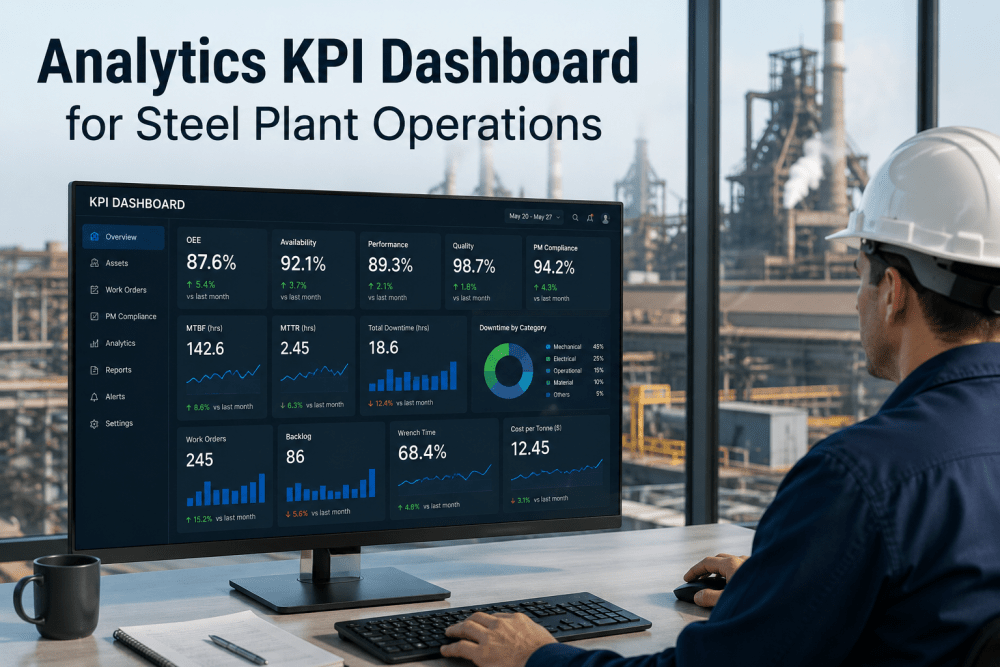
Most steel plants track KPIs. Very few track the right ones, at the right time, in the right way. A plant manager walks into the morning meeting with yesterday's numbers printed on paper. Yield was 94.2%. Energy consumption was 580 kWh per ton. Tap-to-tap time averaged 52 minutes. The numbers look fine. But what the paper doesn't show is that yield dropped to 89% between 2 AM and 4 AM, energy spiked during a furnace ramp that nobody optimized, and three heats ran 8 minutes over target because of a ladle turret issue that's been recurring for weeks. By the time anyone sees these numbers, the losses are already baked in. That's the difference between tracking KPIs and actually using them.
Steel Plant Intelligence
Your Steel Plant Generates 10,000+ Data Points Per Hour. How Many Are You Actually Using?
AI-powered KPI dashboards that turn raw production data into decisions that recover lost tonnes
6
Critical KPIs most plants track manually
47+
KPIs an AI dashboard correlates in real time
8-15%
Typical OEE improvement after implementation
The 7 KPIs That Define Steel Plant Profitability
Not all metrics carry equal weight. These seven KPIs have the most direct impact on whether a steel plant is profitable or bleeding money. The challenge is that they're deeply interconnected, and tracking them in isolation hides the real story.
01
Overall Equipment Effectiveness (OEE)
Availability x Performance x Quality
The single metric that exposes the gap between what your plant could produce and what it actually produces at saleable quality. World-class steel plants target 85%+. Most operate between 55-68% without realizing it.
World Class
85%+
Industry Avg
60-72%
02
Crude Steel Yield
Measures how efficiently raw materials convert into finished product. A 1% yield improvement in a plant producing 1.5 million tons annually adds 15,000 tons of sellable steel, worth over $12 million at current prices.
Target
>95%
Top Performers
97%+
03
Energy Consumption Per Ton
Energy accounts for up to 25% of production costs. Tracking consumption per ton reveals hidden inefficiencies in furnace operations, rolling processes, and auxiliary systems that compound into massive annual losses.
EAF Target
<500 kWh/t
BOF Range
400-600 kWh/t
04
Tap-to-Tap Time
The total cycle time from one heat to the next in EAF operations. Reducing this from 50 to 45 minutes increases daily heats by roughly 10%, directly boosting output without any capital expenditure.
Efficient
42-48 min
Needs Work
>55 min
05
First Pass Yield (Quality)
The percentage of product meeting spec on the first attempt. Every rework cycle consumes energy, time, and capacity. A 2% improvement in first pass yield can eliminate hundreds of hours of reprocessing annually.
Target
>98%
Avg
94-96%
06
Capacity Utilization Rate
How much of your installed capacity is actually producing. With capital expenditures in steel running tens of millions, every percentage point of unutilized capacity represents wasted investment.
Target
>85%
Break-even Zone
70-75%
07
CO₂ Emissions Per Ton
No longer just an environmental metric. With the green steel market projected to exceed $350 billion by 2032, emissions tracking directly impacts market access, pricing power, and regulatory compliance.
EAF
0.6 t CO₂/t
BOF
2.2 t CO₂/t
Want to see all 7 KPIs on one screen, updating in real time? Book a live dashboard demo.
Why Spreadsheets and Manual Tracking Are Failing Your Plant
The steel industry generates enormous volumes of operational data. The problem isn't the lack of data. It's that most plants are still trying to make sense of it using tools built for a different era.
Data arrives 12-24 hours late
KPIs viewed in isolation
Root cause analysis takes days
Decisions based on averages
Only tracks what operators log
Reports tell you what happened
vs
Real-time, second-by-second updates
AI correlates KPIs automatically
Root cause identified in minutes
Decisions based on granular patterns
Captures every event automatically
Predictions tell you what will happen
What an AI-Powered Steel Plant Dashboard Actually Looks Like
Forget generic BI tools with 50 charts nobody reads. A steel-specific AI dashboard organizes intelligence around the decisions plant managers actually make, surfacing what matters and burying what doesn't.
Yield
95.7%
+0.4% vs last shift
Energy
486 kWh/t
-12 kWh vs target
Tap-to-Tap
46.2 min
3.8 min under target
CO₂ / Ton
0.58 t
Within ESG target
AI Alert
Yield trending down on Caster 2. Correlation detected: nozzle clogging pattern matches last month's quality event. Predicted impact: 1.2% yield loss within 4 hours if uncorrected.
Recommended: Inspect SEN nozzle on Caster 2 during next sequence break
This isn't a mockup. It's what plant managers see every morning. See it with your plant's data.
How AI Connects the Dots Humans Can't
Individual KPIs are useful. Correlated KPIs are powerful. AI doesn't just monitor metrics. It finds hidden relationships between them that explain why performance shifts, often catching problems hours or days before they become visible in production reports.
Energy Spike
→
Yield Drop
AI detects that furnace ramp energy spikes above 620 kWh/t correlate with a 1.8% yield drop in the following heat. Root cause: inconsistent scrap preheating creating thermal instability.
Tap-to-Tap Drift
→
Quality Defects
When tap-to-tap time creeps above 53 minutes, first pass yield drops by 2.1% within the same shift. Pattern traced to EBT erosion causing inconsistent tapping temperature.
Vibration Pattern
→
Speed Restriction
Mill stand vibration signatures predict speed restrictions 6-8 hours before operators notice performance degradation. Early bearing intervention prevents 60-70% of speed-related losses.
The Financial Impact of Connected KPIs
1% Yield Improvement
$7-12M
Annual savings on a 1.5M ton/year plant
10% Energy Reduction
$3-5M
Annual savings at current energy rates
5 Min Faster Tap-to-Tap
10%
More heats per day, zero CapEx
15% OEE Improvement
$20M+
Recovered capacity without expansion
From Data to Decisions: What Changes in 90 Days
Deploying an AI-powered KPI dashboard isn't a multi-year IT project. Most steel plants see measurable impact within the first quarter. Here's the typical progression.
Week 1-2
Connect & Discover
Sensors and PLCs feed data into the dashboard. Within days, the system reveals production patterns that have been invisible for years. Most plants discover their actual OEE is 10-15 points lower than they believed.
Week 3-4
AI Learns Your Plant
The AI builds a performance model specific to your equipment, processes, and operating conditions. It begins identifying correlations between KPIs that explain recurring losses and quality issues.
Month 2
Predictive Alerts Begin
The dashboard starts predicting yield drops, energy spikes, and quality deviations before they happen. Maintenance and operations teams receive actionable alerts with specific root causes and recommended interventions.
Month 3
Measurable ROI
Plants implementing AI-driven KPI tracking typically report 8-15% OEE improvement, measurable yield gains, and a clear path to recovering millions in previously invisible production losses.
Your Plant's Data Is Already Telling a Story. Start Listening.
Every hour of production generates thousands of data points. iFactory's AI dashboard turns that raw data into the KPI intelligence that recovers lost tonnes, cuts energy waste, and drives decisions that compound into millions in annual savings.
Frequently Asked Questions
What KPIs matter most for steel plant profitability?
The seven KPIs with the highest impact on steel plant profitability are OEE, crude steel yield, energy consumption per ton, tap-to-tap time, first pass yield, capacity utilization rate, and CO₂ emissions per ton. OEE is the most comprehensive because it combines availability, performance, and quality into a single metric that reveals the true gap between potential and actual output.
How does AI improve KPI tracking compared to traditional methods?
Traditional tracking captures data hours or days after the fact and looks at KPIs in isolation. AI-powered dashboards process data in real time, automatically correlate metrics to find hidden patterns, and predict problems before they impact production. The shift is from reactive reporting to proactive decision-making.
What kind of ROI can we expect from an AI KPI dashboard?
Steel plants implementing AI-driven KPI tracking typically see 8-15% OEE improvements within six months. The financial impact depends on plant size, but even a 1% yield improvement on a mid-size plant can recover $7-12 million annually. Most plants achieve full ROI within 12 months through recovered production capacity and reduced energy waste.
Does the dashboard work with our existing equipment and systems?
Yes. iFactory connects to virtually any equipment, from legacy PLCs to modern SCADA systems, and integrates with existing ERP and MES platforms. No equipment replacement is needed. The system collects data from your existing sensors and control systems, adding AI intelligence on top of your current infrastructure.
How long does implementation take?
Initial dashboard deployment typically takes 1-2 weeks. The AI begins generating useful correlations within 3-4 weeks as it learns your plant's specific patterns. Predictive capabilities mature over 2-3 months. This is not a multi-year IT project. It's designed for fast time-to-value with minimal disruption to operations.
See What Your KPIs Are Really Saying
Get a personalized walkthrough of iFactory's AI-powered steel plant dashboard. We'll show you exactly how real-time KPI intelligence translates into recovered tonnes, reduced energy costs, and faster, smarter decisions.