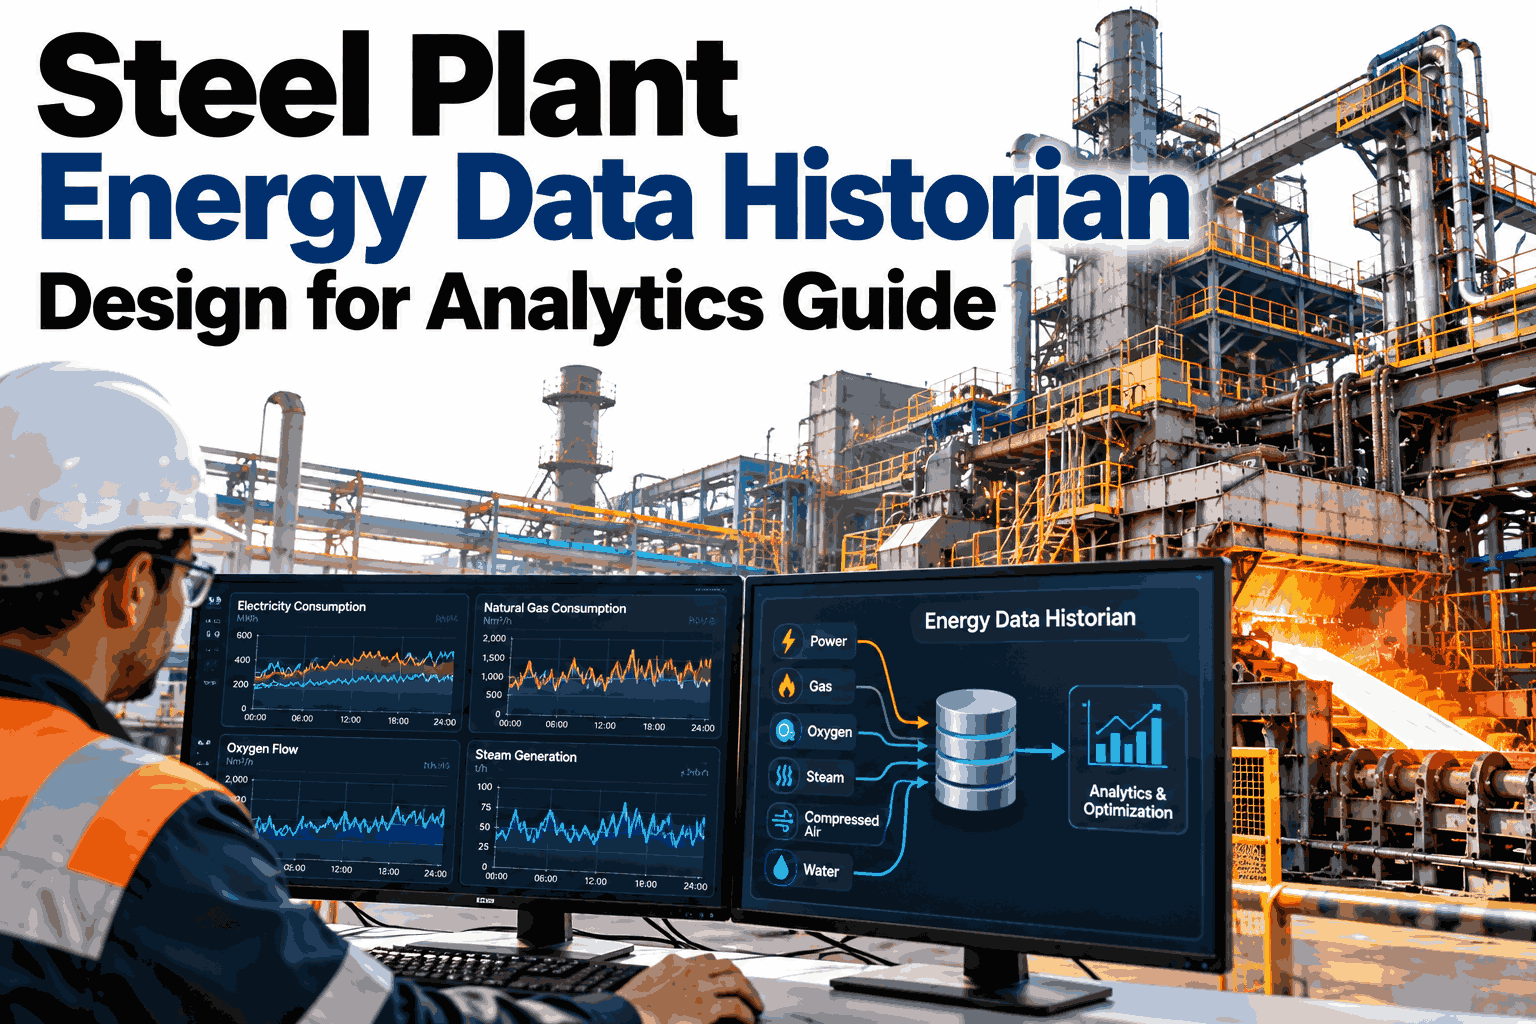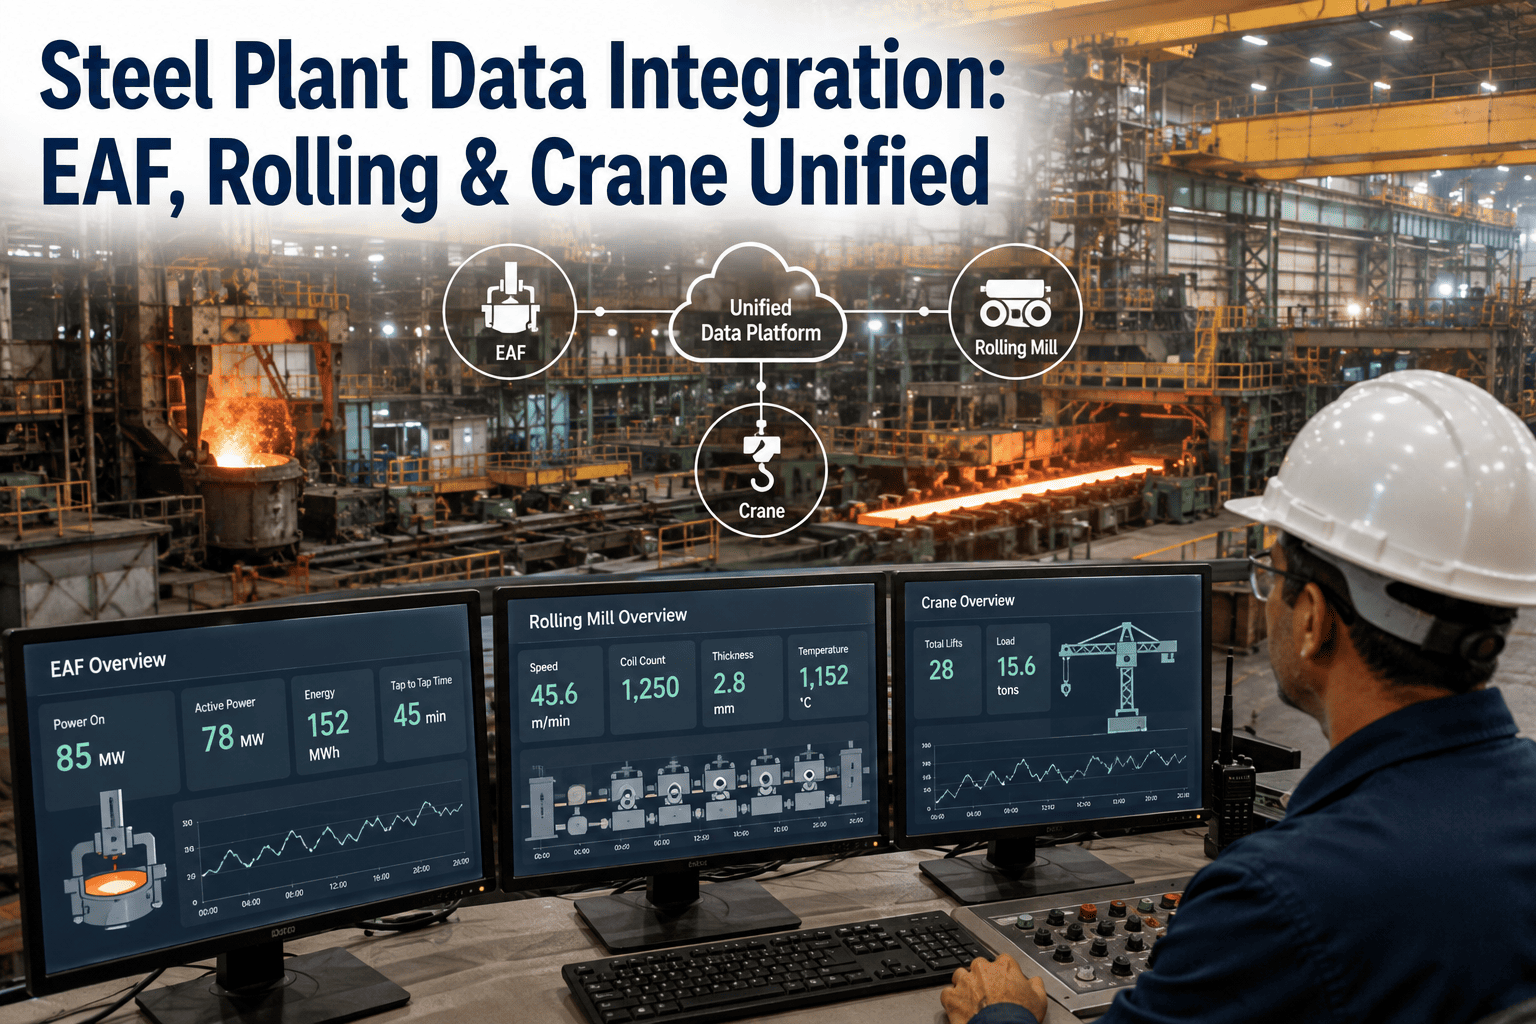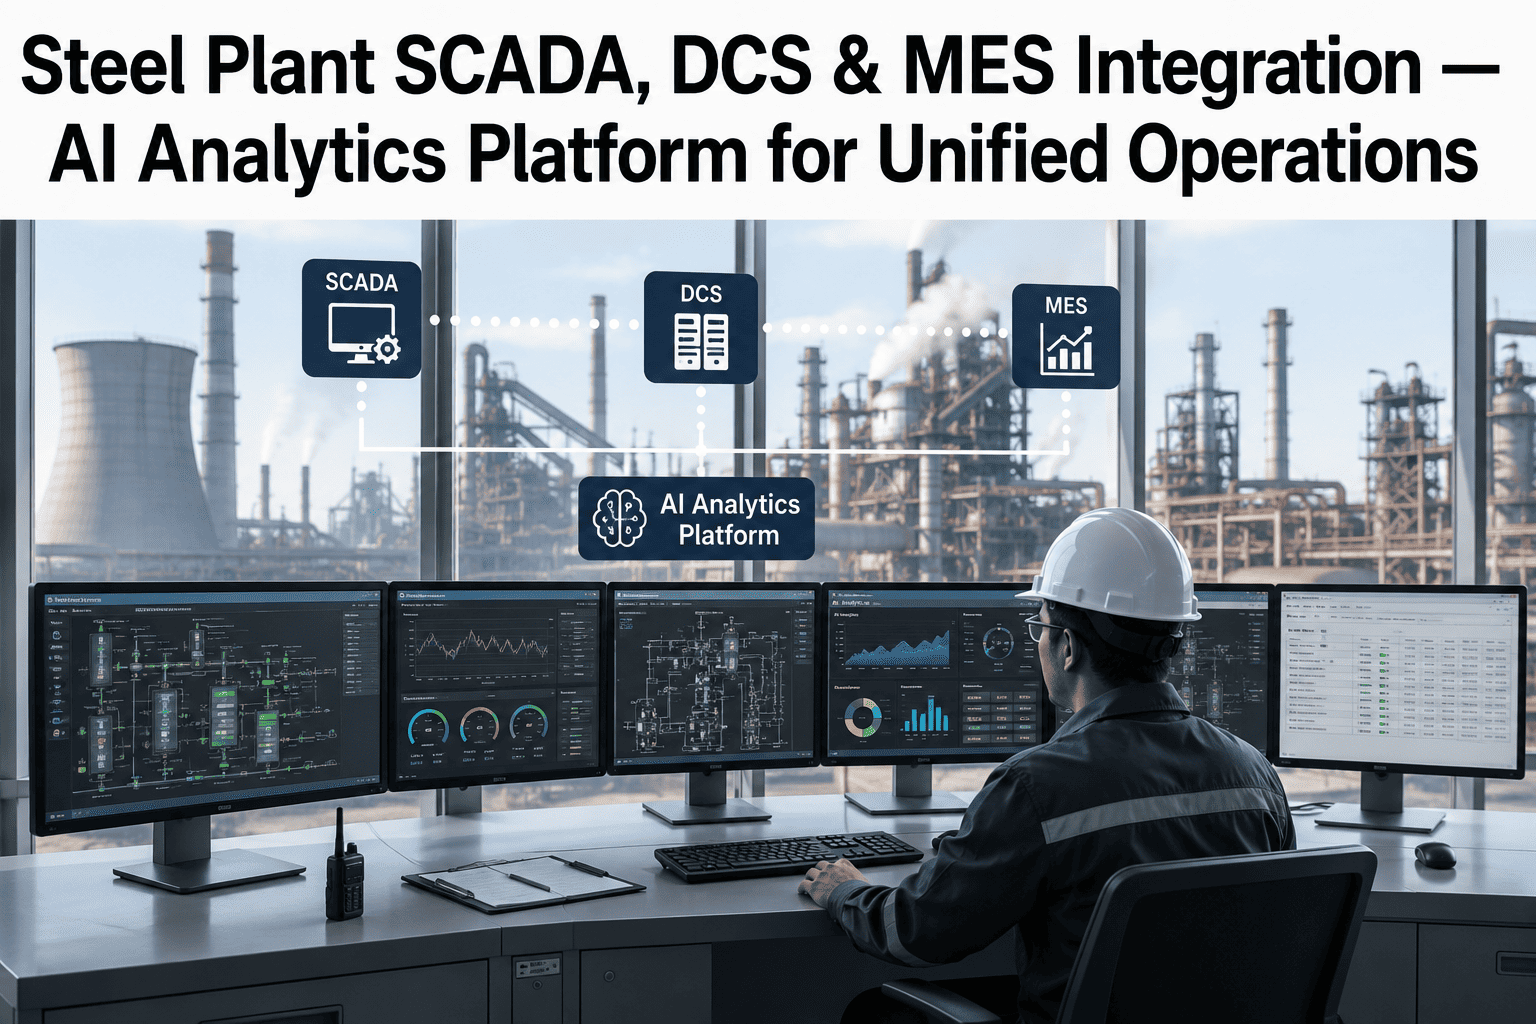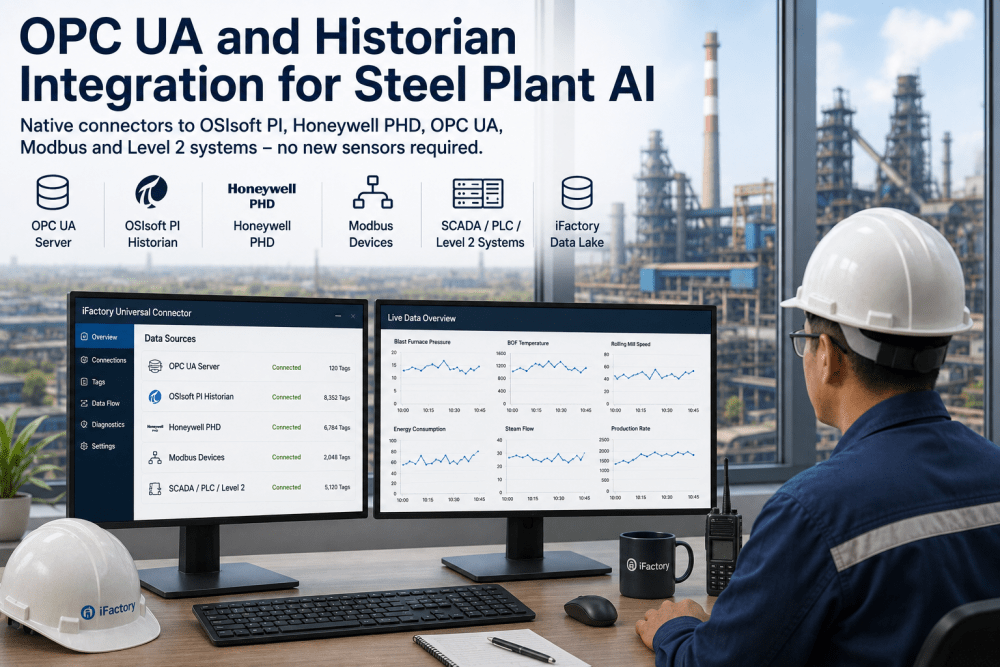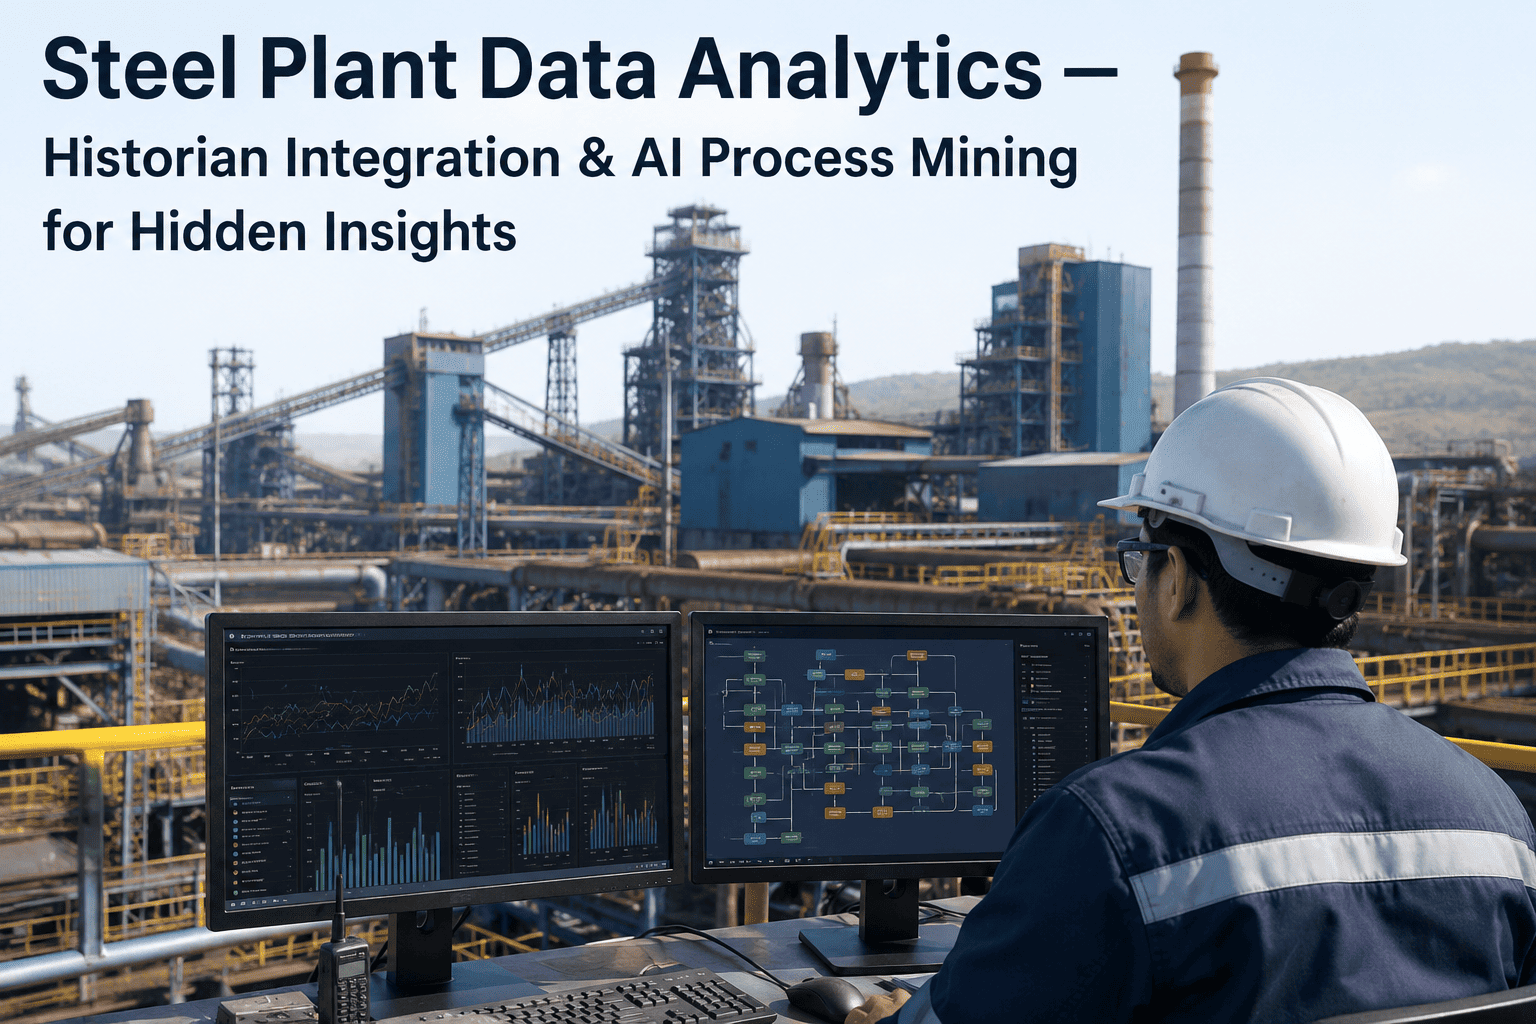
Most steel plants generate more process data than any team could ever manually review — millions of tags streaming from ironmaking, steelmaking, casting, and rolling every single shift. Yet that data sits locked inside PI historians, Honeywell PHD nodes, and OPC-UA servers, rarely connected across process zones. A silicon spike in the blast furnace three shifts ago might explain today's surface defect on the hot strip mill, but no one is looking because the systems that hold each half of the story were never linked. AI process mining changes that by surfacing hidden correlations across every historian in the plant.
Your Historians Already Know Why. AI Process Mining Finally Asks.
Connect PI, PHD, OPC-UA, and Modbus data across ironmaking, steelmaking, casting, and rolling, then let AI mine years of production history for the correlations your team never had time to find.
Why Insight Dies Before It Reaches the Process Engineer
The single most expensive step in deploying AI at a steel plant isn't the model — it's stitching together an automation landscape nobody designed as one system.
Four Systems, One Plant, No Shared Language
Every steel plant runs a unique combination of automation infrastructure. Process mining only works once all four talk to the same engine.
OSIsoft PI
Millisecond-resolution time-series data spanning years of ironmaking, steelmaking, and rolling operations — the deepest well of untapped context in the plant.
Honeywell PHD
Process data collected from distributed control networks across each production zone, often isolated in its own reporting silo from the historian layer above it.
OPC-UA Servers
Sub-second PLC data exposing live equipment state, rarely archived long enough to correlate against downstream quality outcomes weeks later.
Modbus RTU
Field instruments feeding the SCADA layer directly, often the last mile of data that never makes it into any centralized analytics environment.
From Raw Tags to Root-Cause Correlation
A universal connector layer removes the integration burden so the mining engine can focus on finding patterns, not fixing pipes.
Native connectors pull tag data from PI, PHD, OPC-UA, and Modbus without touching existing configurations.
Tags are aligned on a shared production timeline, linking upstream process zones to downstream quality checkpoints.
AI scans years of history for statistical correlations a human analyst would need months to isolate.
Ranked correlation insights are delivered directly to process engineers, with the historical evidence attached.
Upstream Parameters That Quietly Shape Downstream Quality
These are the correlations plants routinely miss because the responsible teams never see each other's data.
| Upstream Parameter | Process Zone | Downstream Impact |
|---|---|---|
| Hot metal silicon variance | Blast Furnace | BOF slag chemistry and yield swings |
| Tundish temperature drift | Continuous Caster | Internal crack formation in slabs |
| Reheat furnace soak time | Rolling Mill Entry | Surface scale and descaling efficiency |
| EAF electrode current spikes | Electric Arc Furnace | Refractory wear rate acceleration |
| Cooling water conductivity | Secondary Cooling | Caster segment roll degradation |
Stop Guessing Which Upstream Variable Is Costing You Yield
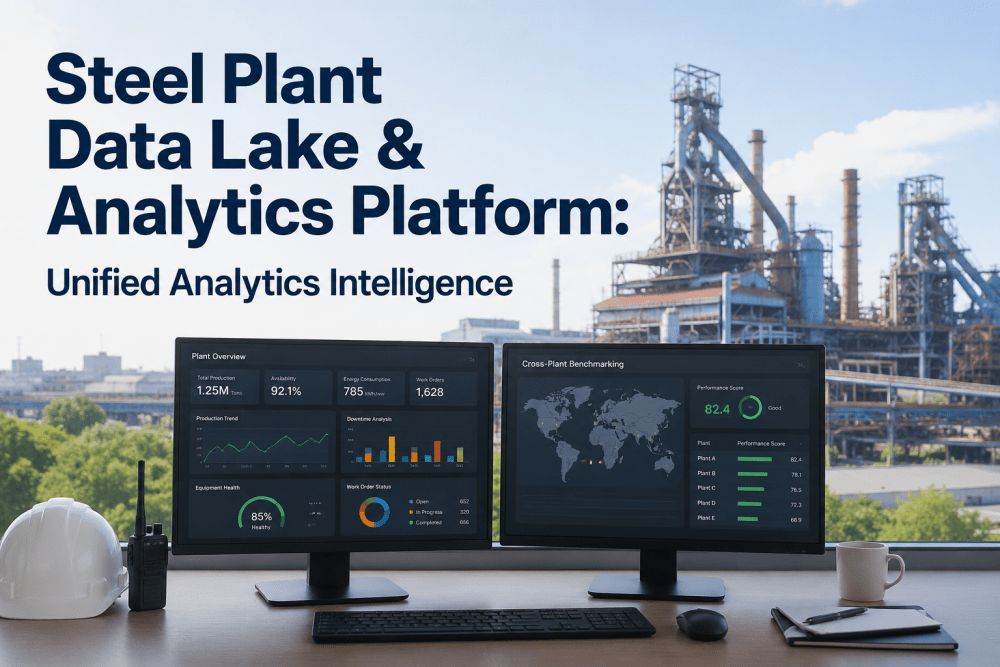
iFactory connects every historian, DCS, and PLC layer in your plant through pre-built native connectors, then runs AI process mining across the full production history to rank the correlations worth acting on first.
Four Use Cases Process Engineers Ask For First
Process mining earns its place on the roadmap when it answers a question the team has been unable to close for years.
Yield Prediction
Correlate charge mix and furnace conditions against historical yield outcomes to flag heats likely to underperform before tap.
Defect Root Cause
Trace a recurring surface or internal defect back through casting and rolling parameters to the single variable driving most occurrences.
Energy Correlation
Identify which upstream process states consistently precede spikes in specific energy consumption across the plant.
Campaign Life Analysis
Link refractory and equipment campaign length to the operating conditions that shorten or extend service life over time.
A Four-Step Path to Cross-Zone Visibility
Deployment starts with connection, not modeling — the correlations only surface once every zone is speaking the same data language.
System Inventory Assessment
Map every historian, DCS, OPC-UA server, and Modbus network across the plant to scope the connector configuration required.
Native Connector Deployment
Configure read-only connections to each system without modifying existing historian or DCS configurations.
Historical Timeline Alignment
Synchronize years of tag data across zones onto a single production timeline so upstream and downstream events can be compared.
Correlation Discovery and Review
AI ranks the strongest cross-zone correlations for process engineer review, with supporting historical evidence attached to each one.
Historian Integration and Process Mining — Questions Answered
What process engineers most often ask before scoping a plant-wide data integration project.
Q: Does connecting PI, PHD, and OPC-UA systems require modifying our existing configurations?
No. A properly built connector layer reads data from OSIsoft PI, Honeywell PHD, OPC-UA servers, and Modbus networks without altering how those systems are already configured. The connection runs in read-only mode, so production control logic and existing historian settings remain untouched. This matters because most plants cannot risk destabilizing systems that operations relies on every shift. You can book a demo to walk through your specific system inventory before committing to anything.
Q: How much historical data does process mining actually need to find useful correlations?
Meaningful correlations typically require at least twelve to eighteen months of aligned historical data across the zones being compared, since seasonal and campaign-level variation matters as much as day-to-day noise. Plants with several years of PI historian data available tend to surface stronger and more reliable patterns, particularly for slow-developing issues like refractory wear or roll degradation. Shorter windows can still work for high-frequency events like yield swings tied to charge mix. The exact threshold depends on how variable your specific process is.
Q: Can process mining work if our historian tags aren't consistently named across process zones?
Yes, inconsistent tag naming is the norm rather than the exception across ironmaking, steelmaking, casting, and rolling systems that were configured by different vendors or teams over decades. A proper integration layer maps and normalizes tag names during the connection phase, so the mining engine works against a consistent schema regardless of how each zone originally labeled its data. This mapping work is typically the largest share of setup time in the first phase of deployment. Ask about your tag inventory during a demo call for a realistic timeline.
Q: Who on the team actually uses the correlation results day to day?
Process engineers are the primary users, since correlation findings are delivered as ranked insights tied directly to the quality or yield metric they already track. Metallurgists reviewing recurring defects and reliability engineers investigating campaign life shortfalls also draw on the same correlation library for root-cause work. The output is designed to be reviewed alongside existing quality and production reports rather than requiring a separate analytics skillset. Most teams fold it into their weekly production review within the first month.
Q: What does a typical deployment timeline look like from connection to first insight?
Connector deployment and tag mapping across a full historian and DCS landscape typically takes several weeks depending on system count and tag volume, followed by historical timeline alignment before mining can begin. Most plants see their first ranked correlation insights within the first phase of a broader rollout, well before the entire system inventory is fully connected. Our support team can walk through a realistic sequence based on your current historian and DCS footprint. Complex multi-site plants naturally take longer than a single integrated facility.
Every Historian Connected. Every Correlation Found.
Your plant has already recorded the answer to your next yield or quality question — it's just spread across four disconnected systems. iFactory's native connectors and AI process mining bring it all into one place your process engineers can actually use.