The modern steel plant does not suffer from a lack of data; it suffers from data fragmentation. Every day, your PLCs, SCADA systems, and maintenance mechanics generate millions of discrete data points. However, when this telemetry is trapped in isolated silos—maintenance data in a legacy EAM, production data in a rigid MES, and quality data in Excel spreadsheets—it becomes impossible to make strategic, plant-wide decisions. The true value of Industry 4.0 is not merely collecting data, but correlating it. Steel Plant Data Analytics is the process of transforming raw machine telemetry into financial outcomes. iFactory serves as the unified intelligence layer for your operations, ingesting live operational data and converting it into board-ready dashboards that track Overall Equipment Effectiveness (OEE), Mean Time Between Failures (MTBF), and maintenance labor utilization. By standardizing your data architecture, plant managers can shift from reactive firefighting to predictive, data-driven capital planning. Book an Analytics Consultation to discover your hidden EBITDA potential.
Turn Raw Telemetry Into Strategic Executive Action
Consolidate your disparate plant data into iFactory's unified analytics engine to uncover hidden inefficiencies, optimize labor routing, and justify your next CAPEX investment.
The Strategic Imperative of Unified Plant Analytics
Historically, steel plant management operated on experience and intuition. A maintenance supervisor knew which rolling mill drive was problematic because they had worked on it for twenty years. But as operations scale across multiple sites and experienced personnel retire, relying on "gut feeling" introduces severe operational risk. Implementing a formal analytics analytics strategy is no longer optional; it is the only way to remain competitive in a volatile global commodities market. When decision-makers rely on week-old Excel reports, they are steering the ship by looking exclusively at the wake.
True steel plant business intelligence requires real-time, correlated context. If a continuous caster drops in throughput, is it because of a mechanical degradation (requiring maintenance), a raw material inconsistency (requiring procurement intervention), or operator inefficiency (requiring training)? iFactory's analytics engine answers these questions by fusing maintenance work-order history with real-time machine telemetry. This AI-driven data analysis eliminates departmental finger-pointing by providing a single, indisputable source of truth.
Furthermore, unified analytics directly impacts the bottom line through optimized capital expenditure. Instead of replacing motors based on an arbitrary 5-year calendar cycle, reliability engineers use the iFactory dashboard to view the exact degradation curve of each asset. This allows plants to safely defer millions of dollars in capital spending by proving that an asset still possesses 18 months of reliable remaining useful life (RUL).
To achieve this level of analytics optimization, the data pipeline must be automated. iFactory removes the burden of manual data entry from your mechanics and operators. By pulling data directly from edge hardware and digital mobile workflows, the analytics dashboards are populated instantaneously and accurately, providing corporate leadership with real-time visibility into the health of the entire enterprise.
The Cost of Data Silos: Why Legacy Reporting Fails
Before implementing a modernized intelligence platform, it is critical to understand why legacy reporting mechanisms consistently fail to drive continuous improvement in heavy manufacturing environments.
- The "Rearview Mirror" Effect: Compiling data from paper shift logs into spreadsheets takes days. By the time a weekly production meeting occurs, the data is stale, and the opportunity to intervene and correct a degrading process has already passed.
- Invisible Micro-Stops: Operators rarely log machine jams or stops that last less than 3 minutes. However, a rolling mill experiencing forty 2-minute stops a shift is losing massive capacity. Legacy systems miss these micro-stops entirely, drastically skewing true OEE calculations.
- Disconnected Financial Context: A standalone maintenance system might tell you that a pump broke three times this month. But without correlating that to production data, you cannot calculate the true cost of those outages in lost tonnage, making it impossible to justify the ROI of upgrading the pump.
iFactory's architecture is explicitly designed to dismantle these silos, ensuring that every piece of data—from a mechanic's wrench time to a furnace's temperature spike—is contextualized financially and operationally.
Four Pillars of Industrial Analytics Actioned by iFactory
Industrial data is only valuable if it drives a specific physical action on the plant floor. iFactory’s predictive analytics framework focuses on four core operational pillars that directly influence your EBITDA. Request a Custom Dashboard Demo.
Automated OEE & Micro-Stop Tracking
iFactory calculates Overall Equipment Effectiveness (OEE) automatically by pulling speed and state data directly from the PLCs. The system tracks every micro-stop down to the second, prompting the operator on their mobile device to select a root cause (e.g., "Strip Break" or "Sensor Fault"). This provides engineers with a highly accurate Pareto chart of the exact issues causing capacity leakage.
Reliability Metrics: MTBF & MTTR
The platform automatically calculates Mean Time Between Failures (MTBF) and Mean Time To Repair (MTTR) for every critical asset. By analyzing these trends, maintenance managers can identify "Bad Actor" equipment that is consuming a disproportionate amount of labor hours, providing the hard data needed to justify a complete asset overhaul rather than continued patchwork.
Spare Parts Velocity & Inventory Optimization
By linking digital work orders to the spare parts inventory, iFactory analytics tracks exactly which bearings, motors, and seals are being consumed at what rate. The system analyzes consumption velocity against lead times to automatically recommend optimal reorder points. This prevents catastrophic stockouts while simultaneously identifying obsolete inventory that can be liquidated to free up working capital.
Labor Utilization & Wrench Time Reporting
Tracking labor efficiency in a massive steel mill is notoriously difficult. iFactory provides dashboards detailing "wrench time"—the actual time mechanics spend fixing machines versus walking the plant looking for parts. By analyzing work order completion rates and travel times, supervisors can drastically optimize shift scheduling and zone assignments.
Architectural ROI: Intuitive vs. Data-Driven Management
Transitioning a steel plant from legacy processes to the iFactory analytics platform requires a cultural shift. However, comparing the outcomes of "management by walking around" versus "management by algorithm" highlights the undeniable financial superiority of a data-driven approach.
| Operational Strategy | Downtime Root Cause Identification | Capital Expenditure Strategy | Reporting Latency | Financial Alignment |
|---|---|---|---|---|
| Legacy / Intuition-Based | Subjective (Operator finger-pointing) | Run-to-Failure (Emergency spending) | 1 to 2 Weeks (Manual Excel) | Poor (Maintenance viewed as a black hole) |
| Basic EAM (No SCADA Integration) | Incomplete (Ignores micro-stops) | Calendar-Based (Replaces healthy parts) | 24 to 48 Hours | Moderate (Tracks costs, misses lost revenue) |
| iFactory Unified Analytics | Objective (Sensor & PLC verified) | Condition-Based (Data-backed RUL) | Real-Time (Millisecond latency) | Excellent (Ties wrench-time directly to EBITDA) |
Deploying iFactory ensures you capture the financial upside of advanced AI analytics, predictive maintenance, and multi-plant visibility, fundamentally changing how your executive team governs plant profitability.
Five Key Dashboards for Steel Operations
Data is useless if it is incomprehensible. iFactory translates complex telemetry into highly visual, role-specific dashboards designed for immediate comprehension on the plant floor and in the boardroom. Audit Your Plant's Reporting.
1. The Live OEE Waterfall
A real-time visualization breaking down 100% theoretical capacity into Availability, Performance, and Quality losses. Watch the cascade update live as the shift progresses, immediately highlighting whether the line is losing money to slow run rates or scrap steel.
2. The "Bad Actor" Asset Matrix
A heat-mapped quadrant plotting every machine by "Frequency of Breakdown" versus "Cost of Repair." This instantly directs reliability engineers to the specific 5% of assets that are causing 80% of the plant's maintenance budget overruns.
3. Preventive Maintenance (PM) Compliance Scorecard
Tracks exactly how many scheduled inspections were completed on time versus deferred. A drop in PM compliance is the leading indicator of a future spike in catastrophic breakdowns, allowing managers to intervene before disaster strikes.
4. Dynamic Inventory Valuation
A financial dashboard showing the total tied-up capital in the spare parts warehouse, cross-referenced against part movement velocity. It automatically flags "dead stock" that hasn't moved in 36 months, identifying immediate cash recovery opportunities.
5. Cross-Plant Benchmarking (Enterprise View)
For multi-site corporations, this dashboard normalizes data across different facilities. Compare the MTTR of the Ohio plant against the Texas plant to identify operational excellence and standardize best practices across the entire enterprise.
Data Governance & Board-Ready Reporting
In the modern corporate environment, Plant Managers and VP's of Operations must rigorously justify their capital requests to the Board of Directors. "We need a new motor because the old one sounds bad" is no longer an acceptable business case. The iFactory analytics engine provides the indisputable, quantitative data required for high-level data governance.
iFactory Executive Reporting Deliverables
Our platform automates the creation of professional, data-backed reports for executive review.
- Automated Shift Handover Reports: Digital summaries generated at the end of every shift detailing exact tonnage produced, active safety incidents, and open high-priority work orders.
- CAPEX Justification Models: Exportable datasets proving that the accumulated repair costs and downtime revenue losses of a specific machine have surpassed the cost of purchasing a new unit.
- Vendor Performance Auditing: Hard data tracking the failure rates of parts supplied by different vendors, allowing procurement to negotiate better contracts based on actual lifecycle performance rather than just upfront unit cost.
- ESG and Energy Consumption Mapping: Correlating machine run-time with energy draw to provide precise carbon-per-ton metrics required for modern environmental reporting.
60-Day Analytics Deployment Roadmap
Deploying an enterprise analytics suite does not require a massive, multi-year IT implementation. iFactory utilizes a rapid, phased approach to ensure you see actionable data and measurable ROI within the first financial quarter.
We begin by importing your existing asset hierarchy, standardizing your failure codes, and uploading your spare parts inventory into the iFactory digital ledger to create the foundational data structure.
We connect the secure data diodes to your critical PLCs to begin ingesting real-time state data. Simultaneously, we deploy the intuitive mobile application to your maintenance mechanics so they can begin logging digital wrench time and part consumption immediately.
As data flows into the system, the dashboards go live. Our data architects work with your reliability engineers to set up custom automated reports, fine-tune the OEE calculations, and establish the automated threshold alerts for condition-based maintenance.
Stop Guessing. Start Knowing.
Transform your raw steel mill data into strategic, board-ready insights that drastically reduce downtime and optimize your maintenance spend.
"Before iFactory, our monthly production meetings were essentially arguments over whose spreadsheet was correct. Maintenance blamed operations, operations blamed procurement. By unifying our SCADA telemetry with our work order execution in one platform, we finally have an objective source of truth. We identified that 40% of our 'mechanical downtime' was actually micro-stops caused by operator setup errors. The analytics allowed us to retrain the team and instantly reclaim 15,000 tons of lost capacity."
— Vice President of Operations, North American Steel Group
Frequently Asked Questions: Plant Analytics
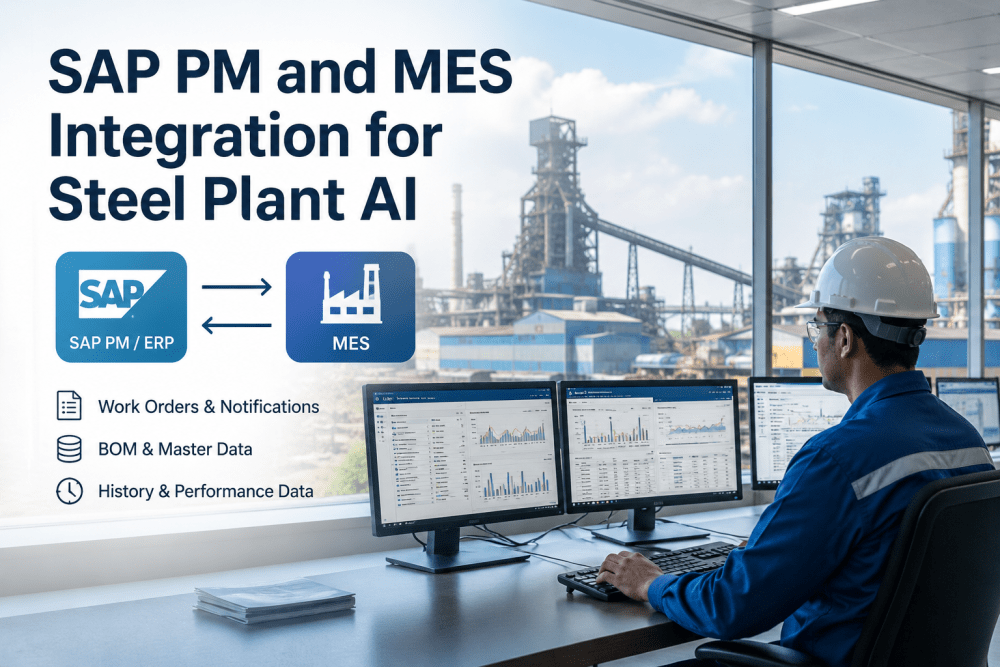
Does iFactory integrate with existing ERP systems like SAP or Oracle?
Yes. iFactory acts as the dynamic operational execution layer, and we frequently integrate with corporate ERPs. We typically push inventory consumption and labor hours back to SAP for financial reconciliation, while iFactory remains the primary tool used by the workers on the floor.
Can we export the data to our own business intelligence tools like PowerBI or Tableau?
Absolutely. While iFactory provides robust out-of-the-box dashboards tailored for manufacturing, all your data remains yours. We provide secure API access and data warehouse connectors so your internal data science teams can pull the metrics into PowerBI for custom corporate reporting.
How accurate is the automated OEE tracking?
Automated OEE is orders of magnitude more accurate than manual tracking. By pulling machine state (running/stopped) and speed (units per minute) directly from the PLC, we capture the 30-second micro-stops that human operators completely ignore, revealing your true hidden capacity.
What if our mechanics are resistant to using digital software?
User adoption is built into the design. iFactory's mobile interface is designed to be easier to use than paper. Because mechanics no longer have to decipher handwriting or walk across the plant to find a manual—it's all attached to the digital ticket—adoption rates typically exceed 95% within the first month.
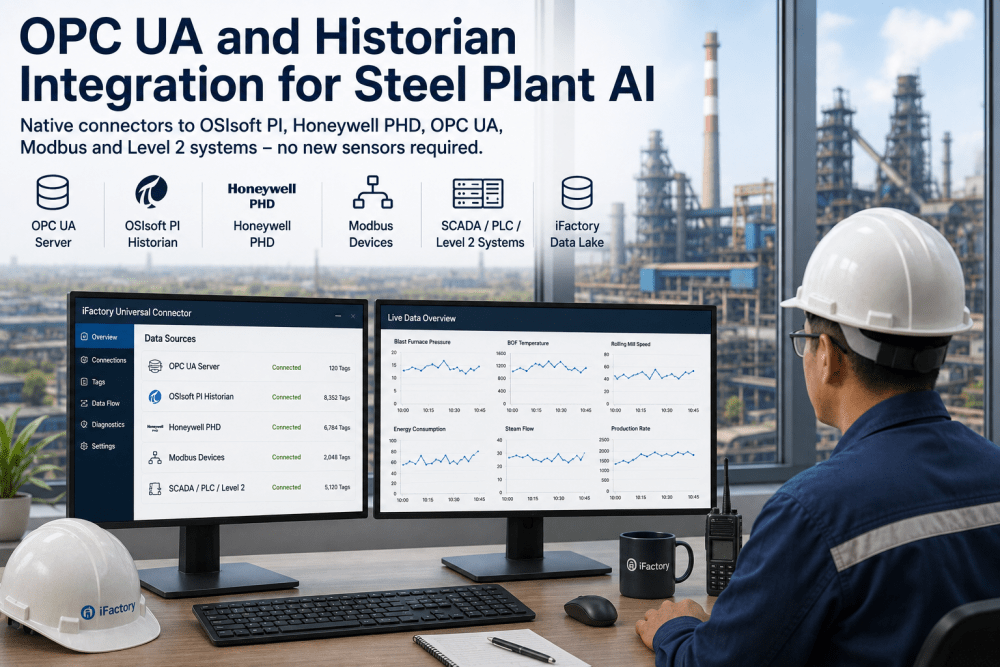
How do you handle data from legacy machines without modern PLCs?
For older "dumb" machines, we deploy simple edge IoT kits. By retrofitting an asset with an inexpensive vibration or temperature sensor that transmits via industrial WiFi, we can pull legacy machines into the unified analytics dashboard without expensive control upgrades.
Can we create custom reports for specific departmental needs?
Yes. The iFactory platform includes a robust custom report builder. Whether the safety director needs an injury-trend report or the quality manager needs a defect-by-shift breakdown, authorized users can easily query the dataset and schedule automated email deliveries of custom reports.
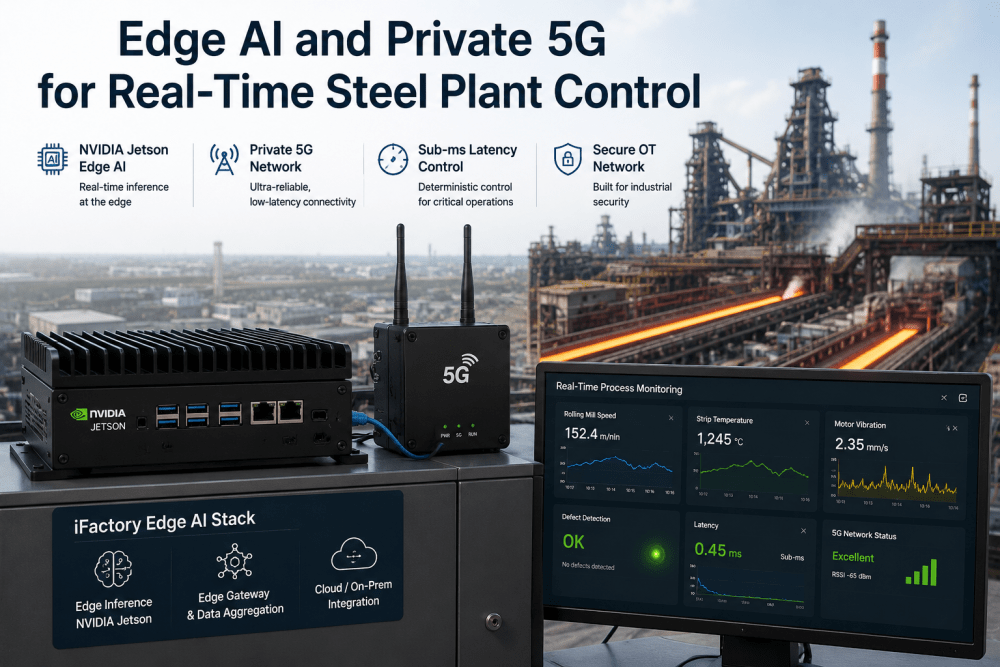
Is the analytics processing done on the edge or in the cloud?
We use a hybrid approach. Fast, reactive logic (e.g., "Trigger an emergency work order if pressure drops") is executed locally on the NVIDIA edge node for zero latency. Heavy, long-term historical trend analysis (e.g., "What is the 3-year MTBF of this bearing type") is processed in the scalable cloud.
How do we ensure the data is secure from cyber threats?
All data is ingested via unidirectional hardware data diodes, preventing any inbound access to your plant floor. Furthermore, all telemetry is encrypted via AES-256 both in transit and at rest, and the entire platform operates under strict Role-Based Access Control (RBAC).
Your Data is Telling a Story. Are You Listening?
Consolidate your silos and transform your steel mill's raw telemetry into high-impact strategic decisions with iFactory.

.png)