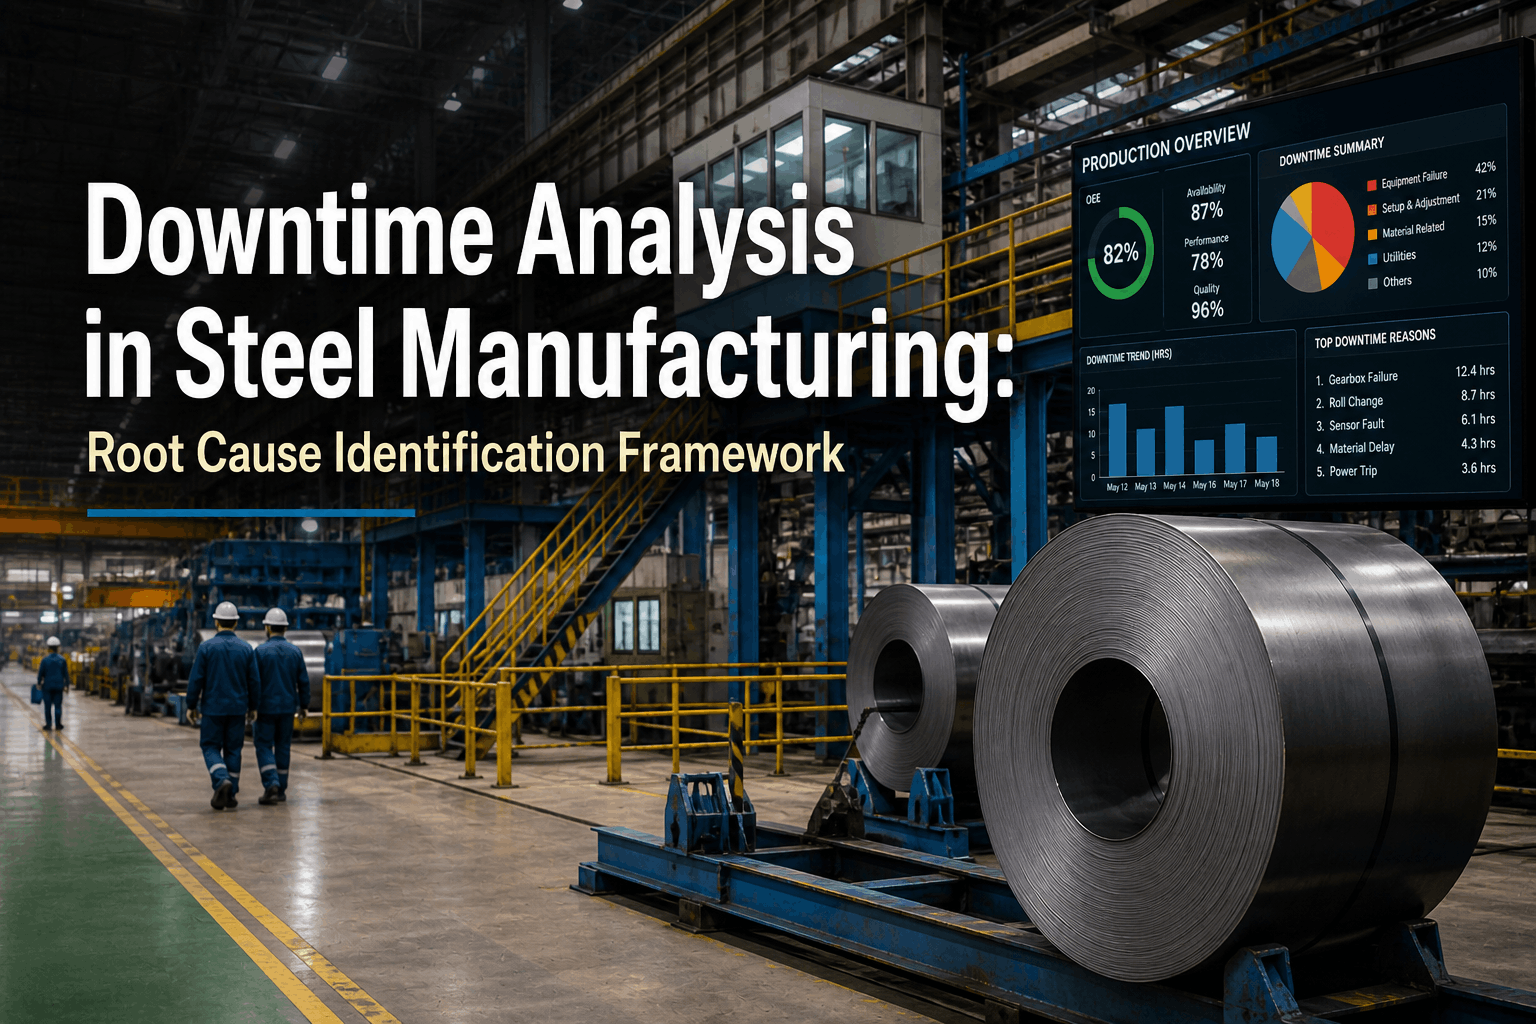
The Six Big Losses framework, developed as the foundation of Total Productive Maintenance, remains the most precise diagnostic lens for identifying where steel plants destroy value. In a 2.5 MTPA integrated steel mill, a single percentage point of OEE is worth $2.8–4.2 million in annual production value. Yet most steel plant leadership teams cannot accurately quantify how much each of the six losses is costing them — because their data collection systems don't capture micro-stoppages under five minutes, can't separate reduced speed from planned slowdowns, and rely on operators to self-report defects and yield losses that implicate their own performance. iFactory's OEE Tracking and Downtime Tracking platforms solve this by connecting directly to PLC and SCADA systems to capture, classify, and quantify every instance of all six loss categories in real time — giving steel plant operations and maintenance teams the precise financial value of every loss, the root cause behind it, and the improvement action required to eliminate it. Plants that implement systematic Six Big Losses tracking with iFactory recover an average of 7–9 OEE percentage points within 18 months — without capital investment in new equipment.
The Six Big Losses in Steel Manufacturing & How to Eliminate Them
Quantify and eliminate every loss category — equipment failures, setup losses, micro-stoppages, speed losses, defects, and yield losses — with real-time PLC-driven OEE data.
The Six Big Losses — Financial Cost Matrix for a 2.5 MTPA Steel Mill
Each of the six losses maps to one of the three OEE components. Understanding which losses are costing you the most — and where they sit in your production process — is the first step to eliminating them. Get your plant's Six Big Loss audit — free, delivered in 5 days.
| Loss Category | OEE Component | Typical Loss (pp) | Annual Cost at 2.5 MTPA | iFactory Detection |
|---|---|---|---|---|
| 1. Equipment Failures (Breakdowns) | Availability | 4–8pp | $16.8–33.6M | PLC Fault Code |
| 2. Setup & Adjustment Losses | Availability | 2–5pp | $8.4–21M | State Transition |
| 3. Idling & Minor Stoppages | Performance | 3–6pp | $12.6–25.2M | Micro-Stop AI |
| 4. Reduced Speed Losses | Performance | 2–4pp | $8.4–16.8M | Speed vs. Ideal |
| 5. Process Defects & Rework | Quality | 1–3pp | $4.2–12.6M | QM Integration |
| 6. Startup & Yield Losses | Quality | 1–2pp | $4.2–8.4M | Coil Tracking |
Each Loss Explained — Steel Plant Context, Root Causes & iFactory Elimination Strategy
The six losses manifest differently in steel plants than in other industries. A "minor stoppage" on a hot rolling mill is not a 30-second annoyance — it is a 240-tonne-per-hour production rate halving until the cobble is cleared. Understanding the steel-specific nature of each loss is essential to eliminating it.
Equipment Failures & Breakdowns
- BF tuyere burn-through — undetected until blast loss
- Caster mould oscillation bearing failure — emergency strand cut
- Hot mill work roll bearing failure — cobble, unscheduled roll change
- Drive coupling failure — full line shutdown, 4–12 hour repair
Predictive vibration monitoring on all P1 drives gives 4–10 week warning. AI classifies fault to bearing/gear level. SAP PM work order auto-created with spare reservation. Failure converted from unplanned to planned — repair cost drops 60–80%.
Setup & Adjustment Losses
- Grade change on rolling mill — roll change + pass schedule adjustment
- Caster grade transition — tundish change, steel grade overlap scrap
- Furnace reheating after cold charge — heat soak delays
- Cobble recovery and threading — 20–90 min each event
Digital changeover tracking captures every setup step with timestamp — identifying where time is lost versus best practice. iFactory benchmarks your fastest versus average changeover per grade type, generates standardised digital SOP, and alerts when setup exceeds benchmark by more than 15%.
Idling & Minor Stoppages
- Descaler nozzle blockage — 2–4 min per event, 8–12 events/shift
- Looper control hunting — mill speed micro-corrections, speed loss
- Crop shear jam — 5–15 min recovery, strip head/tail scrap
- Tension reel mandible jam — coiling stoppage, 10–20 min loss
PLC micro-stop capture classifies every stop under 5 minutes automatically — the invisible losses manual logs never record. iFactory Pareto ranks micro-stop causes by cumulative time lost per shift, enabling targeted maintenance and process improvement that typically recovers 2–3 OEE points from this category alone.
Reduced Speed Losses
- Operator running below ideal speed due to surface defect risk anxiety
- Worn roll profile forcing reduced draft to avoid strip break
- Furnace temperature shortfall — rolling mill held at reduced speed
- Hydraulic pressure degradation — gauge control instability at high speed
iFactory compares actual strip speed or casting speed against the grade-specific ideal speed defined in the MES pass schedule in real time. Speed loss is quantified in tonnes/hour, financially valued, and trended per shift and per operator — making "running slow" visible and actionable for the first time.
Process Defects & Rework
- Scale defects from furnace atmosphere control deviation
- Edge cracks from excessive draft or worn work roll profile
- Slab and bloom surface cracks from continuous caster mould issues
- Dimensional rejection from gauge control instability
iFactory links every quality rejection (from QM or surface inspection system) back to the specific process parameters — furnace temperature, roll force, casting speed — at the time the defective product was produced. Root cause is identified automatically, enabling process parameter correction before the next coil is rolled.
Startup & Yield Losses
- Off-specification crop head and tail — 40–120kg per coil at rolling
- Transition slab at caster grade change — downgraded or scrapped
- Furnace startup heat — first billets undertemperature, dimensional reject
- New roll break-in — first 3–5 coils after roll change at elevated defect rate
iFactory tracks yield loss per coil, per heat, and per cast sequence — identifying which startup conditions generate the highest scrap and rework. Startup parameter optimisation driven by historical data typically reduces startup yield loss by 25–40% within 6 months of implementation.
How the OEE Recovery Builds — Month by Month at a 2.5 MTPA Steel Mill
Eliminating all six losses simultaneously is impossible — the correct sequence targets Availability first (highest loss, easiest to quantify), then Performance, then Quality. Here is how iFactory's phased approach accumulates savings across 18 months.
Before vs After — Six Big Losses at a 2.5 MTPA Steel Mill
Results verified by plant finance and operations leadership after 18 months of the iFactory OEE Tracking programme. All loss values converted to OEE percentage points and annualised production value.
What a VP Operations Said
We knew we had Loss 3 problems — minor stoppages on the descaler and crop shear. What we didn't know was that we had 4.6 OEE points of Loss 3, not the 1–2 points we estimated from manual logs. In the first week of PLC micro-stop capture, iFactory showed us 387 stopping events under 5 minutes that had never appeared in a single shift report. That data changed how we prioritised our maintenance plan entirely.
Frequently Asked Questions
Which of the six losses is typically the biggest at a steel mill?
In our experience across 30+ integrated steel mills, Loss 3 (Minor Stoppages) is consistently underestimated the most — manual logs capture less than 20% of micro-stops under 5 minutes. The true value of Loss 3 is typically 3–5pp of OEE, versus the 0.5–1pp estimated from manual reporting. Loss 1 (Breakdowns) is typically the highest single-event cost, but Loss 3 contains the most recoverable value.
How does iFactory separate planned downtime from the six losses?
iFactory's Planned Production Time engine is configured with your plant's shift schedule, planned maintenance windows, and grade-change allowances. Only time classified as unplanned within Planned Production Time counts against OEE. Planned downtime is tracked separately in the maintenance module — ensuring your OEE reflects genuine performance rather than scheduled activity.
How is Loss 4 (Reduced Speed) measured when ideal speed varies by grade?
iFactory integrates with your MES/L2 system to pull the grade-specific ideal speed (rolling speed, casting speed, or throughput rate) for every production order in real time. Actual speed from the PLC is compared against this dynamic ideal — so a speed reduction that is normal for a thin gauge high-strength grade is not counted as a loss, while the same reduction on a commodity grade is correctly flagged.
Can iFactory track all six losses simultaneously across a multi-line complex?
Yes. iFactory's multi-site architecture supports simultaneous OEE tracking across every production line — BF, BOF, caster, reheating furnace, hot mill, cold mill — with a single portfolio dashboard for operations leadership and line-specific dashboards for each shift team. All six losses are tracked independently per line with roll-up to plant and portfolio level.
See Your Six Big Losses — Live from Your PLC in 48 Hours
Free Six Big Loss audit for your plant — quantified by loss category and financially valued, delivered in 5 days.