Steel industry CEOs and COOs are under pressure from shareholders, regulators, and customers to decarbonize operations while simultaneously improving yield, reducing costs, and maintaining capital discipline in a market where overcapacity and volatile input prices compress margins to single digits. The challenge is that most steel plant digital transformation initiatives fail not because the technology does not work, but because the investment is sequenced wrong — too much spend on dashboards and data lakes before the foundational systems that feed them are reliable. A successful CxO strategy for steel plant digital transformation requires sequencing investments so that each layer of technology creates the data foundation the next layer needs, and tying every investment to a measurable reliability, quality, or energy outcome that justifies the capital within 12 to 18 months. If your steel plant's digital strategy is a collection of pilot projects without a unified investment roadmap, book a demo to see how OxMaint structures transformation roadmaps for steel operations, or contact our strategy team for a digital maturity assessment.
CxO Strategy · Steel Digital Transformation
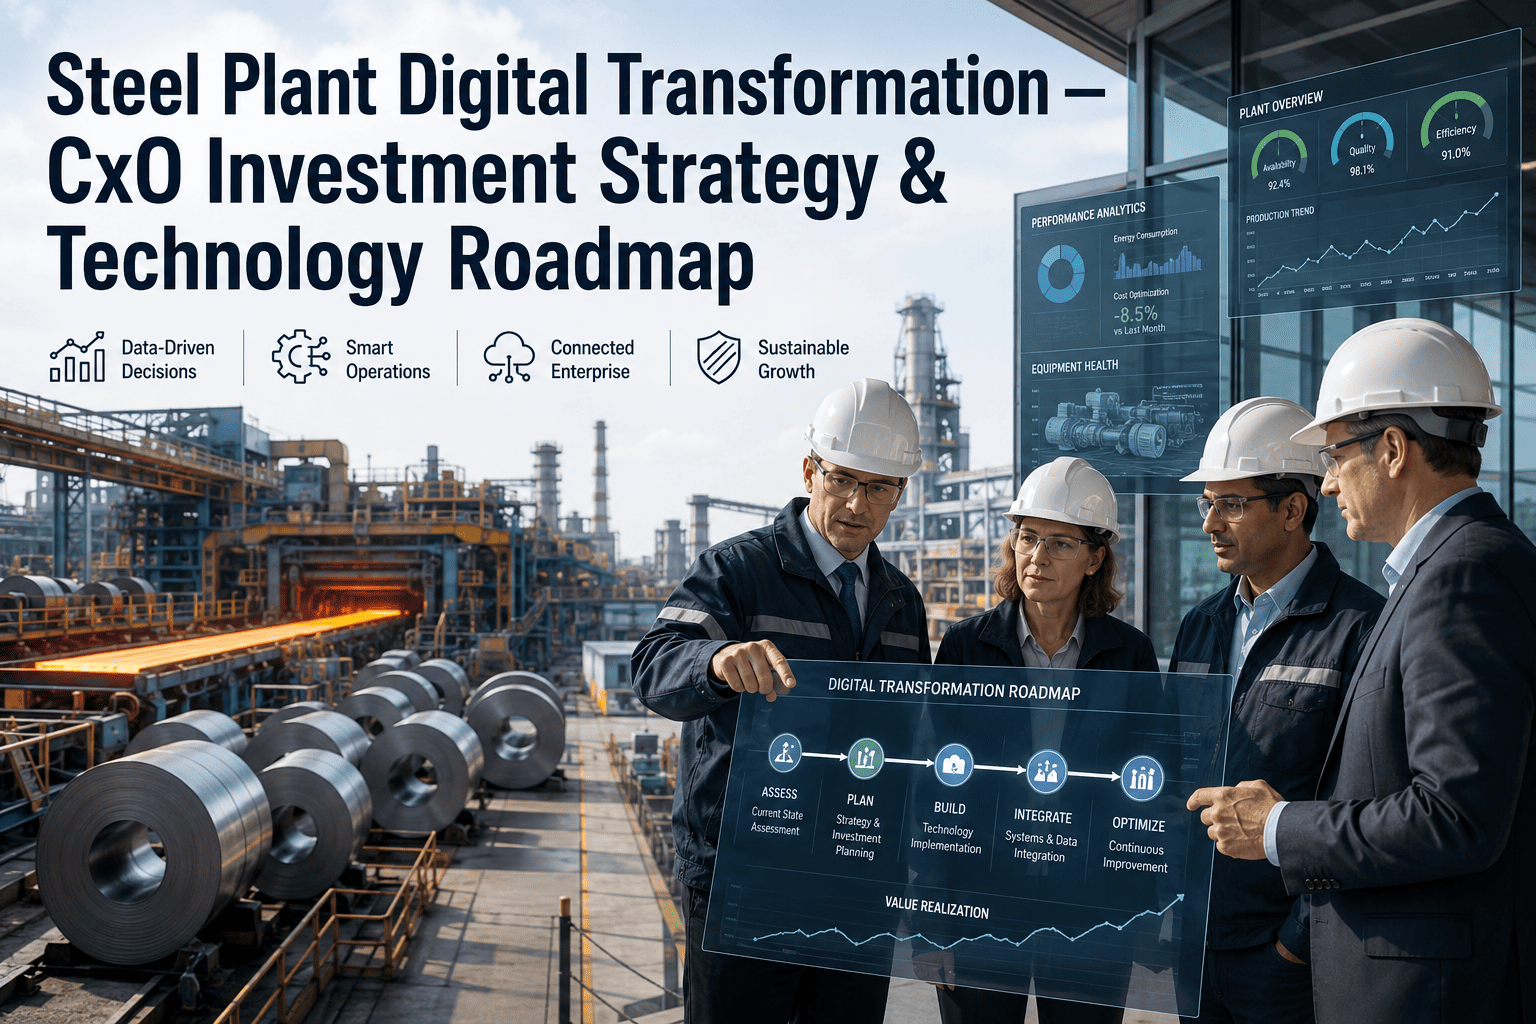
Steel Plant Digital Transformation: CxO Investment Strategy & Technology Roadmap
Sequence your digital investments so each layer funds the next — from predictive maintenance foundations to AI-driven yield optimization to full digital twin operations.
$2.1B
Estimated global steel industry digital transformation spend by 2028
67%
Of steel CxOs say their digital investments lack a unified strategy
12–18 mo
Payback window for properly sequenced foundational investments
The Digital Investment Gap: Where Steel Plants Overspend and Underperform
Analysis of 40+ steel plant digital transformation programs reveals a consistent pattern: heavy investment in analytics and visualization layers before the foundational data systems that feed them are reliable. The table below maps the investment mismatch across four capability layers.
| Capability Layer |
Typical Investment Level |
Actual Readiness Level |
Gap Impact |
| Data Foundation (CMMS, sensors, historian) |
15–20% of digital budget |
40–55% complete |
Analytics and AI layers run on incomplete or inaccurate data |
| Predictive Analytics (ML models, anomaly detection) |
30–40% of digital budget |
15–25% effective |
Models trained on poor data produce unreliable predictions that operators distrust |
| Digital Twin & Visualization |
35–45% of digital budget |
10–15% connected to live data |
Expensive visualizations displaying static or stale information |
| Autonomous Optimization & Control |
10–15% of digital budget |
2–5% deployed |
Advanced control strategies cannot execute because foundational layers are missing |
The 4-Phase Technology Roadmap: Sequencing for Maximum ROI
The roadmap below sequences digital investments so each phase creates the data foundation the next phase requires. Skipping phases is the primary cause of digital transformation failure in steel.
Phase 1
Data Foundation
Months 1–6
CMMS deployment across all critical assets
Sensor installation on key process equipment
Data historian and time-series database
Work order digitization and standardization
Target ROI: 15–25% maintenance cost reduction within 6 months
Phase 2
Predictive Analytics
Months 4–12
ML models for failure prediction on critical assets
Condition-based maintenance triggers replacing time-based schedules
Energy consumption anomaly detection
Quality prediction models for key process parameters
Target ROI: 30–40% unplanned downtime reduction by month 12
Phase 3
Integrated Visibility
Months 10–18
Unified operations dashboard across maintenance, quality, energy, and production
Digital twin initialization for critical process lines
Automated KPI reporting and variance analysis
Cross-functional data integration (maintenance, quality, production, energy)
Target ROI: Executive decision speed improvement, energy cost visibility across plant
Phase 4
Optimization & Autonomy
Months 16–30
AI-driven process parameter optimization
Prescriptive maintenance scheduling across full asset fleet
Digital twin-driven scenario simulation for process changes
Supply chain integration and demand-driven production adjustment
Target ROI: Yield improvement, energy reduction, autonomous decision support
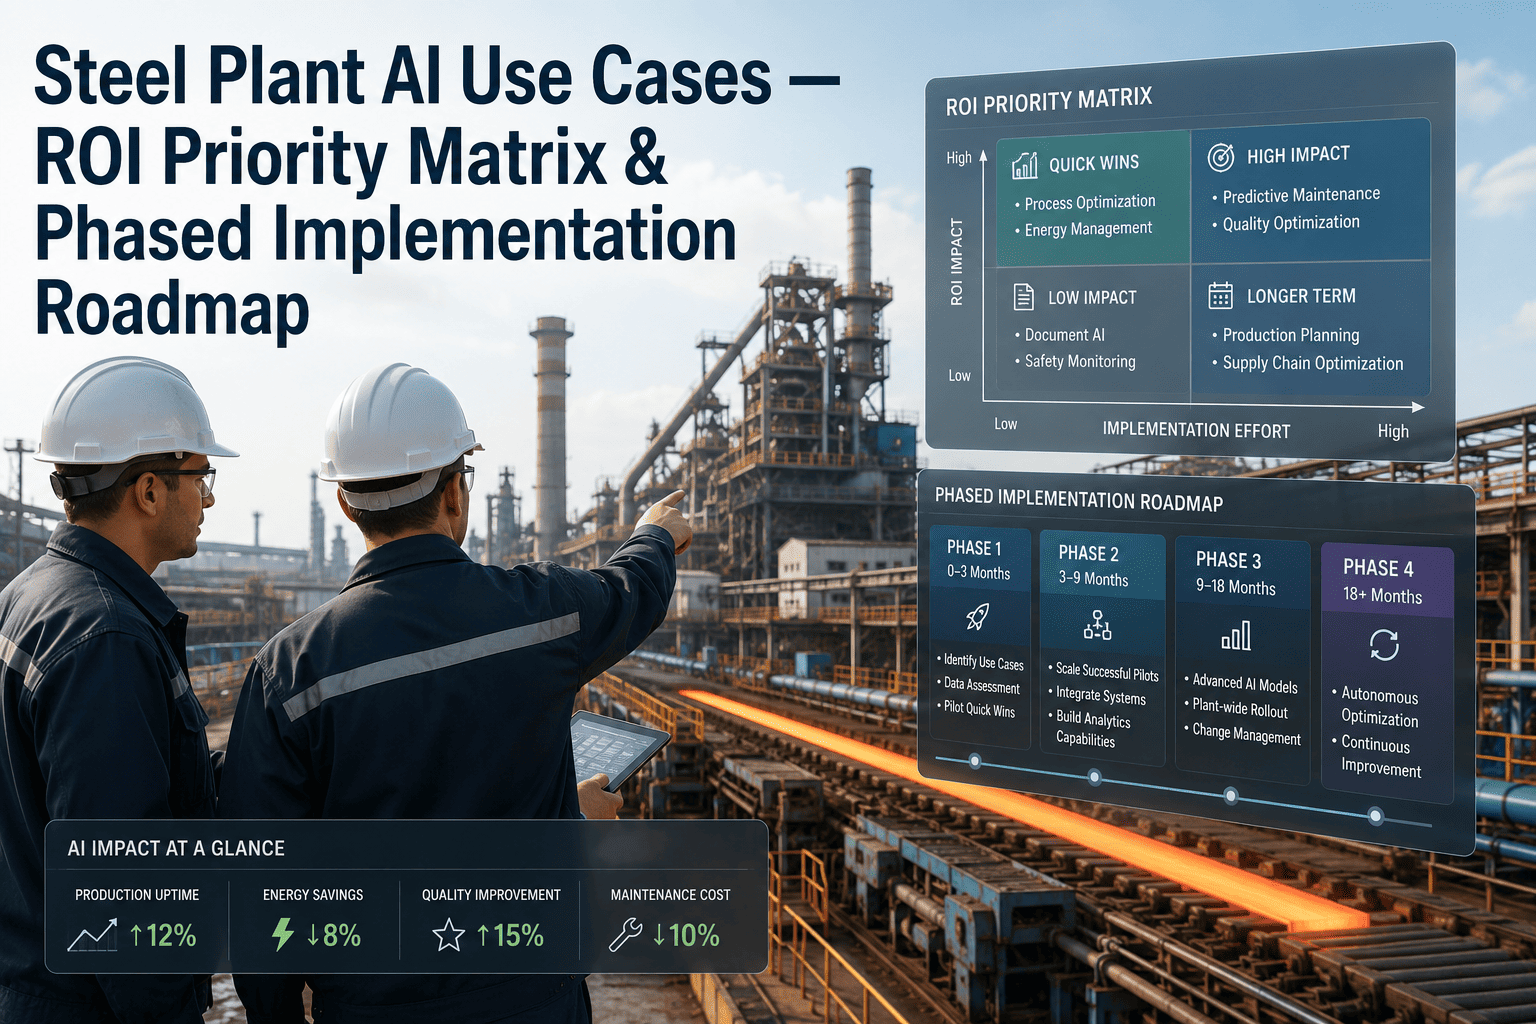
Investment Priority Matrix: Where Steel CxOs Should Allocate First
Not all digital investments deliver equal value in steel operations. The matrix below ranks investment categories by impact magnitude and implementation complexity to guide capital allocation for maximum competitive advantage.
Q1
Predictive Maintenance on Critical Equipment
Highest ROI in steel. Blast furnace, continuous caster, and rolling mill breakdowns cost $50K–$500K per event. AI prediction accuracy of 85%+ on these assets pays for the entire foundational layer.
Impact: Critical · Complexity: Medium
Q2
Energy Management & Decarbonization Tracking
Regulatory and customer pressure on carbon reporting makes energy monitoring a board-level priority. Real-time per-unit energy tracking creates both compliance data and cost reduction opportunity.
Impact: High · Complexity: Low
Q2
Quality Prediction & Yield Optimization
Off-grade production in steel is extremely costly. AI models that predict quality deviations before they occur enable real-time process adjustments that save millions in scrap and rework annually.
Impact: High · Complexity: High
Q3
Digital Twin for Process Lines
High value for scenario planning and optimization but requires reliable data from Phases 1 and 2. Deploying digital twins before the data foundation is solid produces expensive 3D models with unreliable inputs.
Impact: Medium · Complexity: Very High
Q3
Supply Chain & Logistics Integration
Valuable for demand-driven scheduling but requires cross-functional data integration that most steel plants are years away from achieving. Premature investment creates dashboards with incomplete data.
Impact: Medium · Complexity: Very High
Executive KPI Dashboard: Measuring Transformation Progress
Mature steel plant digital transformation programs track six KPIs continuously to ensure investments are delivering measurable returns. These are the metrics that should appear on every CxO's monthly transformation review.
Target: above 90%
PM Compliance Rate
Percentage of preventive maintenance tasks completed on schedule. Digital scheduling eliminates the human tracking gap that causes compliance to drop below 70% in paper-based programs.
Target: above 85%
Prediction Accuracy
Percentage of AI failure predictions that prove correct within the prediction window. Below 70% indicates models need retraining on plant-specific data.
Target: below 2%
Unplanned Downtime Rate
Percentage of scheduled production hours lost to unplanned equipment failure. The primary financial metric that justifies predictive maintenance investment.
Target: measurable
Energy per Unit Output
Energy consumption tracked per ton of steel produced. Digital monitoring makes this metric visible for the first time in most plants, enabling targeted reduction initiatives.
Target: above 95%
Data Availability Rate
Percentage of critical equipment with real-time sensor data flowing into the analytics platform. Foundation metric that determines whether Phases 2–4 are even possible.
Target: trending up
Digital Adoption Score
Composite score measuring digital tool usage across maintenance, quality, and operations teams. Below 40% indicates transformation is停留在pilot phase without operational adoption.
Expert Review
"The steel CxOs who get digital transformation right share one trait: they treat it as an operational infrastructure investment, not an IT project. They do not start with a dashboard. They start with a CMMS, get their work order data clean and complete, install sensors on the 20 assets that cause 80% of their unplanned downtime, and only then build analytics and visualization on top of that foundation. The CxOs who fail are the ones who approved a $3M digital twin project in year one while their maintenance teams were still logging work orders on paper. The roadmap sequencing is not optional — it is the difference between a transformation that pays for itself and one that becomes another expensive initiative that gets cancelled in year three when the ROI fails to materialize. Steel is a margin-sensitive industry. You do not get to make technology investments that do not produce measurable returns within 18 months."
Sarah Chen — Managing Director, Industrial Digital Transformation Practice, 18+ years advising steel and metals CxOs on technology strategy
Stop approving digital investments without a phased roadmap that sequences each layer to fund the next. Our CxO strategy framework maps your current digital maturity, identifies the highest-ROI investments for your specific plant configuration, and builds a 30-month roadmap that delivers measurable returns at every phase.
Implementation Phases: What Each Stage Actually Requires
Each roadmap phase has specific deliverables, resource requirements, and success criteria that must be met before advancing. Skipping stages is the primary cause of digital transformation failure in steel operations.
Phase 1 Deliverables
01Asset registry with criticality classification for all plant equipment
02CMMS fully deployed with standardized failure codes and PM schedules
03Vibration and temperature sensors installed on top 20 critical assets
04Data historian operational with minimum 6 months of continuous data capture
05Work order completion rate above 85% with complete failure cause documentation
Phase 2 Deliverables
01ML models trained on plant-specific failure data for critical asset types
02Condition-based maintenance triggers replacing at least 60% of time-based PM schedules
03Prediction accuracy validated above 80% on pilot assets before full deployment
04Maintenance team adoption rate above 90% with digital tools in daily workflow
05Documented ROI: unplanned downtime reduction and maintenance cost savings
Phase 3 Deliverables
01Unified operations dashboard connecting maintenance, quality, energy, and production data
02Digital twin initialized for at least one critical process line with live data feed
03Automated KPI reporting replacing manual monthly reporting cycles
04Cross-functional data integration eliminating manual data reconciliation between departments
05
Energy per-unit tracking operational with plant-wide visibility for the first time
Frequently Asked Questions
How long does a full digital transformation roadmap take to execute in a steel plant?
A complete four-phase roadmap from CMMS foundation through optimization and autonomy typically spans 24 to 36 months for a mid-sized integrated steel plant. However, Phase 1 alone delivers measurable maintenance cost reductions within 4 to 6 months, which often funds the subsequent phases. The timeline scales with plant complexity — a single-mill mini-mill can move faster than a fully integrated flat steel facility with multiple process lines.
Book a demo to get a phased timeline estimate for your specific operation.
How do we justify digital investment to the board when steel margins are under pressure?
The justification framework that works with steel boards ties every investment to a specific measurable outcome with a 12 to 18 month payback period. Predictive maintenance on critical equipment is the strongest starting point because unplanned downtime events in steel cost $50K to $500K each, and even a single prevented event can deliver more ROI than the entire Phase 1 investment. Energy monitoring is the second strongest justification because carbon reporting is becoming a customer and regulatory requirement that cannot be deferred.
Contact support for a board-ready ROI model for your plant.
Should we build a digital twin before or after predictive maintenance is deployed?
After. This is the most common sequencing mistake in steel. A digital twin without reliable real-time data from the actual process produces an expensive 3D model that operators quickly learn to ignore because the inputs do not match reality. Build the data foundation in Phase 1, deploy predictive models in Phase 2, and then connect the digital twin in Phase 3 when the data flowing through it is actually trustworthy.
Book a demo to see how the phased approach prevents this common failure mode.
What organizational structure changes does digital transformation require in a steel plant?
Most successful steel plant transformations create a cross-functional digital team that includes representatives from operations, maintenance, quality, energy, IT, and finance — reporting to a senior executive sponsor. The team does not own the technology but owns the process change. IT manages the platform; operations defines what needs monitoring and what the data means. Without this cross-functional structure, digital tools get siloed into departmental pilot projects that never scale.
Contact support for organizational design guidance based on your plant structure.
How do we measure whether our digital transformation is actually working versus just being an IT project?
The measurement framework tracks three levels: adoption metrics (are people using the tools?), outcome metrics (are the KPIs moving in the right direction?), and financial metrics (is the investment paying for itself?). A transformation that has great dashboards but no change in downtime rate, energy consumption, or maintenance cost is an IT project, not a transformation. The KPI dashboard on this page represents the metrics that should drive your monthly executive review and board reporting.
Book a demo to see the KPI dashboard framework applied to steel operations data.
Build a Roadmap That Pays for Itself at Every Phase
Sequence your digital investments so Phase 1 savings fund Phase 2, Phase 2 data enables Phase 3 visibility, and Phase 3 insights unlock Phase 4 autonomy — with measurable ROI at every stage.