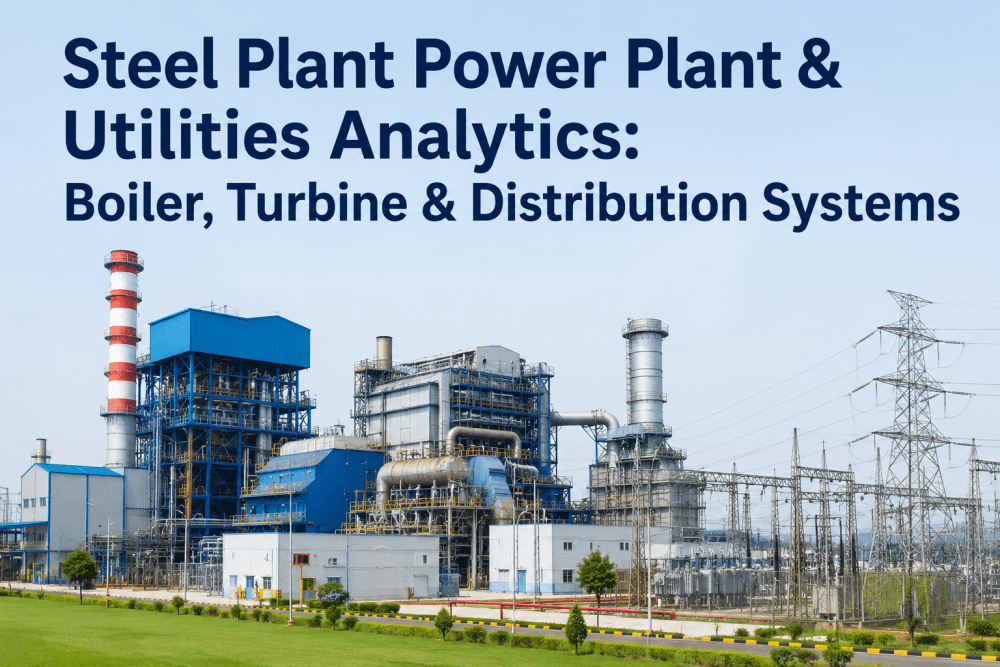
Steel plants are power-hungry by nature. A mid-size integrated mill running blast furnace, BOF steelmaking, and hot rolling typically consumes 400–600 kWh per metric ton of liquid steel — and the captive power plant or utility complex that supplies that energy is as mission-critical as any production asset on the floor. Yet most steel plant maintenance programs treat boilers, turbines, and distribution systems as background infrastructure rather than production-critical equipment with trackable degradation curves and quantifiable failure costs.
This guide is a structured analytics reference for maintenance engineers, reliability teams, and energy managers at U.S. integrated steel plants. It covers captive power plant boiler analytics, steam turbine performance tracking, electrical distribution diagnostics, and industrial gas and compressed air utility systems — with specific threshold values KPI definitions, and decision logic for running utilities as a data-driven operation rather than a reactive one.
Steel Plant Power Plant & Utilities Analytics: Boiler, Turbine & Distribution Systems
Why Utility Analytics Is Not Optional in 2026
For decades, captive power and utility systems in steel plants were managed on fixed maintenance schedules — quarterly inspections, annual overhauls, and reactive repairs when equipment tripped. That approach worked when energy was cheap, replacement parts were available on short notice, and production schedules had margin built in. None of those conditions apply today. Energy costs now represent 20–30% of total steel production cost at U.S. integrated mills, and a single unplanned boiler or turbine outage can cascade into a multi-day production shutdown worth millions in lost output.
The analytics case for utility systems is straightforward: every degradation mode in a boiler, steam turbine, transformer, or compressor produces a measurable signal weeks before it produces a failure. Heat rate drift in a turbine. Flue gas oxygen deviation in a boiler. Dissolved gas trending in a transformer. Differential pressure rise across a compressed air dryer. These signals exist in every plant's DCS historian — the gap is the analytics layer that converts raw data into ranked maintenance priorities.
Boiler Analytics — Performance Tracking & Tube Integrity
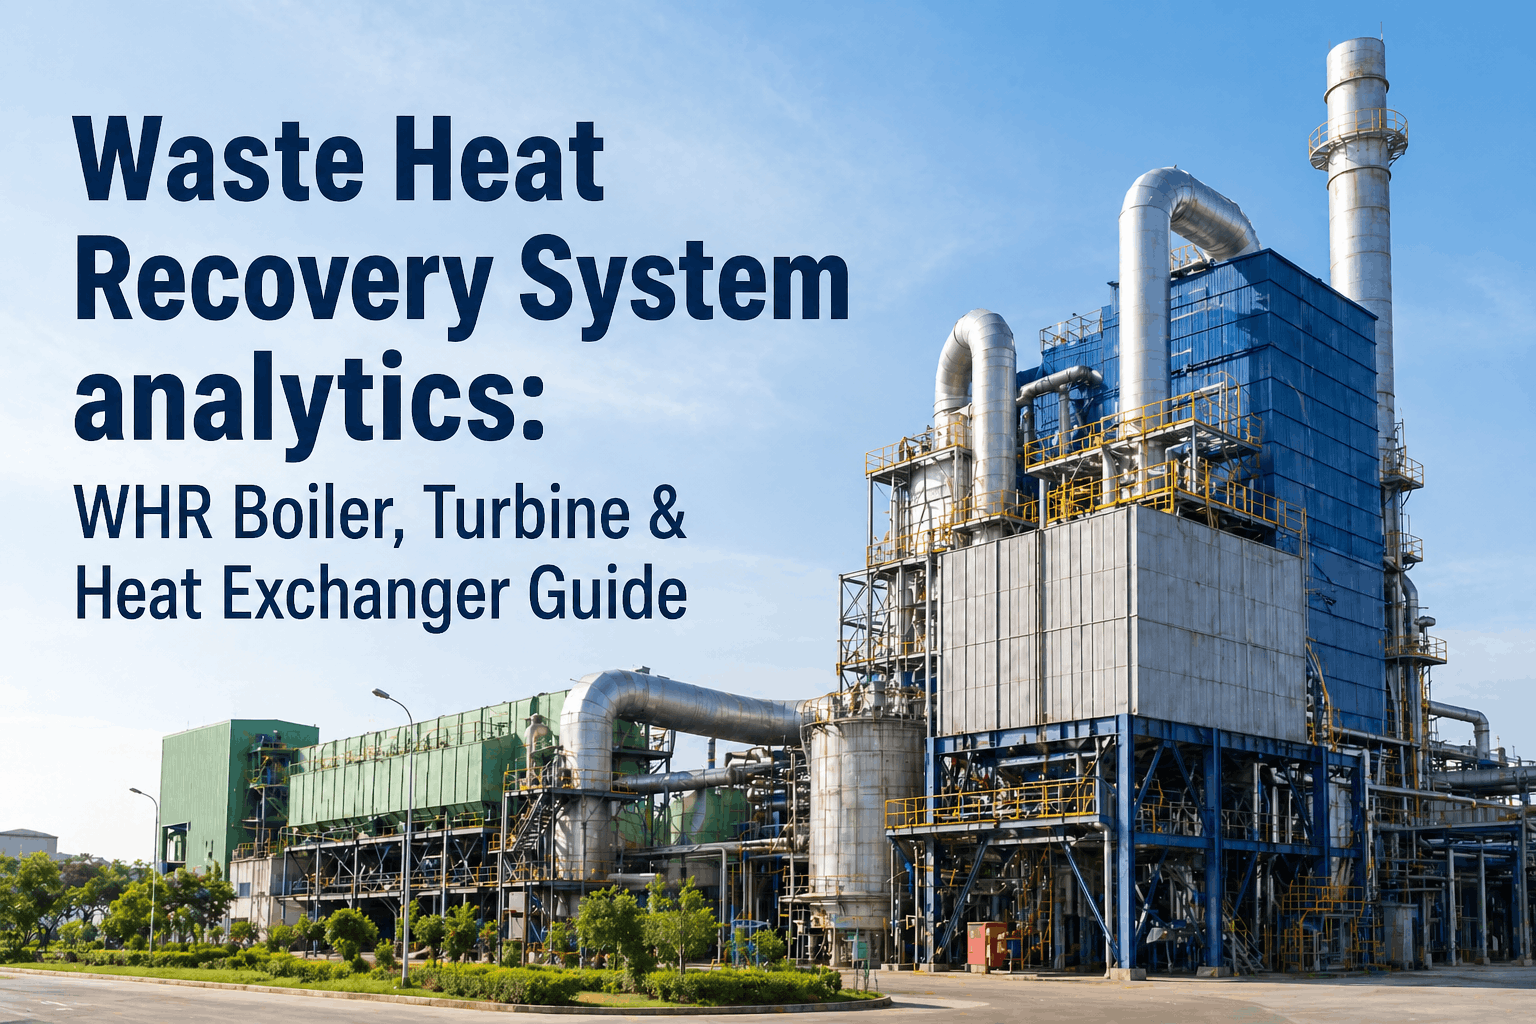
Captive power plant boilers in steel mills — typically fire-tube or water-tube units rated 50–200 MW thermal, operating at 60–100 bar steam pressure — are subject to four analytically distinct degradation modes: combustion efficiency drift (tracked via flue gas composition), heat transfer surface fouling (tracked via approach temperature delta), tube wall corrosion and erosion (tracked via ultrasonic thickness surveys), and water chemistry-driven scale formation (tracked via feedwater and blowdown analytics). The table below defines the key boiler inspection and performance parameters with action thresholds used by leading U.S. steel plant operations. Reserve a demo for Boiler analytics
| Parameter | Nominal Value | Warning Threshold | Action Threshold | Measurement Method | Inspection Interval |
|---|---|---|---|---|---|
| Flue Gas O₂ (excess air) | 2.5–4.5% O₂ | < 2% or > 6% | < 1% or > 8% | Zirconia O₂ analyzer (continuous) | Continuous |
| Stack Temperature | 150–200°C above steam temp | +25°C above baseline | +50°C above baseline | Thermocouple at economizer outlet | Continuous |
| Boiler Thermal Efficiency | ≥ 85% (water-tube) | 83–85% | < 83% | Heat balance calculation from DCS | Daily (calculated) |
| Tube Wall Thickness | Baseline ± 5% | −10% from baseline | −20% from baseline | Ultrasonic thickness gauge (UT) | Every 72 hr at campaign / annual |
| Feedwater pH | 8.5–9.5 | < 8.0 or > 10.0 | < 7.5 or > 10.5 | Inline pH probe (continuous) | Continuous |
| Dissolved Oxygen in Feedwater | < 7 ppb | 7–20 ppb | > 20 ppb | Amperometric D.O. analyzer | Continuous |
| Steam Purity (silica) | < 20 ppb SiO₂ | 20–50 ppb | > 50 ppb | Colorimetric analysis (grab sample) | Every 4 hr |
| Blowdown Rate | 1–3% of steam output | > 4% | > 6% | Flow meter on blowdown line | Continuous |
Steam Turbine Analytics — Heat Rate, Vibration & Blade Condition
The steam turbine — whether a back-pressure unit recovering heat from BF gas combustion or an extraction-condensing unit generating base load for the mill — is the highest capital value and longest lead-time item in the captive power complex. Turbine analytics focuses on three degradation vectors: thermodynamic performance (heat rate and isentropic efficiency), mechanical condition (vibration spectrum, bearing temperature, shaft displacement), and steam path condition (blade deposit buildup, erosion, seal wear). The workflow below maps the turbine analytics process from data acquisition to maintenance action. Predict turbine failures before downtime happens
Electrical Distribution Analytics — Transformer, Switchgear & Substation
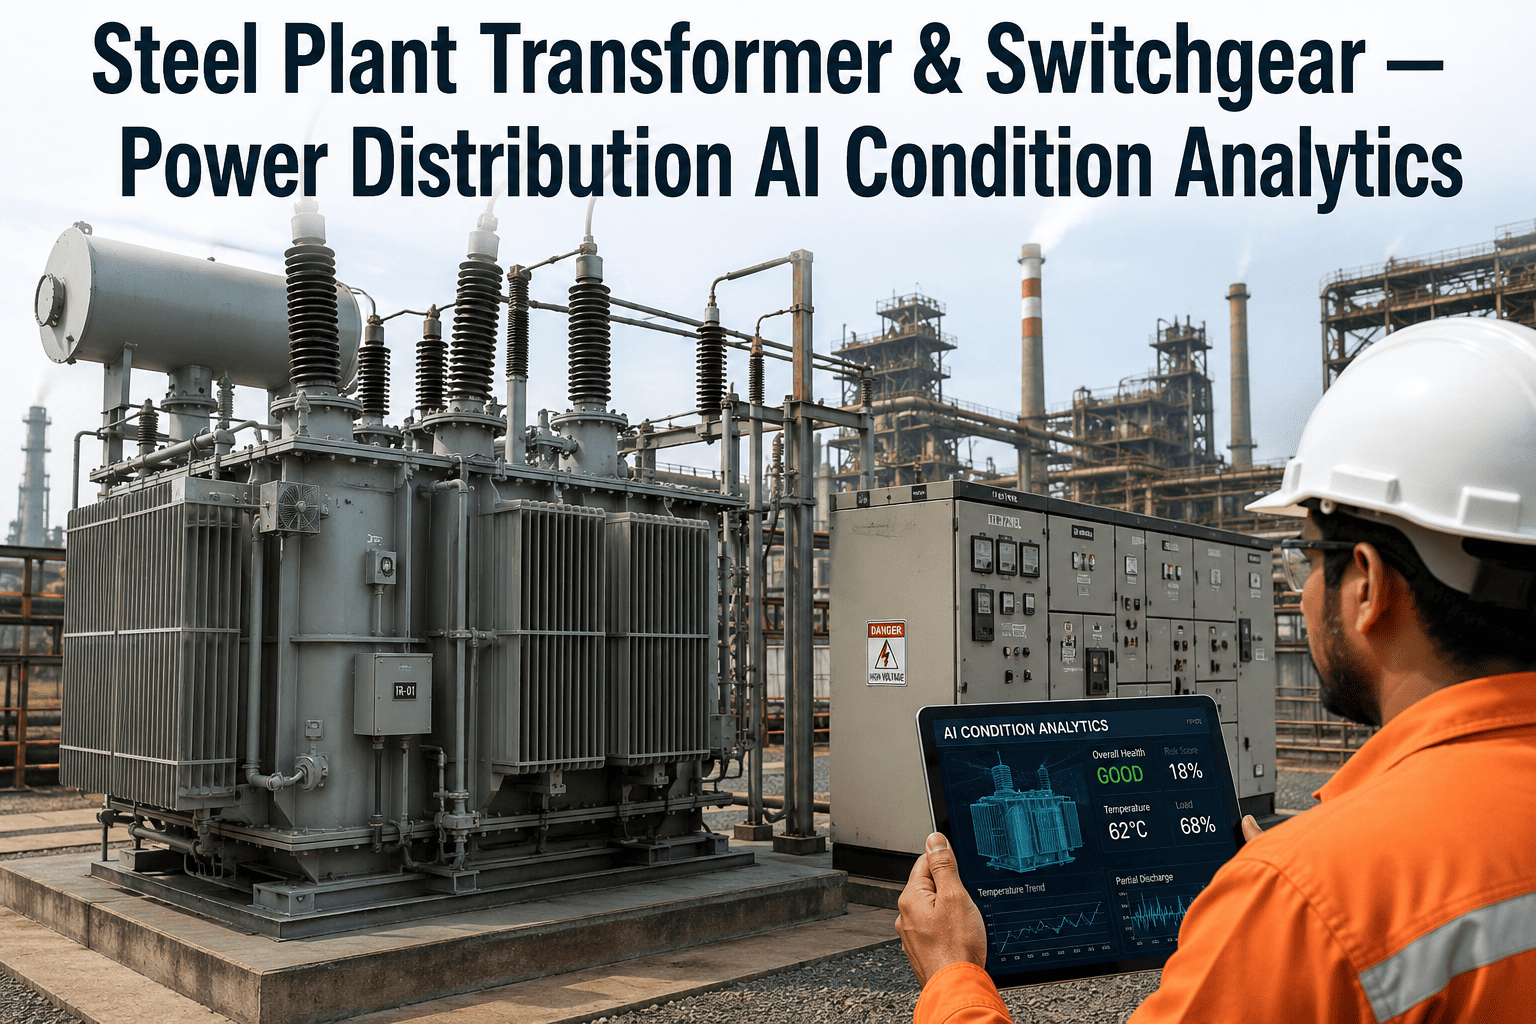
The electrical distribution system — 33 kV or 132 kV incoming supply, step-down transformers, medium-voltage switchgear, motor control centers, and power factor correction banks — is the nervous system of the steel plant. A single transformer failure can black out an entire production area for 48–96 hours while a replacement unit is sourced and energized. Distribution analytics focuses on dissolved gas analysis (DGA) for transformers, partial discharge monitoring for switchgear and cables, power quality tracking, and thermal imaging for connections and bus systems. The comparison below shows traditional versus analytics-driven distribution management.
Industrial Gas & Compressed Air Utility Analytics
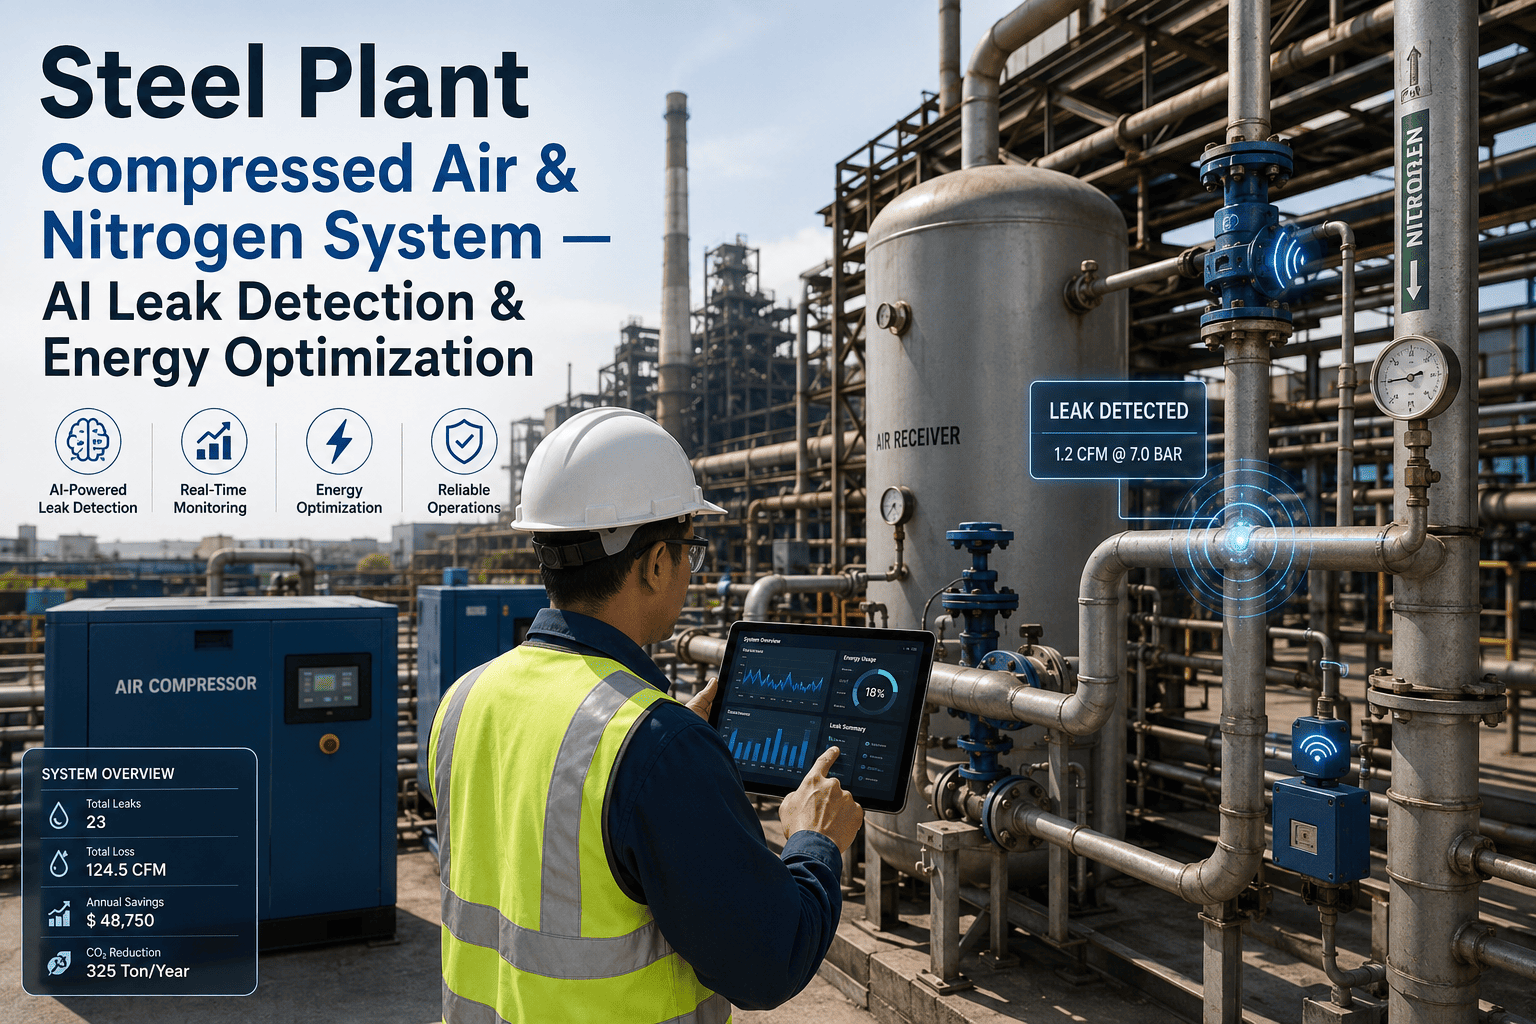
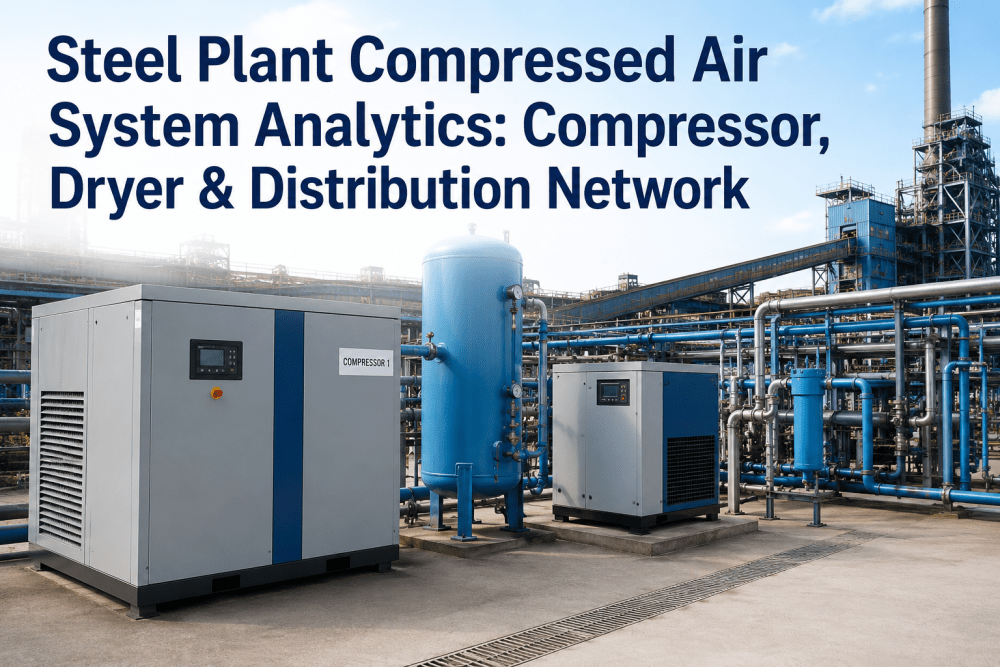
Steel plant utility systems extend beyond steam and electricity to include oxygen and nitrogen generation (ASU plants supplying BF and EAF operations), compressed air systems (instrument air and plant air at 7–10 bar), and DG sets providing emergency and peak-shaving power. Each of these systems has measurable performance parameters that degrade predictably and create quantifiable production risk when they fail. The utility system analytics table below covers the key parameters, targets, and control actions for each major utility.
| Utility System | Key Parameter | Target Range | Warning Limit | Control Action | Monitoring Frequency |
|---|---|---|---|---|---|
| ASU Oxygen Plant | O₂ Purity at Delivery | ≥ 99.5% O₂ | < 99.0% | Check column pressure ratio and air feed composition — inspect molecular sieves | Continuous (inline analyzer) |
| ASU Oxygen Plant | Specific Power Consumption | Per design kWh/Nm³ | +5% above design | Check air compressor efficiency — review distillation column ΔP | Daily (calculated) |
| Nitrogen System | N₂ Purity (inert blanket) | ≥ 99.99% N₂ | < 99.9% | Check PSA bed saturation — inspect inlet air dryer — review cycle timing | Continuous |
| Compressed Air (Instrument) | Dew Point at Point of Use | −40°C pressure dew point | > −20°C | Check regenerative dryer cycle — inspect desiccant — verify purge valve operation | Continuous (hygrometer) |
| Compressed Air (Plant) | System Leakage Rate | < 10% of generation | 10–20% | Ultrasonic leak survey — tag and repair all detected leaks within 30 days | Quarterly (ultrasonic audit) |
| Air Compressor | Specific Power (kW/scfm) | Per design curve | +8% above design | Check intake filter ΔP — inspect intercoolers — review valve condition | Weekly (calculated) |
| DG Set (Emergency) | Load Test Output at Rated Load | ≥ 95% rated kVA | 90–95% rated kVA | Check fuel injection timing — inspect turbocharger — review cooling system | Monthly (load test) |
| DG Set (Emergency) | Start-to-Full-Load Time | < 10 seconds | 10–20 seconds | Check battery health, governor response, and starting air system | Monthly (test start) |
Expert Review — What Top-Performing Steel Plants Do Differently
Best-in-class U.S. steel plants maintaining captive power availability above 98.5% follow five core utility analytics practices. First, they calculate and trend turbine heat rate against baseline on a rolling 7-day basis as a Level 2 KPI visible to both maintenance and energy management teams — not just the control room. Second, transformer DGA is monitored online with automated ratio analysis (Rogers Ratio or IEC 60599 method) rather than relying on annual oil sampling, giving 3–12 months of advance fault detection instead of weeks. Third, boiler tube UT inspection data is maintained as a living thickness trend log per measurement point rather than a pass/fail record, enabling remaining life estimation and planned replacement scheduling. Fourth, compressed air systems are audited ultrasonically every quarter with a tracked leak register — tagged, prioritized by flow loss, and cleared on a 30-day close-out cycle.
Conclusion
Steel plant power and utility systems typically show early warning signs before failure, but many mills lack analytics to turn these signals into maintenance actions. Common issues include boiler efficiency loss, turbine heat rate drift, transformer degradation, and compressed air leakage. Without predictive monitoring, plants face reactive maintenance, unplanned outages, and energy costs that can be 8–12% higher. Modern utility analytics combines historian data, condition monitoring, and CMMS integration to prioritize maintenance. By implementing continuous monitoring and predictive maintenance, mills can reduce downtime and recover hidden operational costs within a few quarters.
Frequently Asked Questions
What is the most important leading indicator for steam turbine maintenance scheduling in a steel plant captive power unit?
Heat rate deviation from baseline — calculated as BTU per kWh of output at a defined steam inlet and exhaust condition — is the most valuable leading indicator because it degrades measurably before any mechanical symptom appears. A 1.5% increase in heat rate on a rolling 7-day average at constant load conditions indicates early steam path fouling, seal wear, or nozzle erosion and should trigger inspection scheduling. By the time vibration or bearing temperature alarms activate, the mechanical condition is typically well advanced.
How frequently should dissolved gas analysis be performed on power transformers in a steel plant substation?
Annual DGA oil sampling — the historical standard — is insufficient for steel plant service conditions. High harmonic loading from arc furnaces, frequent load cycling from rolling mill duty, and the cost of an unplanned transformer failure justify either online DGA monitoring (preferred for transformers above 10 MVA or in production-critical service) or quarterly oil sampling with trend analysis. The key is not just absolute gas levels but rate of change: a transformer generating 50 ppm hydrogen that has been stable for two years is less concerning than one at 80 ppm that has grown 20 ppm in 90 days.
What compressed air leakage rate is acceptable in a steel plant, and how is it measured accurately?
The target leakage rate for a well-maintained steel plant compressed air system is below 10% of total generation capacity. Most plants without an active leak management program run at 20–35% leakage — a figure that at a 5,000 scfm system represents $90,000–$180,000 in annual energy waste. Accurate measurement uses one of two methods: the load/unload method (measuring the percentage of on-load time required to maintain system pressure with all production uses shut down — every 1% on-load time = approximately 1% system leakage) or ultrasonic detection using a calibrated 40 kHz detector to tag individual leaks by flow loss.
How do boiler feedwater chemistry parameters affect tube life and what are the most important parameters to monitor continuously?
Dissolved oxygen is the single most damaging feedwater parameter — even brief excursions above 20 ppb cause pitting corrosion on boiler tubes that accelerates wall thinning and concentrates stress at corrosion pits. pH below 8.0 shifts the protective magnetite layer toward corrosive iron oxide dissolution. Together, these two parameters account for the majority of boiler tube failures in steel plant captive power boilers. Both should be monitored continuously with inline instrumentation — amperometric D.O. analyzers at deaerator outlet and before economizer inlet, and continuous pH probes with automatic chemical dosing feedback.
What is the typical cost justification for implementing online utility analytics versus traditional scheduled maintenance at a U.S. steel plant?
The direct cost justification rests on three quantifiable categories. First, prevented unplanned outage cost: a single forced boiler outage at an integrated mill typically costs $800,000–$2.1 million in lost production, expedited repair labor, and emergency parts procurement. A single transformer failure in a production-critical substation runs $500,000–$1.5 million in replacement transformer, installation, and production loss. Online analytics that prevent one such event per year typically cover the entire utility analytics program cost with margin. Second, energy efficiency recovery: turbine heat rate drift of 3% on a 50 MW unit running at $0.065/kWh costs approximately $856,000 per year in excess fuel.