In the fast-paced world of textile manufacturing, every second of machine downtime or speed variation directly impacts profitability and delivery commitments. Traditional approaches rely on manual data logging or isolated sensor readouts, which often miss critical patterns hidden within Programmable Logic Controller (PLC) signals. A textile PLC data analytics platform bridges this gap by continuously capturing, processing, and visualizing machine-level data from looms, dyeing machines, finishing ranges, and winding equipment. This enables plant managers and maintenance teams to move from reactive firefighting to proactive, data-driven decision-making. By analyzing PLC signals such as cycle times, motor currents, temperature profiles, and fault codes, manufacturers can pinpoint root causes of performance degradation, predict impending failures, and optimize production schedules. The result is a measurable improvement in Overall Equipment Effectiveness (OEE) and a significant reduction in unplanned downtime. Book a demo to discover how iFactory's PLC integration transforms textile operations into smart, connected factories.
Unlock Real-Time Machine Intelligence
Stop guessing. Start optimizing. Get actionable insights from every PLC signal in your textile plant.
From Raw Signals to Actionable Metrics
Textile machines generate hundreds of PLC tags per second. Our platform ingests this data and calculates key performance indicators like machine state (running, idle, fault), speed efficiency, production count, and energy consumption. Each signal is contextualized with shift patterns, product recipes, and maintenance logs.
Real-Time Dashboards for Every Role
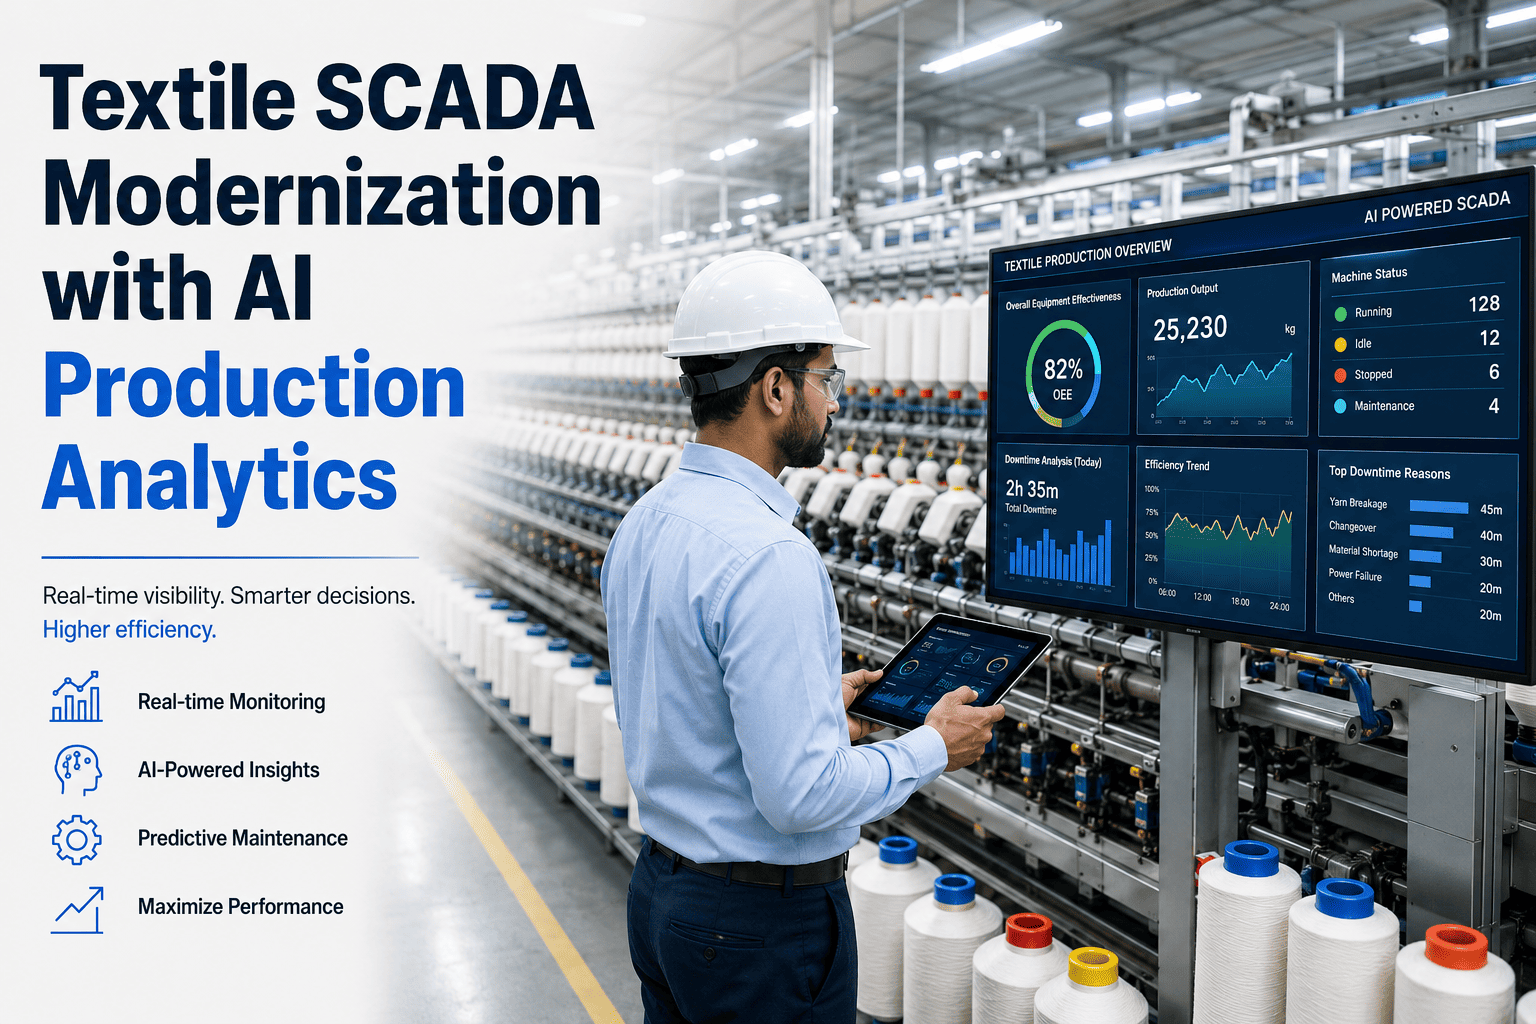
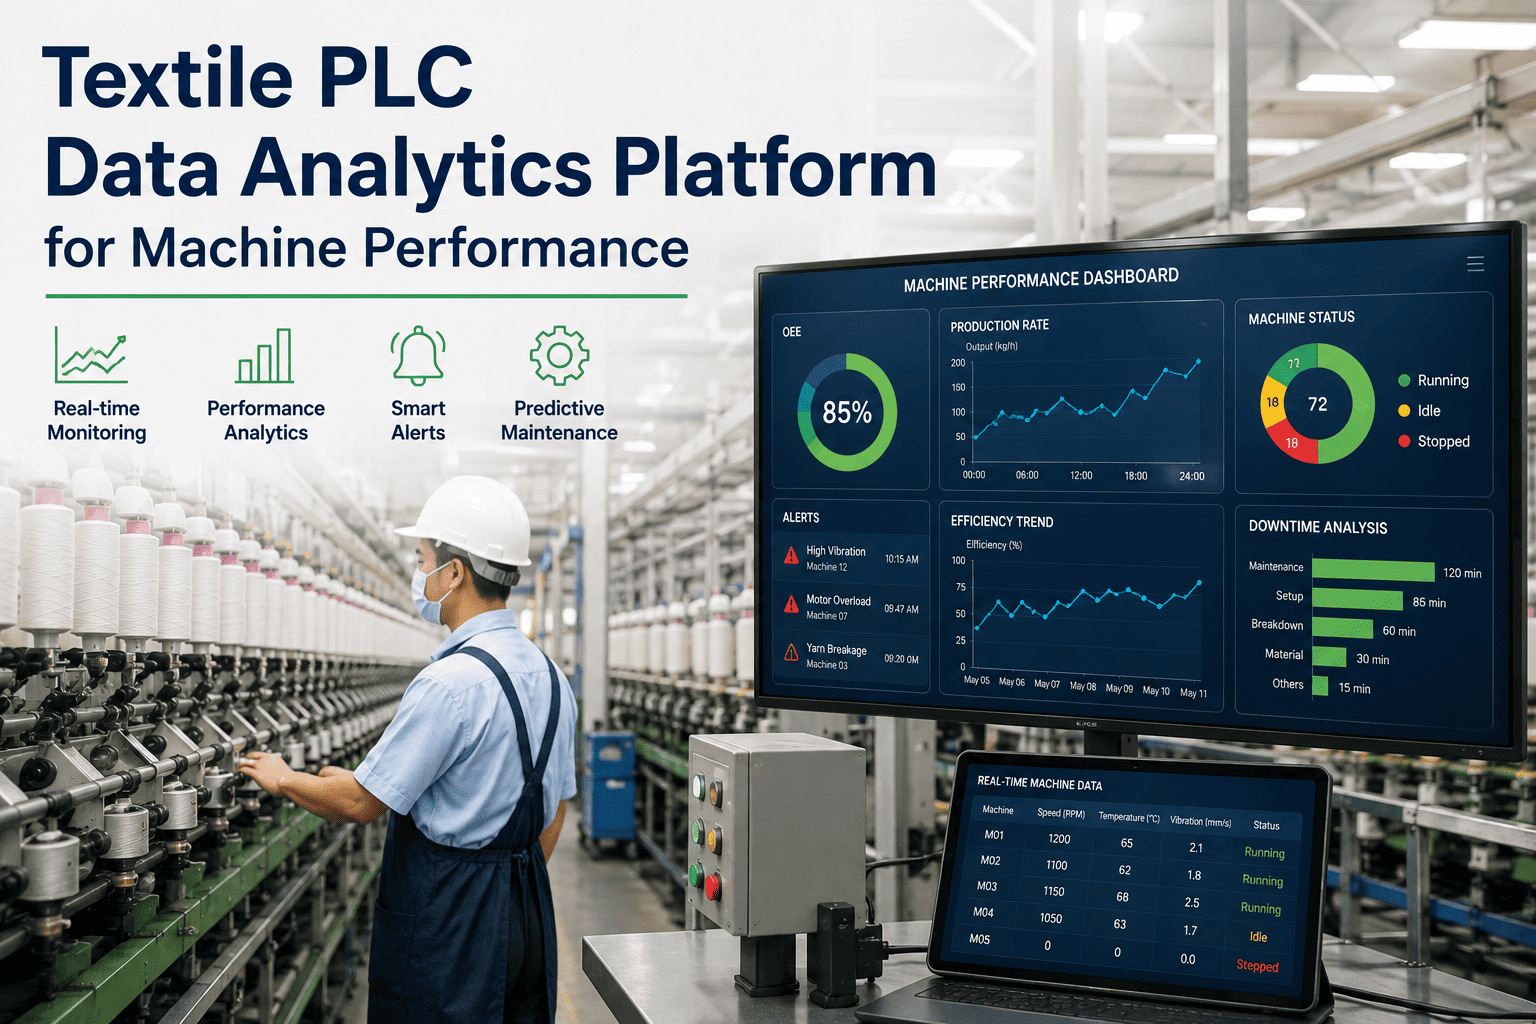
Operators see live machine status and alerts on shop-floor displays. Maintenance engineers get trend charts for motor vibration and temperature. Managers access aggregated OEE dashboards with drill-down to individual machines. All views are customizable and mobile-responsive.
Downtime Analytics
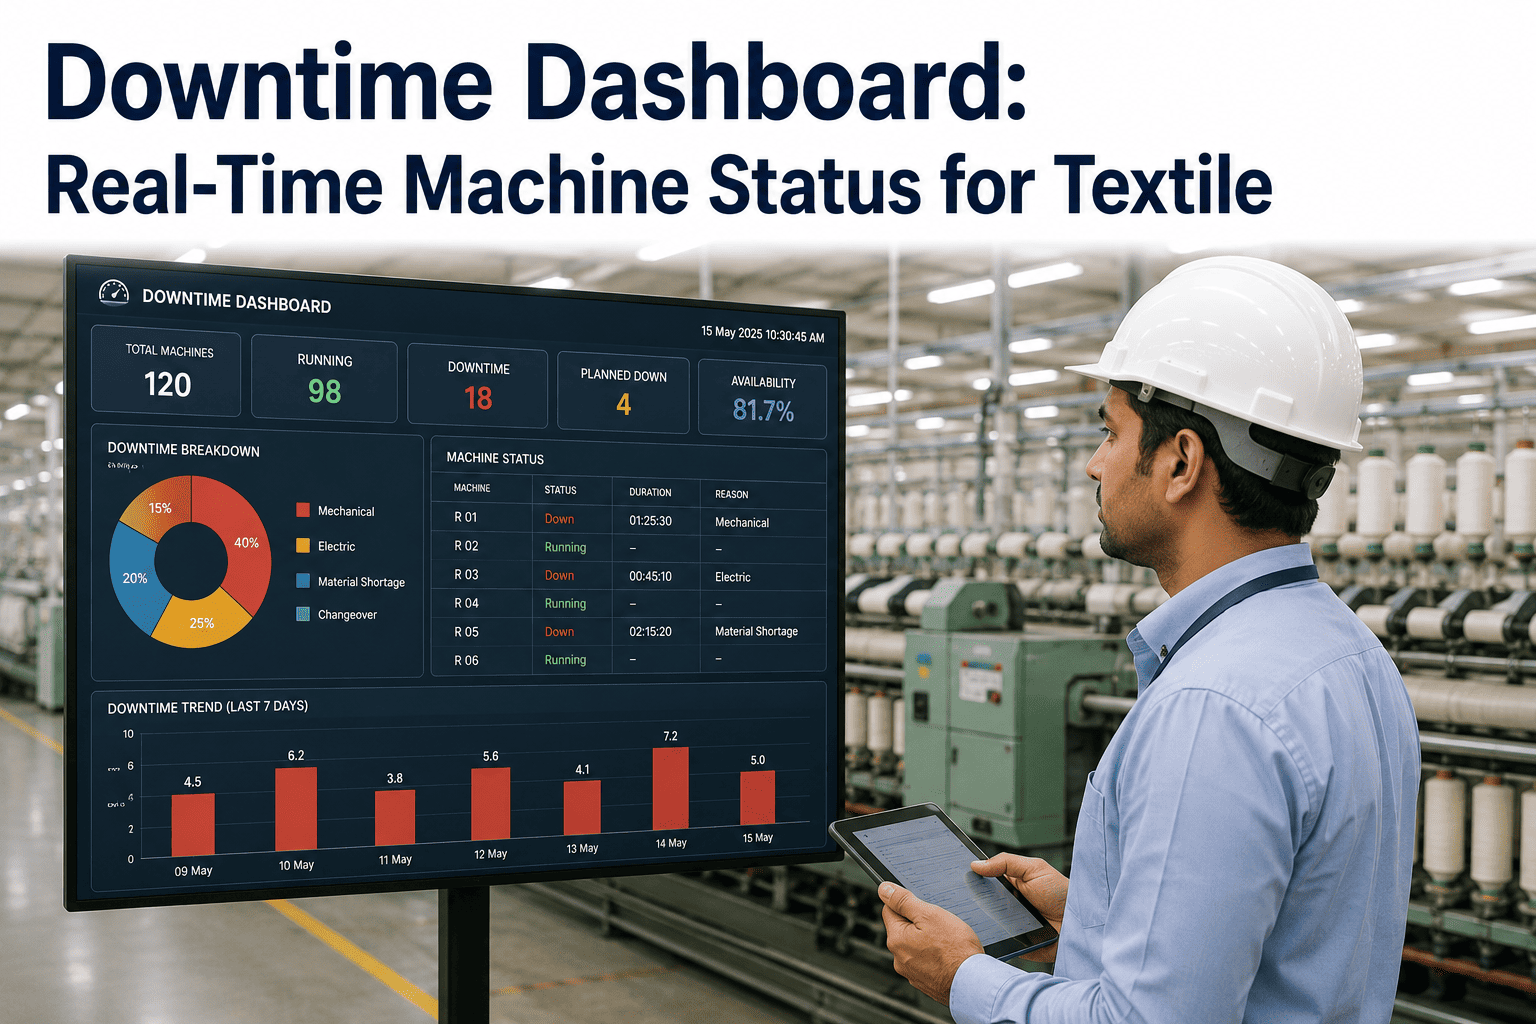
Categorize downtime by reason code (mechanical, electrical, material, operator) directly from PLC fault logs. Identify top loss contributors.
Speed Loss Monitoring
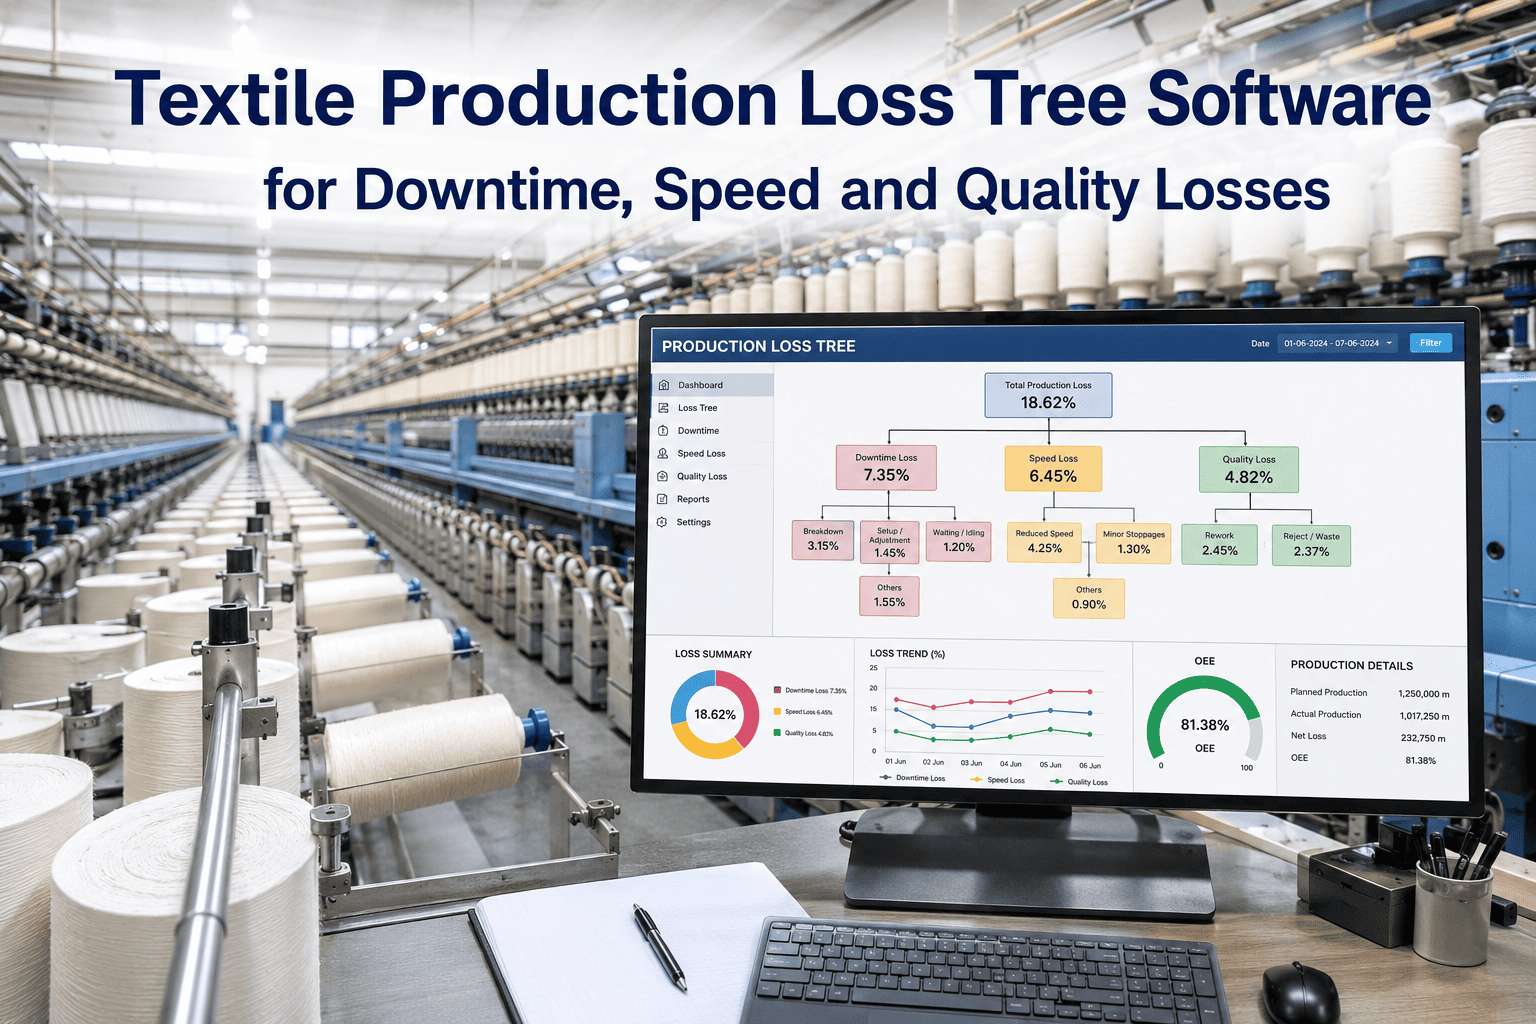
Compare actual machine speed against target speed from PLC drives. Detect gradual speed drops that indicate wear or suboptimal settings.
Quality Risk Prediction
Correlate PLC parameters (tension, temperature, humidity) with defect rates. Get alerts when conditions drift outside quality limits.
Energy Consumption
Track power usage per machine via PLC energy meters. Identify energy waste during idle states and optimize scheduling.
Implementation Timeline: 4 Weeks to Insights
Week 1: Discovery
Map existing PLC tags, network topology, and data sources. Define KPIs with your team.
Week 2: Integration
Deploy edge gateway to collect PLC data securely. Configure data mapping and transformation rules.
Week 3: Dashboards
Build real-time dashboards and alerts. Train operators and engineers on new views.
Week 4: Optimization
Analyze first-week data to fine-tune thresholds. Identify quick wins and set improvement targets.
Ready to Transform Your Textile Plant?
Join leading textile manufacturers who have reduced downtime by 85% and boosted OEE by 12% with iFactory.
Key PLC Signals and Their Business Impact
| PLC Signal | Insight Generated | Business Impact |
|---|---|---|
| Machine State (Running/Idle/Fault) | Real-time uptime/downtime tracking | Reduce unplanned downtime by 85% |
| Motor Current (Amps) | Load variation and wear detection | Prevent motor failures, extend lifespan |
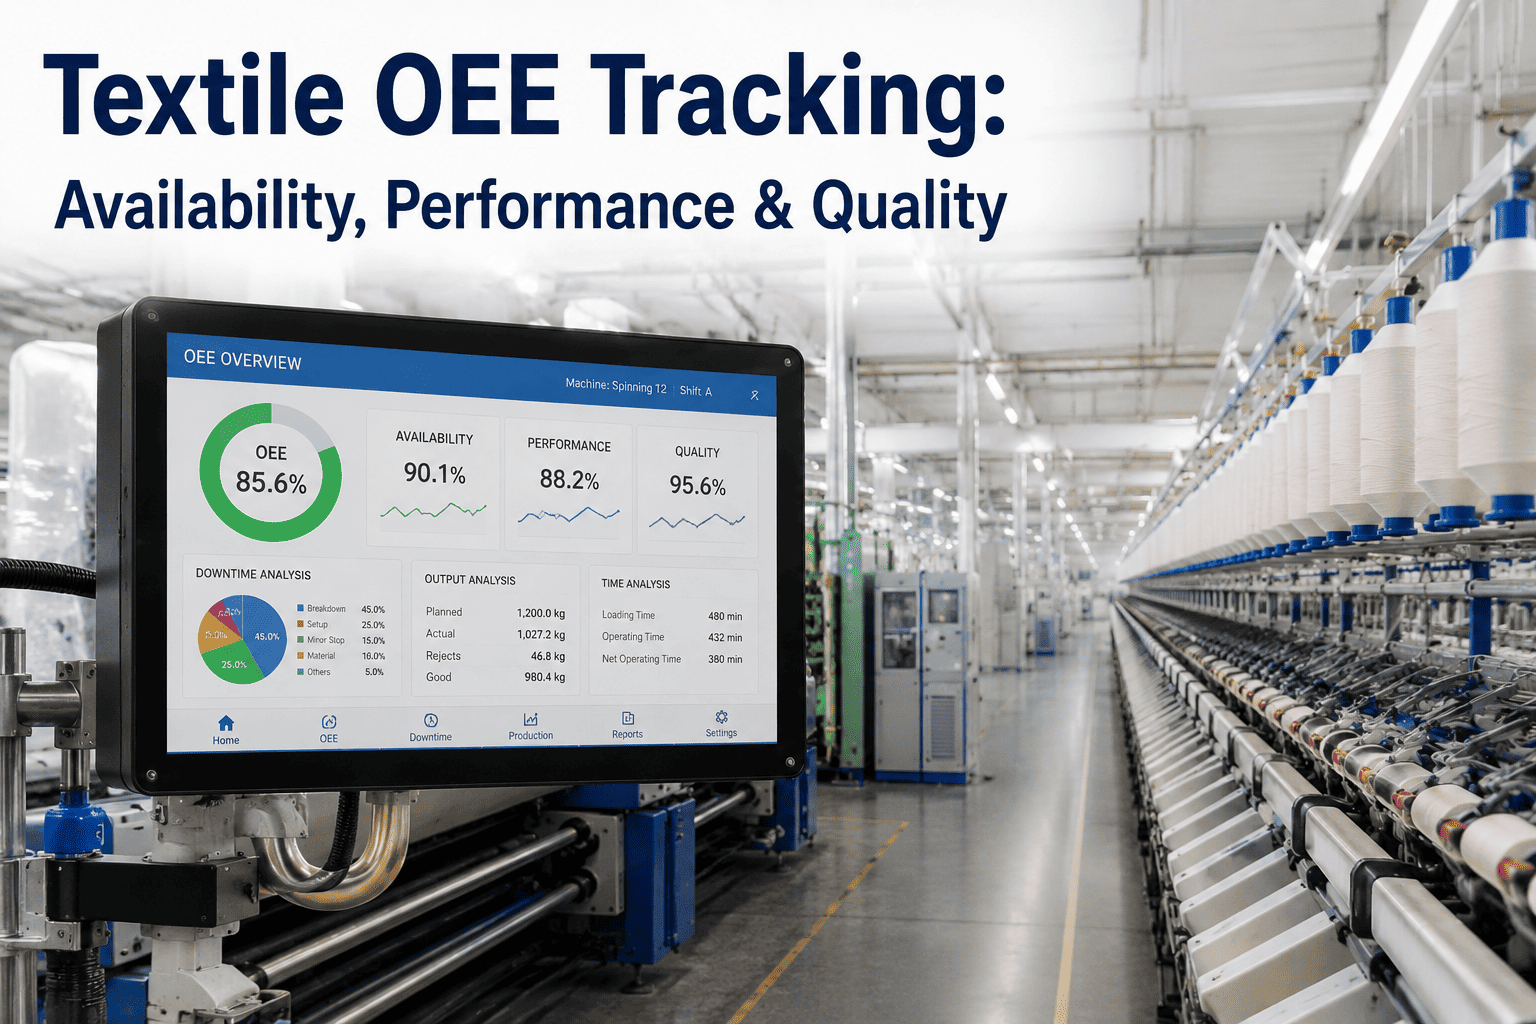
| Production Count (Pieces) | Actual vs. target output | Improve OEE by 12% |
| Temperature (Celsius) | Process stability and quality risk | Reduce defects by 25% |
| Fault Code | Root cause categorization | 3x faster root cause analysis |
Predictive Maintenance with AI
Our platform uses machine learning models trained on historical PLC data to predict component failures before they happen. For example, a gradual increase in motor current combined with temperature rise signals bearing wear. Alerts are sent to maintenance teams with recommended actions.
Seamless Integration with Existing Systems
iFactory connects to any PLC brand (Siemens, Allen-Bradley, Mitsubishi, Omron) via OPC-UA, Modbus, or native protocols. Data flows into a unified analytics layer without disrupting existing control systems. No additional hardware required.
Frequently Asked Questions
How does the platform handle multiple PLC brands in one plant?
Our integration layer supports simultaneous connections to different PLC protocols. We use a universal data model that normalizes signals from Siemens, Allen-Bradley, Mitsubishi, and Omron into a common schema. This means you can mix and match machines without custom coding. The platform also handles different data rates and network topologies. For more details on multi-vendor setup, visit our Support page for integration guides.
What is the typical ROI for a textile plant using PLC analytics?
Customers typically see a payback period of 3-6 months. The main drivers are reduced unplanned downtime (average 85% reduction), improved OEE (12% increase), and lower maintenance costs through predictive alerts. For example, one weaving mill saved $120,000 annually by preventing major loom failures. Energy savings from idle detection add another 5-8% reduction in power costs. Check our Support page for detailed case studies.
Is the platform secure and compliant with industry standards?
Yes, we follow strict cybersecurity practices. All PLC data is encrypted in transit using TLS 1.2+ and at rest using AES-256. The edge gateway is read-only from the PLC side, ensuring no control commands can be sent accidentally. We are compliant with ISO 27001 and GDPR. Role-based access control lets you define who sees what data. For a full security whitepaper, visit our Support page.
Can the platform analyze historical PLC data for trend analysis?
Absolutely. We store all raw PLC signals with high-frequency timestamps (up to 10ms resolution) in a time-series database. You can query historical data to identify long-term trends, seasonal patterns, or compare performance across shifts. The platform automatically generates weekly and monthly reports with charts for speed, downtime, and quality metrics. For custom report requests, our team can help via the Support page.
How long does it take to deploy the platform in a textile plant?
Typical deployment takes 4 weeks from discovery to full operation. Week 1 involves mapping your PLC network and defining KPIs. Week 2 is edge gateway installation and data connection. Week 3 focuses on dashboard configuration and user training. Week 4 is optimization based on real data. For plants with complex networks, we offer extended support. Get started by booking a demo or visiting our Support page for pre-deployment checklists.
Start Your Smart Factory Journey Today
Take the first step toward data-driven textile manufacturing. Our experts are ready to help you unlock the full potential of your PLC data.