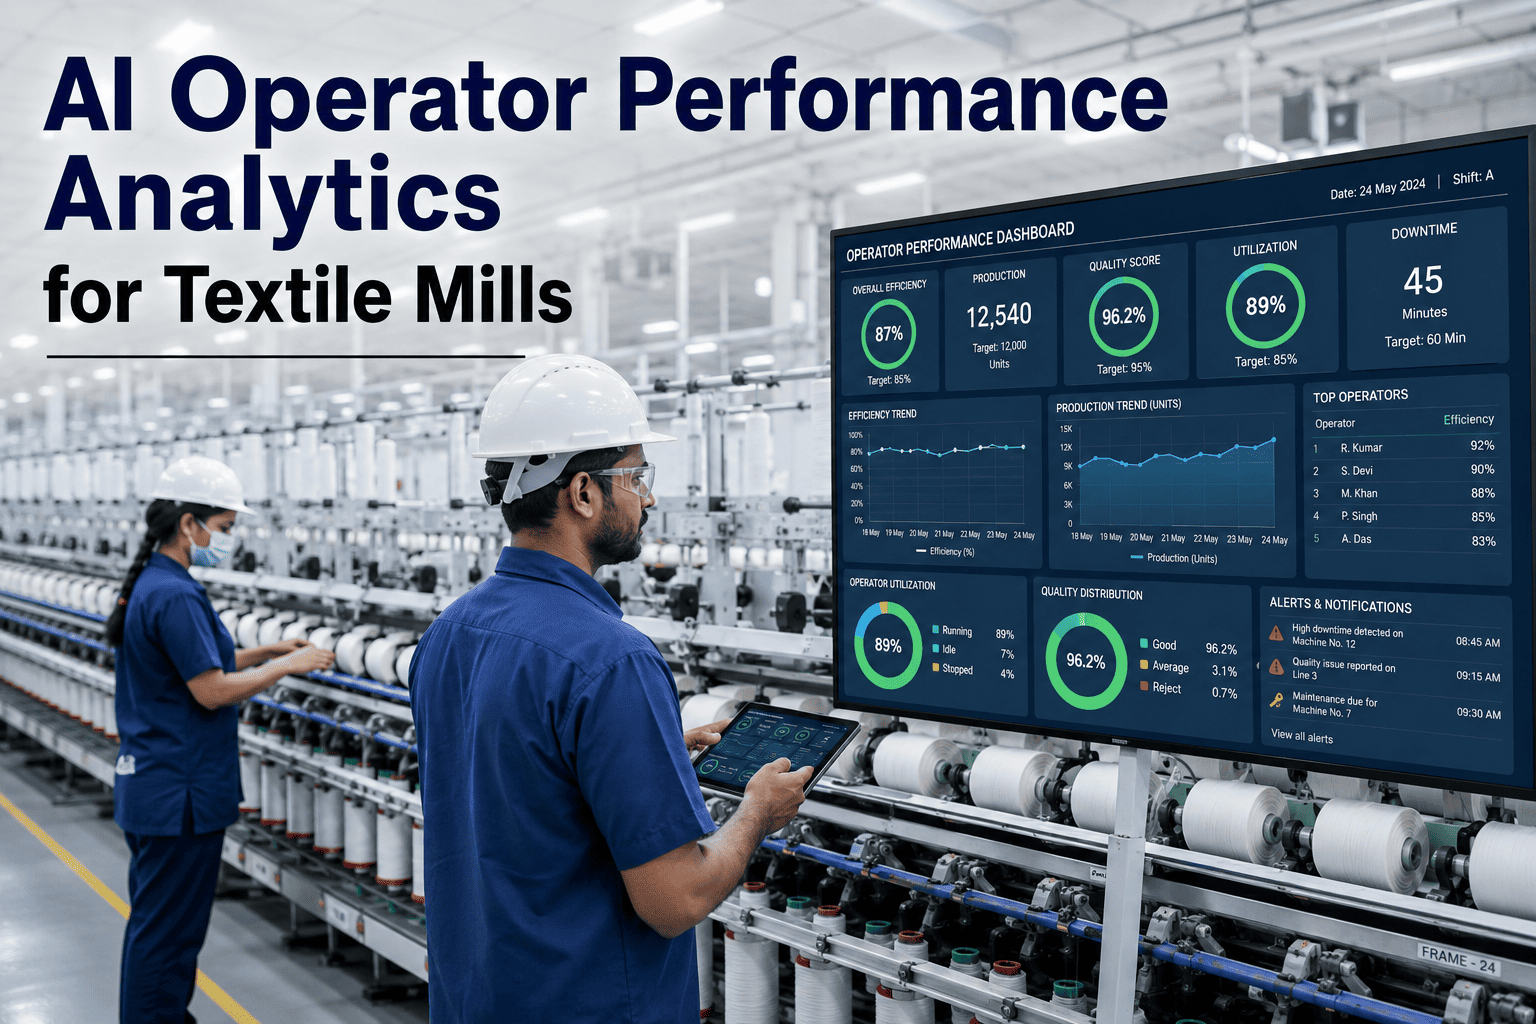
Most textile mills can tell you their machine efficiency down to the decimal, but ask which operator consistently hits SOP timing on doffing and most plants go quiet. Operator performance has stayed the one variable mills track on paper logs while everything else on the floor gets a dashboard. That gap matters because two operators running the same frame under the same conditions can produce meaningfully different output, waste, and rework, and without visibility, coaching becomes guesswork instead of a targeted fix. AI operator analytics closes that gap by pairing machine-level output data with shift, operator ID, and SOP adherence, turning workforce performance into something a supervisor can actually manage rather than something they infer after the fact. Mills that want to see this scoring against their own floor data can book a demo.
WORKFORCE ANALYTICS · TEXTILE OPERATIONS
Turn Operator Performance Into a Number You Can Coach Against
AI operator analytics connects machine output, SOP adherence, and skill data to every shift, so productivity gaps stop hiding in paper logs and start showing up on a dashboard your supervisors actually use.
87
Adherence Score
Live SOP adherence score for a spinning shift, scored against the mill's own baseline
Why Productivity Gaps Stay Invisible on the Mill Floor
Machine-level OEE dashboards are common in textile plants now, but they answer the wrong question when output drops on one frame during one shift. A dip could come from yarn quality, a mechanical issue, or an operator running behind SOP timing on piecing and doffing, and without operator-linked data, supervisors end up guessing which one it is. That guesswork usually defaults to blaming the machine, which means the actual skill gap or training need never gets addressed and the same shift keeps underperforming month after month.
The deeper issue is that paper logs and verbal handovers were never designed to capture individual performance trends over time. A supervisor might notice one operator seems slower on changeovers, but without a running record, that impression never becomes a measurable pattern, and a measurable pattern is what actually justifies a training investment or a shift reassignment. AI operator analytics exists specifically to close that measurement gap, not to replace the judgment supervisors already bring to the floor.
SEE IT ON YOUR FLOOR DATA
Watch Operator Scoring Run Against a Real Shift
A working session using your own machine and shift structure, not a generic sample dataset.
A Role-Level View, Not Just a Plant-Wide Average
A single plant-wide productivity number hides more than it reveals, since a doffer, a piecer, and a machine tender are measured against completely different SOP timings and output expectations. Role-level scoring gives supervisors a comparison that actually means something, showing where a specific role on a specific shift is drifting from standard.
Doffing Operators
91
SOP timing adherence across doffing cycles, tracked against the standard changeover window.
Piecing Operators
78
Break response and piecing speed measured against target reconnection time per position.
Machine Tenders
84
Preventive check completion and quality flag response rate across assigned frames.
Winding Operators
89
Package quality consistency and changeover speed against the winding SOP standard.
A Rollout Built Around Weeks, Not a Big-Bang Switch
Mills that try to launch operator analytics plant-wide on day one usually end up with messy data and skeptical supervisors. A phased rollout gives the system time to learn each shift's baseline while giving supervisors time to trust what the dashboard is telling them before it becomes part of their daily routine.
Week 1-2
Machine-to-operator mapping and digital SOP checkpoints are configured for one pilot line.
Week 3-4
Baseline scoring runs in the background while supervisors review early output alongside their own judgment.
Month 2
Coaching conversations start referencing the dashboard directly, and the pilot line expands to the full shift.
Month 3+
Additional lines and shifts are added using the same configuration template built during the pilot.
PLAN YOUR ROLLOUT
Map a Phased Rollout for Your Own Lines
Talk through a pilot line and timeline that fits your current shift structure.
What an Unaddressed Skill Gap Actually Costs
A five to eight percent output gap on one shift sounds small until it's multiplied across every day that gap goes unaddressed. Mills running AI-driven workforce analytics and automation have reported productivity gains of 20 percent or more, which reflects how much output was previously being lost to exactly this kind of invisible, uncoached variation between operators, shifts, and lines. The cost isn't just the lost output either, it's the training budget spent on generic sessions that don't target the operators or SOP steps actually driving the gap.
What a Plant Manager Told Us
We had OEE dashboards for years and still couldn't explain why the same frame produced differently across three shifts. Once we could see operator-level SOP adherence next to the output numbers, the pattern was obvious within a week, and it wasn't a machine problem at all.
Plant Manager, Spinning Division
How It Fits Alongside Your Existing Systems
Operator analytics is built to sit on top of the shop floor systems a mill already has, not replace them. Machine and shift data usually comes from existing MES or IoT infrastructure, digital SOP checkpoints get built from documents your quality team already maintains, and the resulting dashboard is where all of it comes together at the operator level for the first time. Nothing about this requires ripping out a system that's already working.
Frequently Asked Questions
Does this replace our existing MES or ERP shop floor system?
No, operator analytics sits alongside your existing shop floor systems and pulls machine, shift, and output data from them rather than replacing anything already installed. It adds the operator-level layer that most MES and ERP systems don't track natively, turning existing data into workforce insight without a system migration. Teams evaluating fit with their current stack can book a demo to walk through integration.
How is operator performance actually measured?
Performance is scored by combining machine output tied to that operator's shift with adherence to digital SOP checkpoints for tasks like doffing, piecing, and changeovers. This gives a fuller picture than raw output alone, since two operators can hit similar output numbers while one follows SOP timing consistently and the other does not. The scoring model is calibrated to each mill's own historical baseline rather than a generic industry number, and it's re-calibrated as product mix or line configuration changes.
Will operators feel like they're being surveilled?
Most mills introduce this as a coaching tool rather than a monitoring tool, and framing matters for adoption. Supervisors use the data to identify who needs training on a specific SOP step rather than to single people out, and many plants share aggregate shift trends with operators themselves so the data becomes something they can act on too. Questions on rollout communication can go through support.
How long before we see usable skill gap data?
Most mills see the first meaningful patterns within two to three weeks once machine-to-operator mapping is in place, since output and SOP data start comparing across shifts almost immediately. Deeper skill trend data, useful for structuring formal training plans, typically builds up over one to two full production cycles as seasonal and product mix variation gets accounted for in the baseline.
Can this work across multiple mill locations with different SOPs?
Yes, each location's SOP library is configured independently since spinning, weaving, and finishing operations often have different checkpoints even within the same company. Corporate teams can still roll up performance trends across locations for benchmarking, while each plant manager sees data specific to their own floor and SOPs. A demo can show both the plant-level and multi-site views.
STOP GUESSING WHERE OUTPUT IS LOST
Put a Number on Every Operator's Performance
See how the scoring model applies to your own shifts, machines, and SOPs.