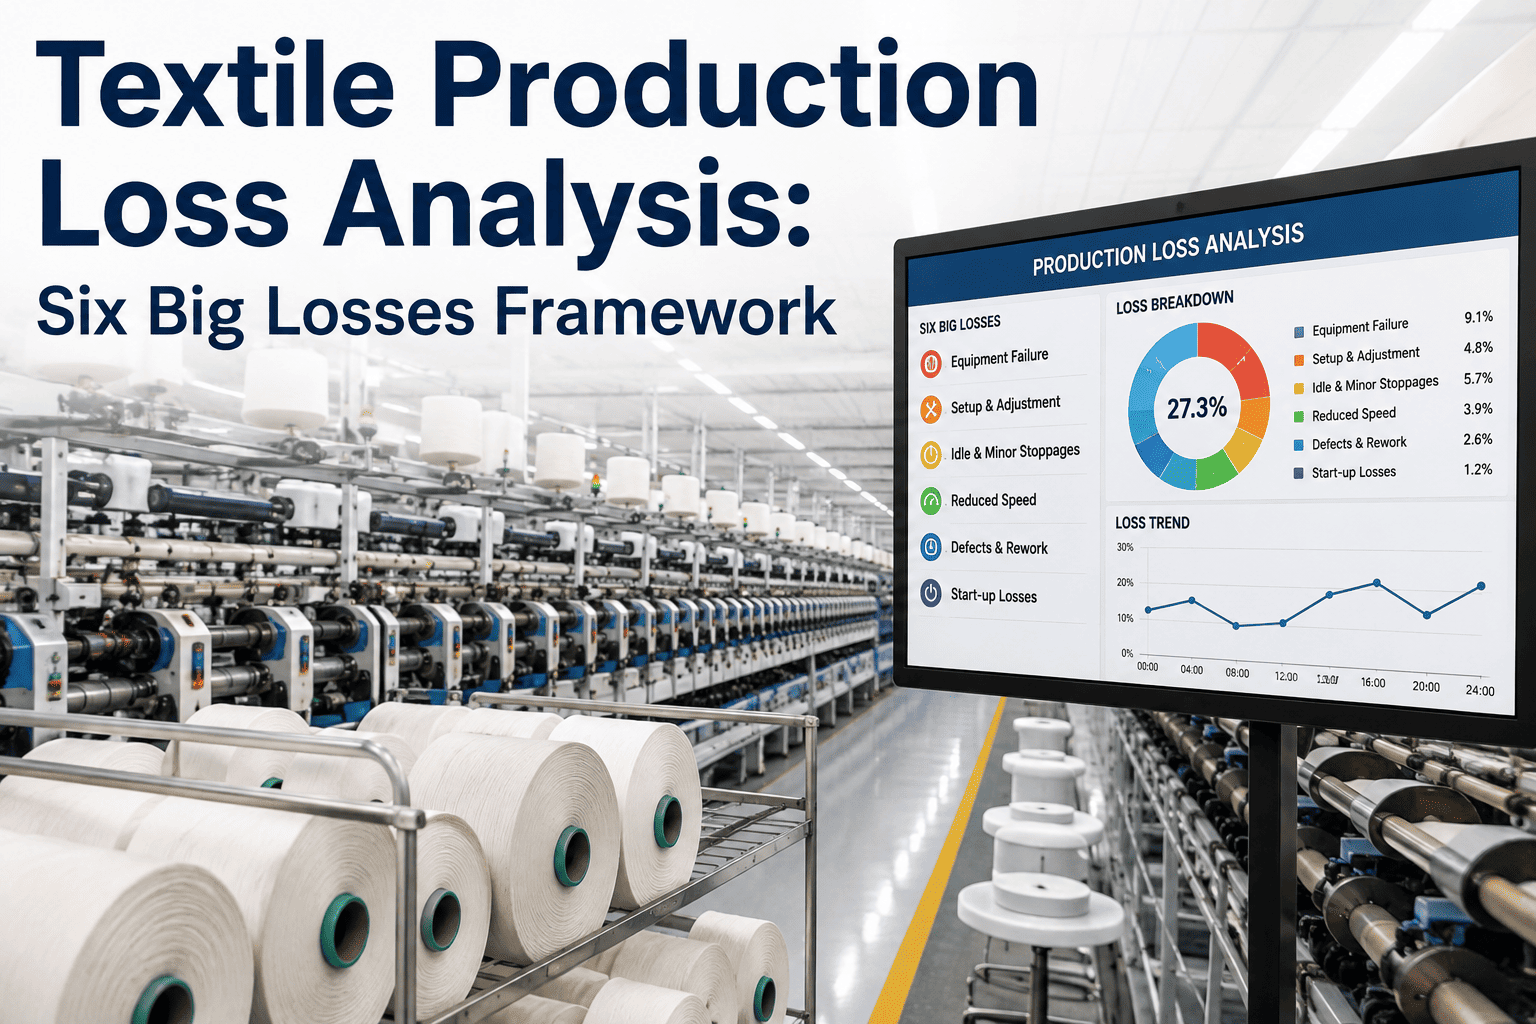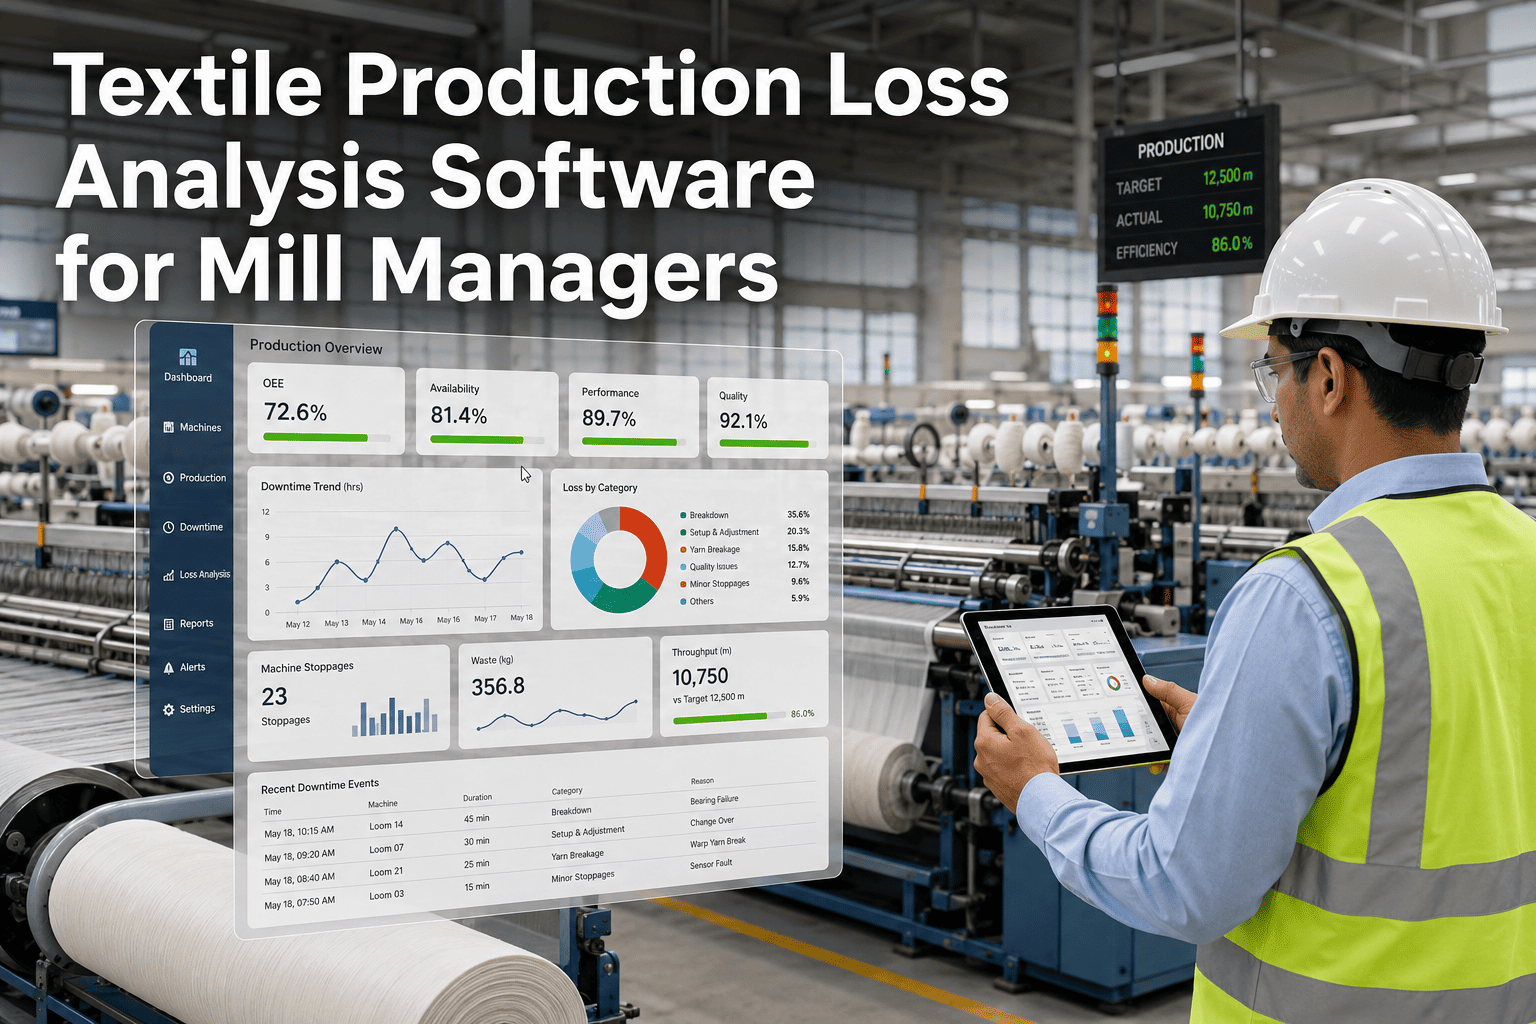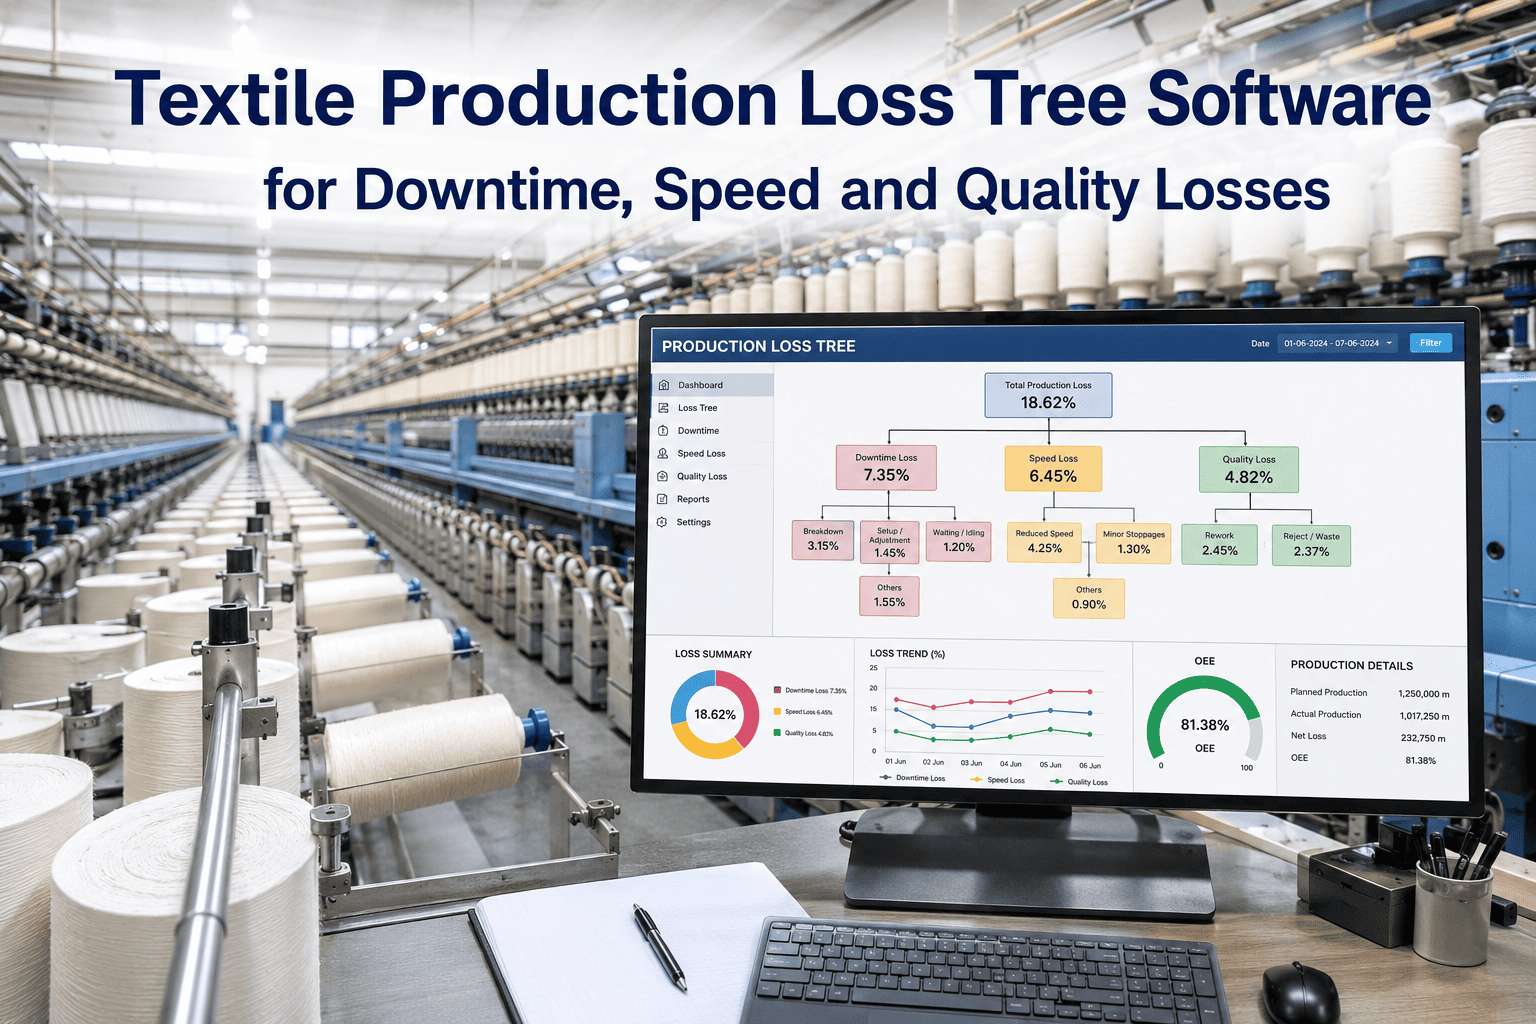
Ask a plant manager why OEE sits at 68% and you will usually get one answer: "downtime." Ask which downtime, on which machine, during which shift, and how much of the remaining loss is actually speed loss or quality loss instead, and the answer gets vague fast. That vagueness is expensive, because a mill that cannot separate a microstop problem from a changeover problem from a quality problem ends up throwing improvement effort at the wrong target for months. A production loss tree fixes this by breaking total available time down into every category of loss, mechanically, from live machine data, and iFactory builds that tree automatically across spinning, weaving, knitting and finishing lines. Book a loss tree walkthrough to see your own lines broken down this way.
Find Out Exactly Where Your OEE Is Actually Going
iFactory builds a live loss tree for every line, separating downtime, microstops, speed loss, quality loss, rework and waste automatically, so improvement teams stop guessing and start targeting the biggest number.
Why "We Have a Downtime Problem" Is Rarely the Whole Story
Total available time on any textile line splits into planned time, run time, and every category of loss in between. Most mills track the big, obvious downtime events well because they show up on a maintenance log. What gets missed is everything smaller: microstops under five minutes, speed running below rated capacity, and quality losses that never get separated from the downtime bucket they get lumped into by default.
See Your Real Loss Breakdown, Not an Estimate
Bring one line's recent downtime and quality logs to the call and iFactory will show you what the full loss tree looks like once every category is separated out.
How the Loss Tree Builds Itself From Machine Data
The categories above are not filled in manually by an operator at the end of a shift. Each layer of the tree is calculated automatically from data the line is already generating.
Machine Signal Capture
PLC and sensor data streams continuously from spinning frames, looms, knitting machines and finishing lines, capturing every stop and speed deviation as it happens.
Automatic Categorization
Each stop is classified against a reason code library specific to your process, separating planned changeover from unplanned breakdown from a microstop under five minutes.
Quality Loss Linkage
Rework, scrap and startup reject data joins the tree as its own branch, rather than being buried inside a generic downtime category.
Ranked Loss Dashboard
The tree surfaces the single largest loss category per line, per shift, so the next improvement project targets the real bottleneck instead of the most visible one.
Manual OEE Tracking vs Automated Loss Tree
| Factor | Manual OEE Log | iFactory Loss Tree |
|---|---|---|
| Microstop capture | Rarely logged, under 5 min ignored | Captured automatically from signal data |
| Loss categorization | Lumped into general downtime | Split into downtime, speed and quality |
| Update frequency | End of shift, by hand | Continuous, live per stroke or cycle |
| Root cause ranking | Based on memory of recent events | Ranked automatically by actual time lost |
Impact After the Loss Tree Goes Live
Frequently Asked Questions
Do we need new sensors on every machine, or does this work with our existing PLCs?
Most mills already have PLC or basic sensor data available on modern spinning, weaving and knitting equipment, and the loss tree connects to that existing data through standard industrial protocols. On older machines without digital signal output, lightweight sensors can be added during the pilot to capture stop and speed events without replacing the machine controller. The scope of additional hardware, if any, is assessed line by line during the initial walkthrough.
How does the system know the difference between a planned changeover and an unplanned breakdown?
The system is configured with your production schedule, so stops that align with a scheduled changeover, style change or maintenance window are categorized as planned automatically. Any stop outside that scheduled window is treated as unplanned and further classified by duration and pattern, distinguishing a genuine breakdown from a short microstop that repeats frequently, which usually points to a different root cause entirely.
Can the loss tree be broken down by shift, operator or specific machine?
Yes. The dashboard supports filtering by line, machine, shift and time period, so a plant manager can compare whether a speed loss pattern is specific to one shift's operating practice or consistent across all shifts on that machine. This level of drill-down is usually what turns a general OEE number into an actionable improvement target for a specific team or piece of equipment.
Does this integrate with the continuous improvement or Kaizen process we already run?
Yes, the ranked loss categories are designed to feed directly into whatever improvement methodology your team already uses, whether that is a formal Kaizen program or a simpler weekly review. Instead of starting an improvement meeting by debating which loss matters most, the team starts with a ranked list backed by measured data and spends the meeting on solutions instead of diagnosis. Talk to a specialist about fitting this into your existing improvement cadence.
How long before we see a working loss tree on a pilot line?
Most single-line pilots go live within four to six weeks, covering signal integration, reason code configuration specific to your process, and dashboard setup. The tree starts producing useful data from the first week of live signal capture, with the categorization refined as the team validates reason codes against what they see on the floor. Book a scoping call to get a timeline for your specific line.
Stop Improving the Loss You Can See and Start Fixing the One That Costs the Most
A downtime log that lumps microstops, speed loss and quality loss into one bucket will always point improvement teams at the wrong problem. An automated loss tree separates every category from live machine data, ranks them by actual time and cost impact, and gives your improvement team a target that is backed by data instead of the loudest complaint in this week's production meeting. Talk to iFactory about what your own lines look like once the loss tree is built.