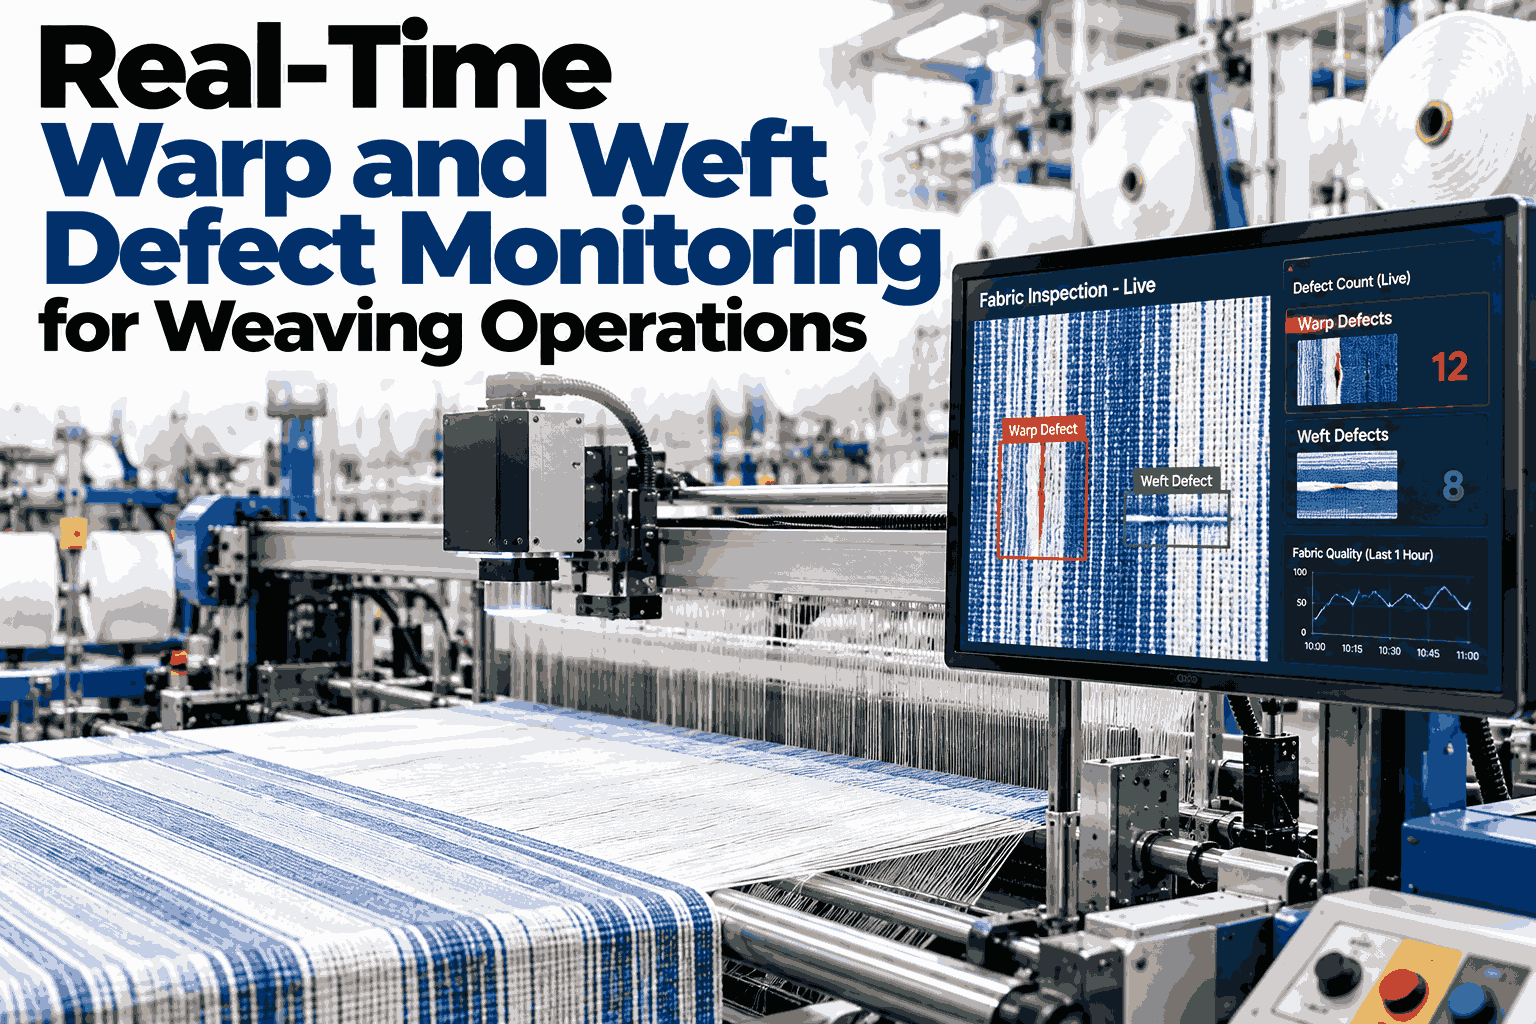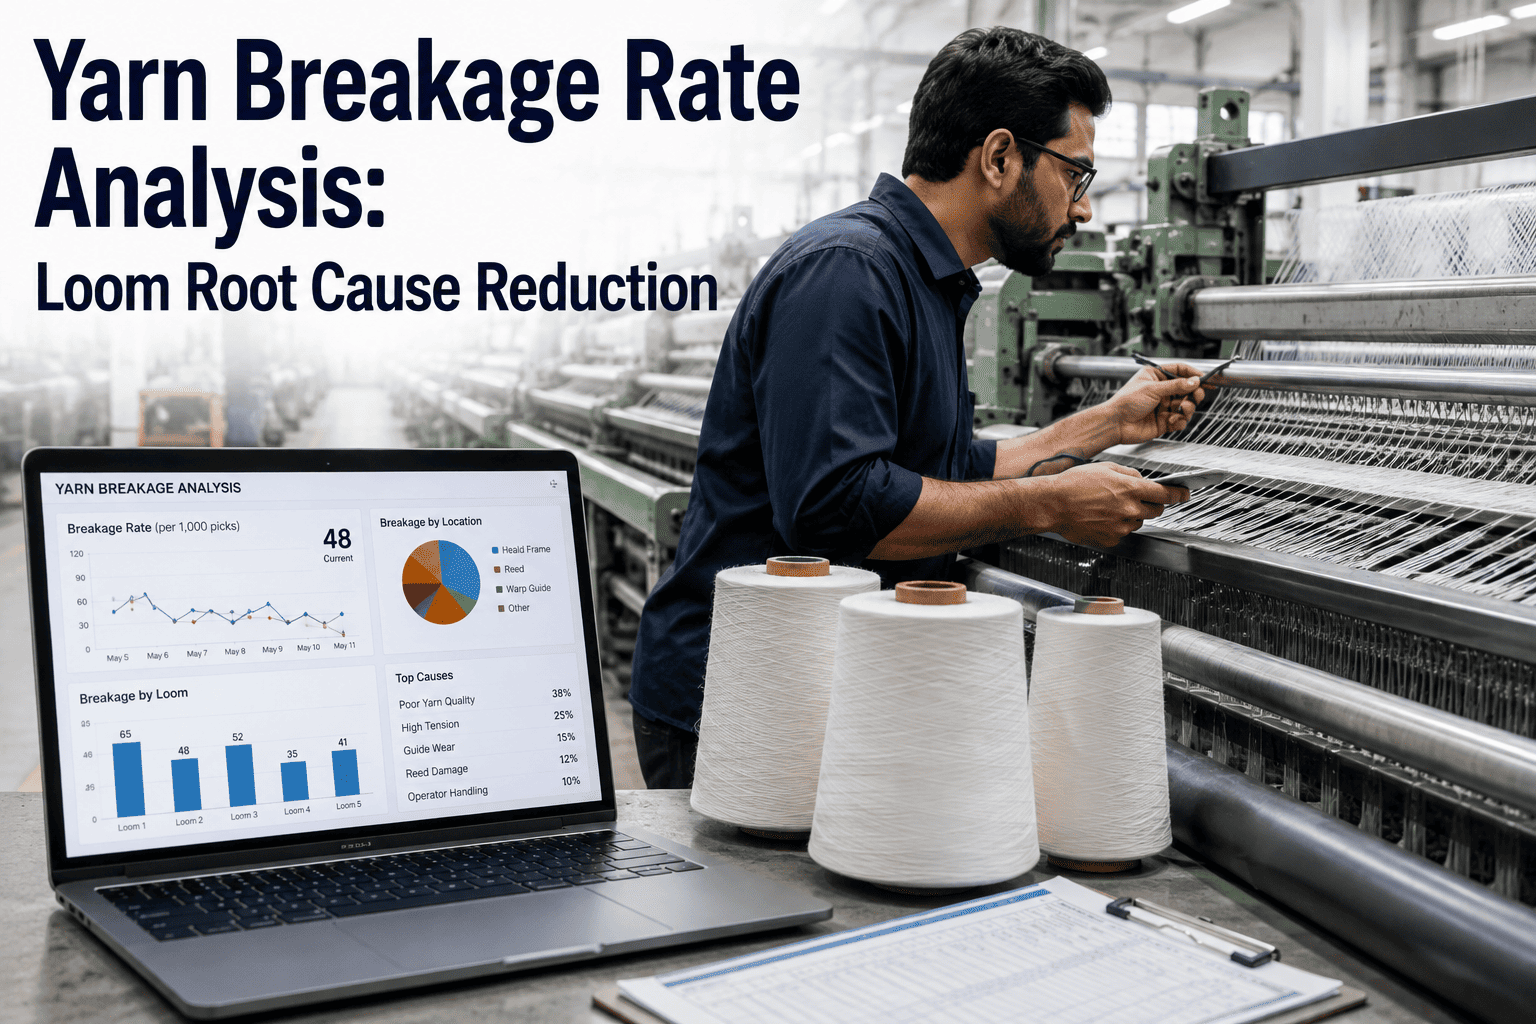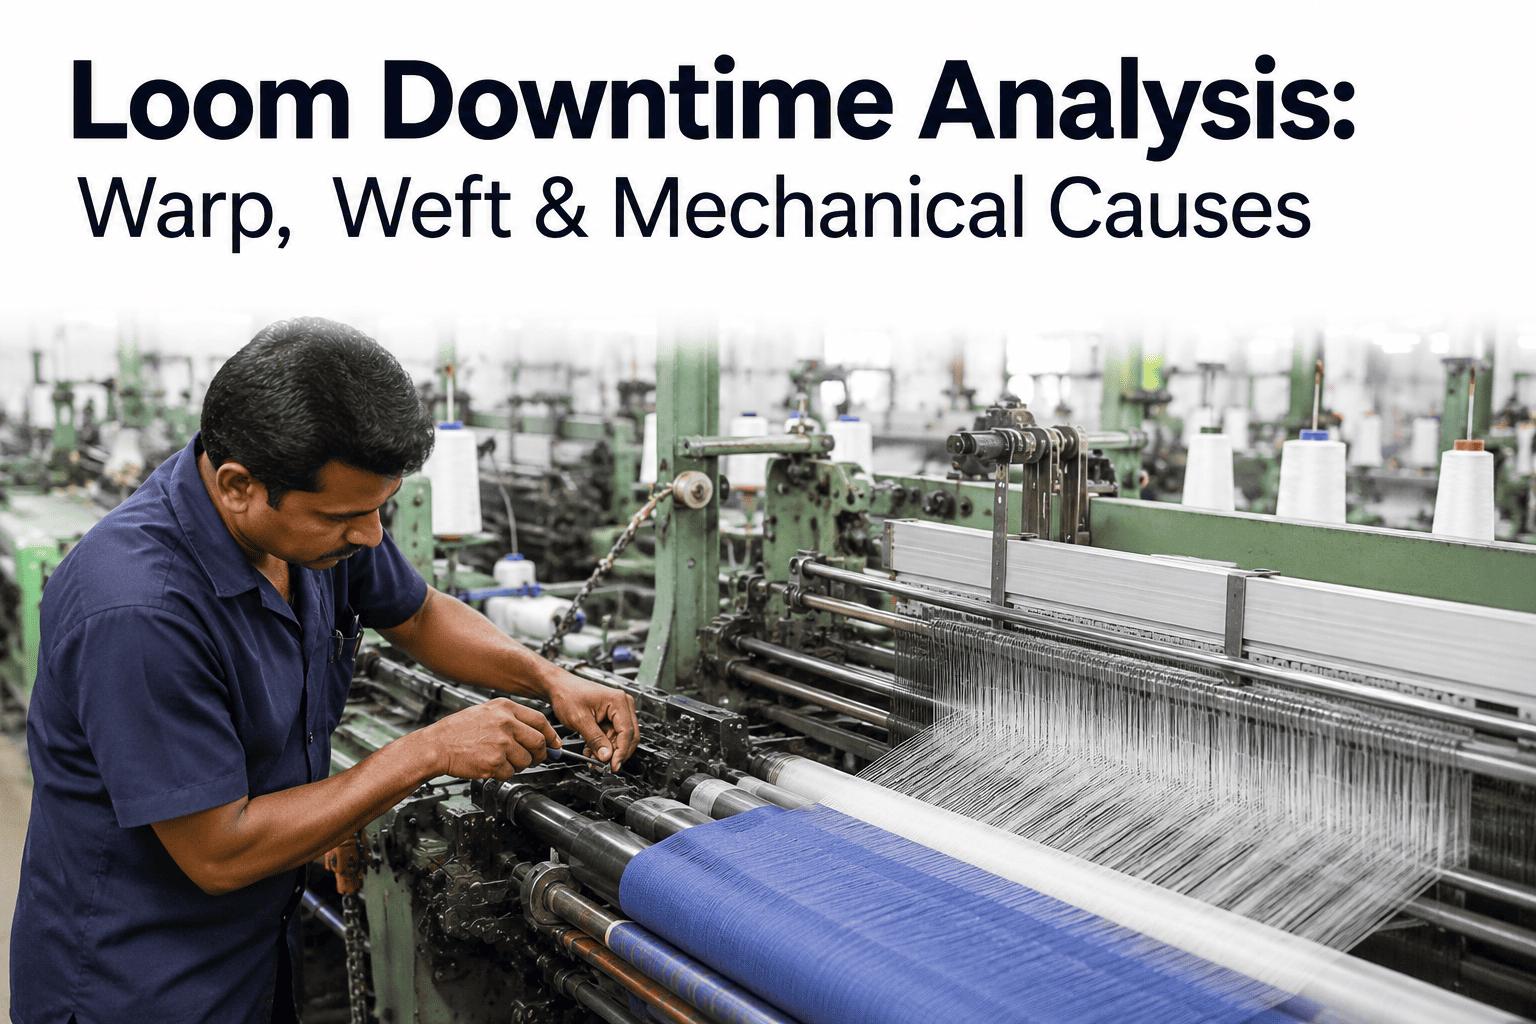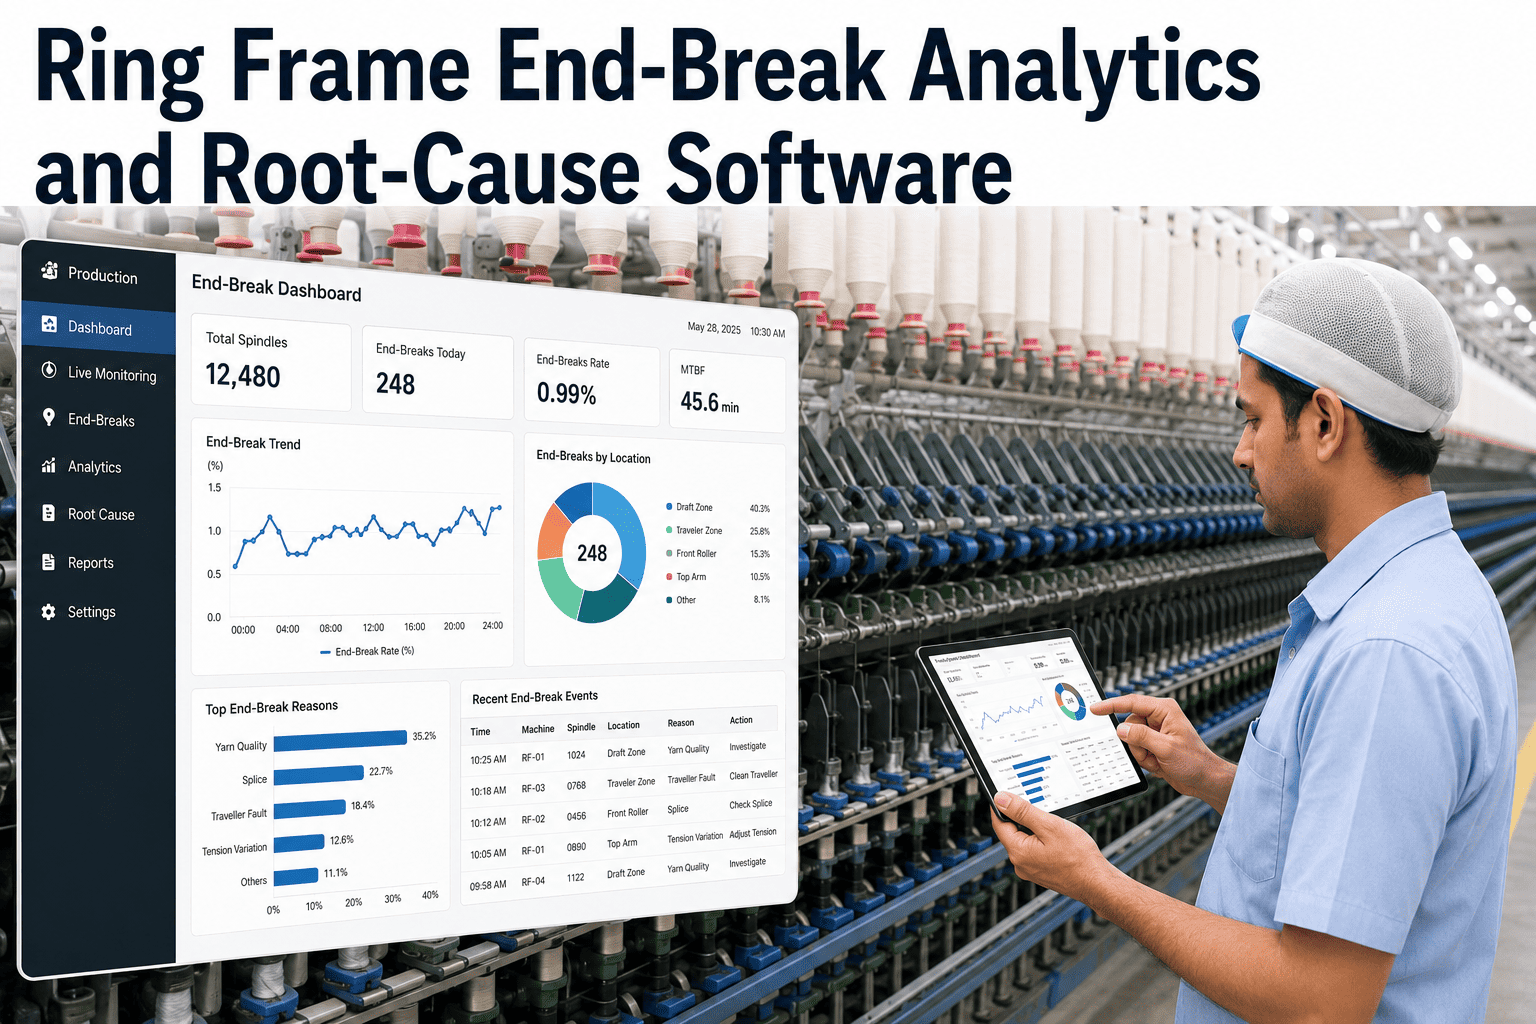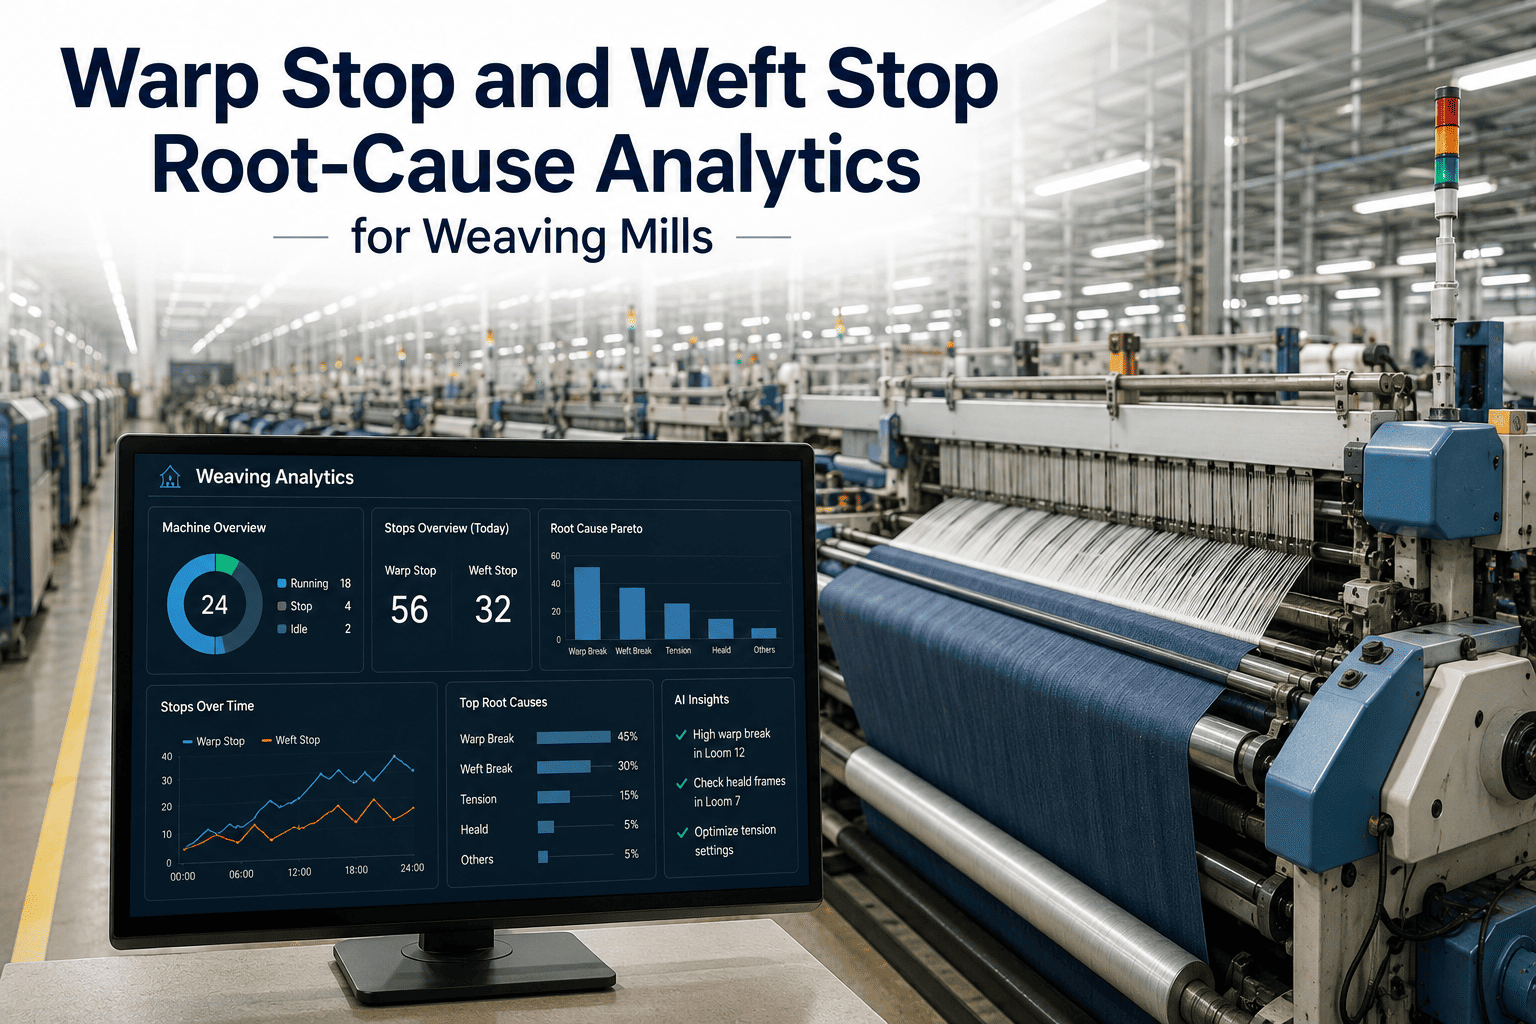
In modern weaving mills, unplanned warp and weft stops remain the single largest contributor to productivity loss and fabric quality degradation. Each stop—whether caused by a yarn defect, tension fluctuation, mechanical misalignment, or operator error—triggers a cascade of downtime, waste, and rework that erodes OEE and inflates manufacturing costs. Root-cause analytics powered by Industry 4.0 technologies now enable mill managers to move beyond reactive troubleshooting and into predictive, data-driven resolution. By systematically capturing stop events across looms, styles, beams, shifts, and operators, advanced platforms like iFactory identify hidden patterns and prioritize corrective actions with surgical precision. This comprehensive guide explores the technical architecture, analytical methodologies, and operational benefits of warp and weft stop root-cause analytics, providing a blueprint for weaving mills aiming to achieve world-class efficiency. Book a Demo to see how iFactory transforms your stop data into actionable intelligence.
Transform Loom Stop Data into Competitive Advantage
Uncover hidden root causes of warp and weft breaks across every variable — loom, style, beam, shift, operator — and drive targeted improvements.
The Economic Imperative of Stop Analytics
Each minute of loom downtime costs a mid-size weaving mill between $50 and $150 in lost production, depending on fabric value and machine speed. With typical mills experiencing 30 to 60 stops per loom per shift, the aggregate financial impact is staggering. Traditional approaches—manual logbooks, shift reports, and gut-feel troubleshooting—fail to capture the multidimensional nature of stop causation. A warp break may be attributed to poor yarn quality when the real culprit is a worn heddle or incorrect tension setting. Weft stops might be blamed on operator inattention, yet analysis reveals a recurring pattern linked to specific beam lots or environmental humidity. Root-cause analytics eliminates guesswork by correlating stop events with dozens of contextual variables, enabling mills to pinpoint the exact combination of factors driving each category of downtime. This shift from reactive to predictive maintenance reduces unplanned stops by up to 40% and extends the life of critical weaving components.
Data Acquisition Architecture
Modern stop analytics begins with robust data acquisition at the loom level. IoT sensors capture warp tension, weft insertion timing, shed geometry, and yarn break signals in real time. Edge processors normalize this data and transmit it to a centralized platform where it is timestamped and tagged with contextual metadata: loom ID, style code, beam number, shift ID, operator badge, and environmental conditions. This granular dataset forms the foundation for all downstream analysis.
Multidimensional Correlation Engine
The core of root-cause analytics is a correlation engine that applies statistical algorithms—including Pearson correlation, chi-square tests, and decision tree classifiers—to identify significant relationships between stop events and contextual factors. For example, the engine can determine that warp breaks on loom L12 are 3.5 times more likely during shift B when using beam BX-204, pointing to a specific beam preparation issue.
Visualization and Drill-Down
Dashboards present findings through interactive heatmaps, Pareto charts, and trend lines that allow users to drill down from plant-level summaries to individual stop events. Color-coded severity indicators and anomaly detection flags highlight patterns that deviate from historical baselines, enabling rapid prioritization of corrective actions.
Technical Deep Dive: Stop Classification and Feature Engineering
Effective root-cause analysis relies on a rigorous stop classification taxonomy. Warp stops are categorized by location (left, center, right), yarn type (single, ply, filament), and break mechanism (tension, abrasion, knot failure). Weft stops are classified by insertion system (projectile, rapier, air jet, water jet) and defect type (missing pick, broken pick, loop formation). Each stop event is enriched with engineered features derived from raw sensor data: tension variability coefficient, yarn speed variance, shed opening angle, and beat-up force profile. These features capture subtle precursors to breaks that are invisible to manual inspection. Machine learning models—typically gradient-boosted trees or random forests—are trained on historical stop data to predict the likelihood of a stop under current operating conditions. The models output a root-cause probability distribution, ranking the most likely causes from most to least probable, along with confidence intervals. This probabilistic approach accounts for the inherent complexity of weaving processes where multiple factors often interact.
Comparative Analysis of Stop Causes by Loom Type
| Loom Type | Primary Warp Stop Cause | Primary Weft Stop Cause | Avg Stops per Shift | OEE Impact |
|---|---|---|---|---|
| Air Jet | Yarn tension spikes | Missing pick due to air pressure fluctuation | 45 | 12% reduction |
| Rapier | Warp abrasion at heddle eye | Broken pick from rapier misalignment | 38 | 10% reduction |
| Projectile | Knot failure in spliced yarn | Loop formation at selvage | 52 | 15% reduction |
| Water Jet | Yarn wetting inconsistency | Weft break at nozzle | 41 | 11% reduction |
Implementing Stop Analytics: A Step-by-Step Roadmap
Sensor Deployment and Connectivity
Install IoT sensors on all looms to capture warp tension, weft insertion, and machine status. Ensure edge gateways synchronize data with mill-wide time servers.
Data Normalization and Tagging
Develop a data pipeline that cleans, normalizes, and enriches raw sensor data with contextual tags: style, beam, shift, operator, and environmental readings.
Baseline Modeling
Train machine learning models on 90 days of historical stop data to establish baseline stop rates and root-cause distributions for each loom and style.
Dashboard Configuration
Configure role-based dashboards for operators, supervisors, and plant managers. Include real-time alerts for anomaly detection and weekly trend reports.
Continuous Improvement Loop
Establish a weekly review process where root-cause insights are translated into corrective actions—yarn quality checks, preventive maintenance, operator training—and outcomes are tracked.
Ready to Stop Guessing and Start Optimizing?
iFactory’s root-cause analytics gives you the precise answers you need to eliminate chronic stops and boost loom efficiency.
Operator-Centric Insights
Identify which operators have the highest stop rates and the most common causes associated with their shifts. Targeted training programs can reduce operator-induced stops by up to 35%.
Beam Quality Tracking
Monitor stop rates by beam ID to detect preparation issues early. Beams exhibiting warp break rates above threshold are flagged for inspection before they are loaded onto looms.
Style-Specific Optimization
Compare stop rates across fabric styles to identify which constructions are inherently problematic. Adjust weaving parameters or yarn specifications to improve runnability for high-stop styles.
Predictive Maintenance Alerts
Correlate stop patterns with machine component wear. A sudden increase in weft stops on a specific loom may indicate impending rapier or projectile failure, prompting proactive maintenance.
Frequently Asked Questions
How does iFactory collect stop data from different loom types?
iFactory uses universal IoT edge gateways that connect to any loom brand—Picanol, Sulzer, Toyota, Dornier—via standard industrial protocols (Modbus, OPC-UA, MQTT). The edge processor normalizes data into a common schema, ensuring consistent analysis across heterogeneous machine parks. For legacy looms without digital outputs, retrofittable sensor kits capture warp tension, weft presence, and mechanical vibrations. All data is encrypted and transmitted to the cloud or on-premise server. Contact support for integration details.
What is the typical time to value after implementing stop analytics?
Most mills see measurable improvements within 4 to 6 weeks of deployment. The first two weeks are dedicated to sensor installation, data pipeline setup, and baseline modeling. By week three, dashboards begin surfacing actionable insights. Early adopters typically achieve a 15% reduction in stop frequency by week six and a 25% improvement in OEE within three months. The key is establishing the continuous improvement loop—weekly reviews and corrective actions—to sustain gains. Book a Demo to see a sample timeline.
Can the system identify root causes across multiple shifts and operators?
Yes, multidimensional correlation analysis is a core feature. The platform automatically segments stop data by shift, operator, and even individual operator badge ID. It calculates normalized stop rates (stops per 100,000 picks) for each operator-shift combination and compares them against mill averages. Statistical significance tests flag operators whose stop rates deviate beyond two standard deviations, enabling data-driven coaching without bias. Learn more about operator analytics.
How does the system handle fabric style changes and beam lot variations?
Style and beam information is ingested from your MES or ERP system via API. Each stop event is automatically tagged with the current style code, beam ID, and beam lot number. The analytics engine then compares stop rates across styles and beam lots, controlling for other variables like loom type and shift. This allows mills to identify whether a particular beam lot has a statistically higher warp break rate, prompting a review of the warping or sizing process. Book a Demo to see style comparison dashboards.
What are the hardware requirements for implementing iFactory stop analytics?
Hardware requirements are minimal: one IoT edge gateway per 10–15 looms, plus sensor kits for looms without digital outputs. The edge gateway requires a stable Ethernet or Wi-Fi connection to the mill network. For cloud deployment, a standard internet connection with 10 Mbps upload speed is sufficient. On-premise deployment requires a server with 16 GB RAM and 4 CPU cores. iFactory provides full hardware specification sheets and installation support. Contact support for a detailed hardware checklist.
Transform Your Weaving Mill with Data-Driven Precision
Stop losing revenue to preventable stops. iFactory’s root-cause analytics gives you the clarity to act decisively and achieve world-class OEE.