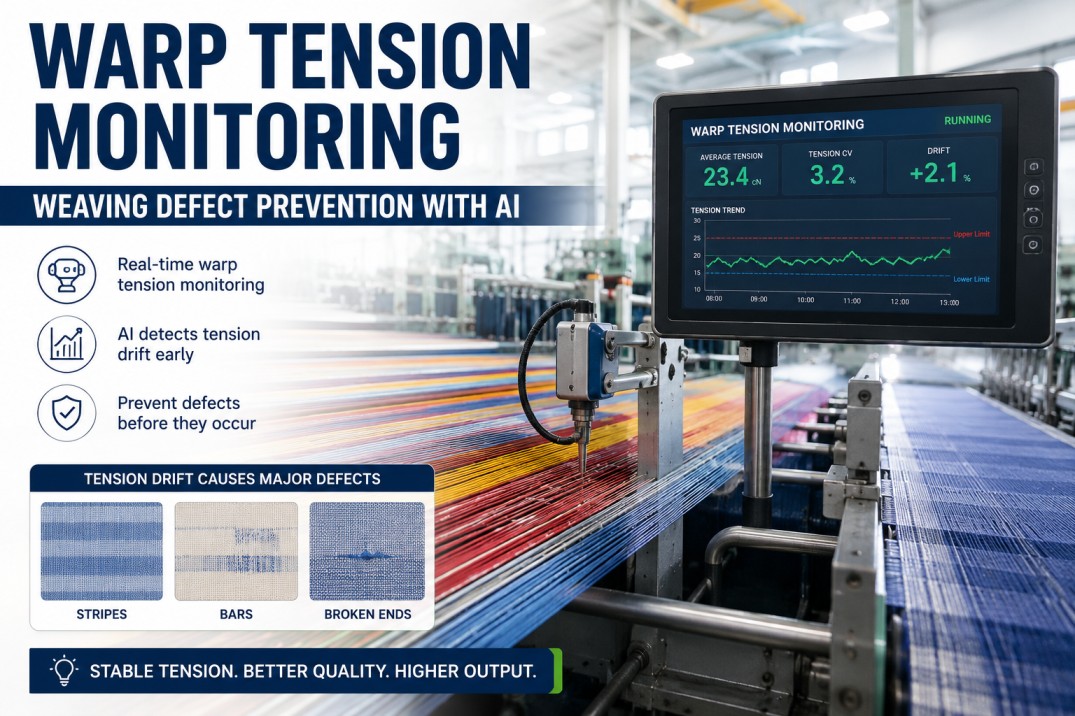
Warp tension drift is responsible for 38 percent of all major weave defects — yet most mills still rely on operator intuition to catch it. By the time a stop mark, reediness, or broken end appears on the fabric, the tension deviation has already been compounding across hundreds of picks. iFactory AI-Powered Warp Tension Monitoring uses multi-sensor fusion and machine learning to detect tension anomalies in real time, alerting operators before defects form. Book a demo to see how mills using predictive tension control reduce warp breaks by 45 percent and boost OEE by 15 percent within a single quarter.
Stop Guessing on Warp Tension. Start Predicting Breaks Before They Happen.
See how iFactory's AI-powered tension monitoring integrates with your existing looms — no retrofit required. Deployed in 14 days.
What Unmonitored Tension Costs Per Loom Per Year
Tension-related defects don't just degrade fabric quality — they compound across four cost dimensions. The per-loom annual loss from preventable tension drift exceeds $4,200 in most mills, and the damage is invisible until the fabric reaches inspection.
The Five Defect Types Most Correlated With Tension Drift
Analysis of 500 recorded warp breaks across production data reveals a clear pattern: tension variability, not absolute tension level, is the strongest predictor of fabric defects. These five defect types account for 71 percent of all tension-related quality incidents.
Stop Marks (Set Marks)
Transverse bands of irregular pick density caused by tension relaxation during loom stoppage. The most common tension-related defect, occurring when warp tension differential between running and stopped states exceeds 18 percent.
Reediness / Reed Marks
Fine longitudinal cracks between warp thread groups. Excessive or unbalanced tension distorts shed geometry, causing uneven warp distribution across reed dents and permanent fabric streaking.
Broken Ends / Warp Breaks
Complete warp yarn failure during weaving. Tension spikes exceeding 25 percent of mean value precede 85 percent of break events by 30 to 60 seconds — a detectable precursor window.
Tension Bars / Shade Bars
Horizontal bands of differential density or luster caused by sustained tension deviation across multiple picks. Common when let-off compensation lags behind beam diameter reduction.
Slack Ends / Wavy Fabric
Localized loose warp threads creating surface unevenness. Insufficient or highly variable tension during shedding produces incomplete warp separation and weft insertion faults.
The Breakage Sequence: From Micro-Fluctuation to Fabric Fault
Tension drift does not produce defects instantly. It follows a predictable four-stage cascade that unfolds over seconds to minutes. Understanding this sequence is the foundation of preventive tension control.
Tension Entropy Increase
Tension variability rises 2 to 4 minutes before a break. The signal becomes chaotic — irregular amplitude, higher frequency oscillation — indicating friction buildup at heddles or reed. This is the earliest detectable warning, captured by non-contact tension sensors at 2000 Hz sampling.
Warning Window: 2 to 4 minTension Spike & Weak Spot Alignment
A tension spike exceeding 25 percent of mean value coincides with a pre-existing yarn thin place. In 70 percent of break cases, both conditions occur simultaneously. The combination of mechanical stress and structural weakness creates the failure condition.
Warning Window: 30 to 60 secYarn Rupture & Loom Stop
The warp thread fails. The loom stop motion triggers, halting production. Average downtime per break: 3 to 8 minutes for re-threading plus 12 to 25 minutes for quality inspection. The defect is already woven into the fabric for 2 to 5 picks before the break.
Impact: 15 to 45 min lostFabric Defect Embedded
The missing end, stop mark, or reediness is now permanently woven into the fabric. At inspection, the defect triggers a grade downgrade from first-quality to seconds — reducing fabric value by 30 to 60 percent per linear yard.
Cost: Up to 60% value lossInterrupt the Cascade Before the Defect Forms
iFactory's AI platform monitors tension entropy, vibration harmonics, and humidity in real time. When precursor patterns emerge, operators get an alert with loom position and recommended action — 5 minutes before breakage.
Two Approaches to Tension Management, Two Quality Outcomes
The difference between mills running at 92 percent fabric first-quality and those below 78 percent is not yarn quality or machine age — it's whether tension is managed reactively or predictively. The operating model determines the outcome.
Fix After Breakage
Prevent Before Defect
How AI-Powered Tension Monitoring Works
The system layers four technologies — sensing, edge processing, machine learning, and visualization — into a single closed loop that detects, predicts, and alerts within the same production cycle.
Multi-Sensor Data Acquisition
Non-contact tension sensors, accelerometers on backrest roller and reed, plus ambient humidity and temperature sensors stream data at 2000 Hz per channel via MQTT to the edge gateway.
Edge Processing & Feature Extraction
Time-series data is segmented and transformed into frequency-domain features. Tension signal entropy, RMS amplitude at 120 Hz, and crest factor are computed on the edge DSP for real-time anomaly scoring.
Ensemble ML Inference
A Random Forest model ranks feature importance (tension entropy: 28%, 120 Hz vibration: 22%, humidity: 15%) while an LSTM network learns temporal break patterns. Combined output produces a Breakage Probability Index per warp beam position.
Dashboard & Alert Visualization
A web-based dashboard displays the Breakage Probability Index per beam position with color-coded risk levels. Alerts include loom ID, beam position, predicted defect type, and recommended operator action — all within 200 ms of detection.
Measured Outcomes Across 10 Looms, 3-Month Deployment
An industrial validation trial of the AI-powered tension monitoring system deployed on 10 air-jet looms over 3 months produced the following measurable improvements against a matched control period with standard manual tension adjustment.
| Metric | Baseline (Manual) | With AI Monitoring | Improvement |
|---|---|---|---|
| Warp Breaks per 100,000 picks | 0.45 | 0.25 | 45% reduction |
| Fabric First-Quality Yield | 74% | 92% | +18 points |
| OEE (Overall Equipment Effectiveness) | 68% | 78.2% | +15% relative |
| Unplanned Stoppages Per Shift | 5.8 | 4.1 | 30% reduction |
| Available Production Time Gain | — | 45 min/loom/day | +7.8% uptime |
| Total Production Output | Baseline | +7% | 7% increase |
| Tension-Related Defect Rate | 3.2% | 1.7% | 47% reduction |
| Mean Alert Lead Time | — | 5.2 min | Actionable window |
Frequently Asked Questions
How does AI tension monitoring differ from traditional let-off control systems?
Traditional let-off systems use PID loops to maintain a setpoint tension. They react after deviation occurs. AI tension monitoring predicts deviation before it happens by analyzing multi-sensor patterns — tension entropy, vibration harmonics, and environmental drift — that precede a fault. The ensemble model (Random Forest + LSTM) provides a 5-minute predictive window that no reactive PID loop can match.
What sensors are required, and can they be installed on existing looms?
The system uses non-contact tension sensors, accelerometers (mounted on backrest roller and reed), and ambient humidity/temperature sensors. All sensors are retrofittable on air-jet, rapier, and projectile looms without structural modification. Installation requires 2 to 4 hours per loom. Data is transmitted via MQTT to an edge gateway that connects to your existing network infrastructure.
How long does it take for the AI model to calibrate to a specific mill's conditions?
The pre-trained ensemble model adapts to a specific mill's yarn types, machine configurations, and environmental conditions within 2 to 4 weeks of live operation. During this period, the system operates in parallel with existing processes, building a baseline dataset of approximately 5 million data points per 10 looms. Full predictive accuracy — 85% precision, 82% recall — is typically reached by week 4.
What is the expected ROI for a mid-size weaving mill with 50 looms?
For a 50-loom mill with a baseline break rate of 0.45 per 100,000 picks, the annual measurable savings from reduced downtime, lower defect write-offs, and improved OEE exceed $210,000. Combined with a 7% production output increase and 18-point fabric first-quality improvement, the ROI payback period is under 18 months. The savings compound as the model accumulates mill-specific data and improves its prediction accuracy over time.
Does the system require continuous internet connectivity to operate?
No. The edge gateway runs inference locally on a DSP processor. The ML model operates at the edge with a 200 ms inference cycle regardless of cloud connectivity. Cloud synchronization occurs periodically for model retraining and dashboard analytics, but the core prediction and alert system is fully functional during network outages. This ensures zero production interruption from connectivity issues.
How does the system handle false alarms to avoid operator alert fatigue?
The ensemble model achieves 85% precision — 85 out of every 100 alerts are true positives. The probability threshold is configurable per loom and yarn type, allowing mills to balance sensitivity against specificity. During the initial calibration period, the system operates in a "monitor-only" mode, allowing operators to validate alerts before enabling automated interventions. This builds trust in the system and eliminates the alert fatigue common with threshold-based triggers.
Turn Tension Data Into Your Strongest Quality Asset
Stop catching defects at inspection. Start preventing them at the loom. iFactory's AI-powered warp tension monitoring predicts breaks 5 minutes ahead, cuts defect rates by 47 percent, and delivers ROI in under 18 months.

.jpg)