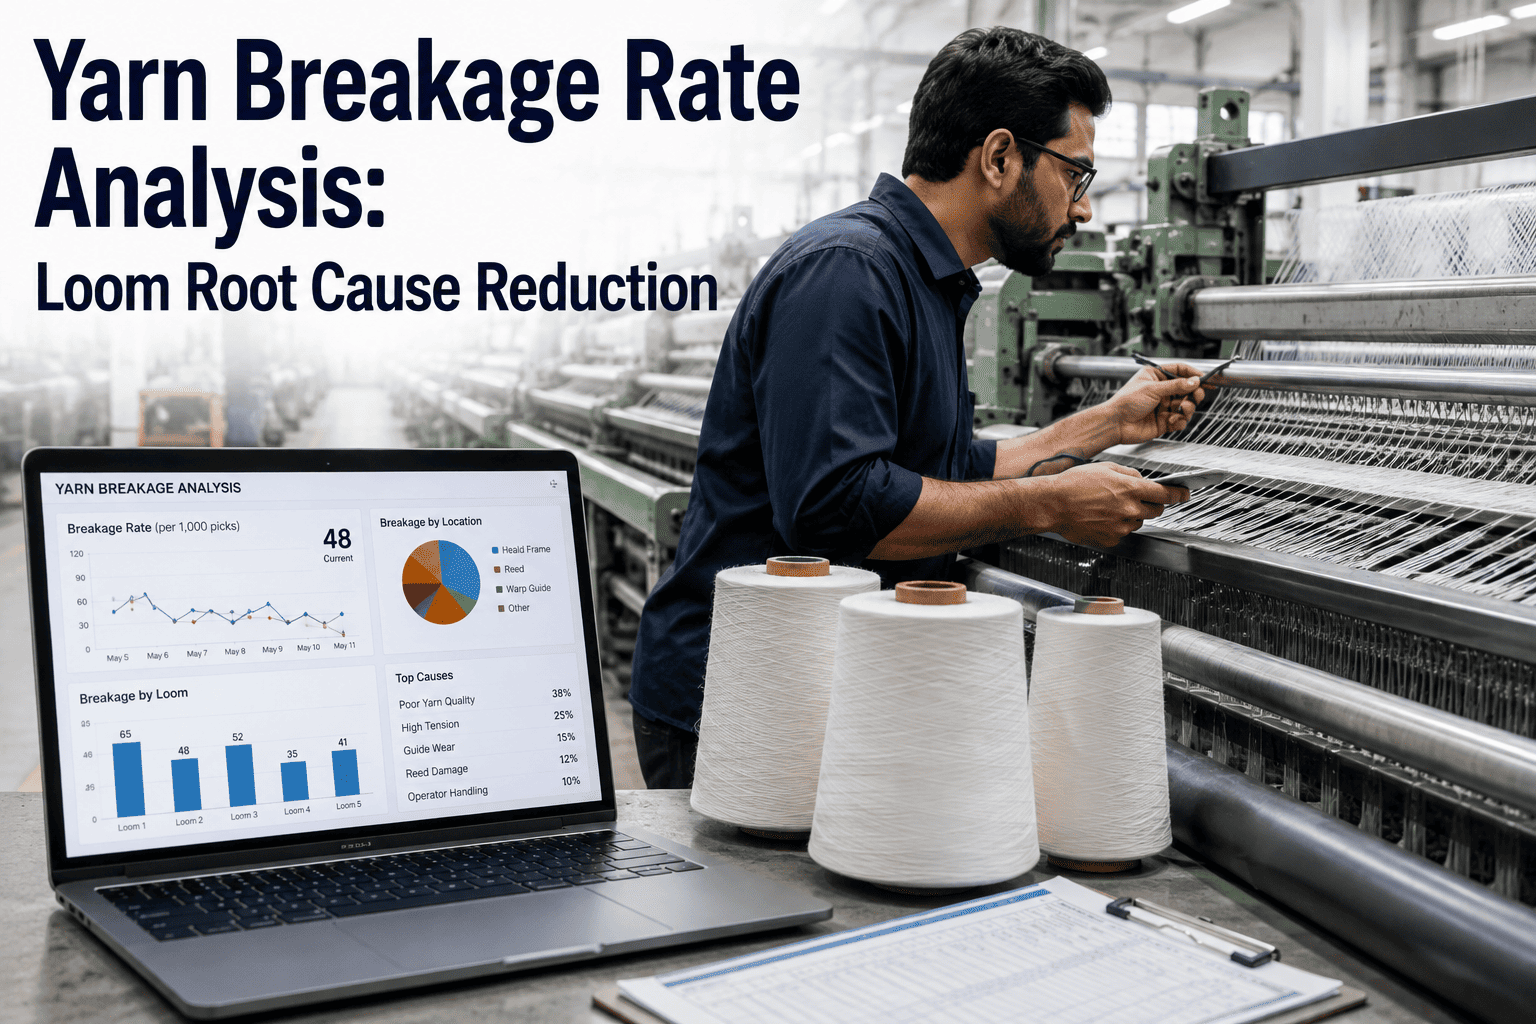
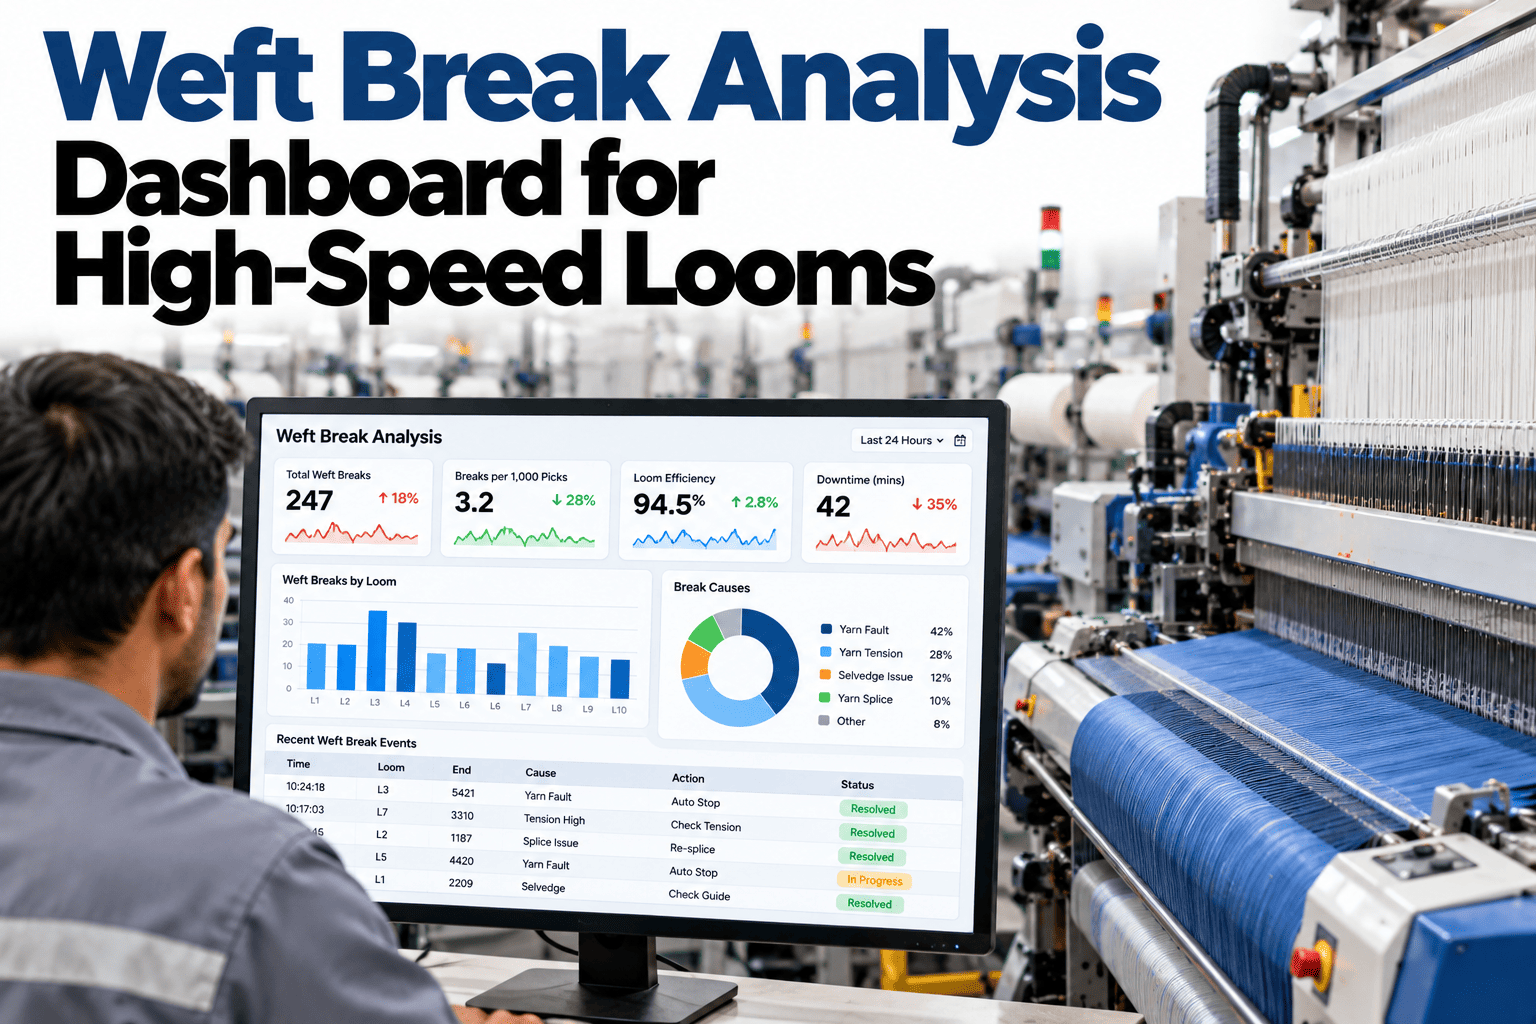
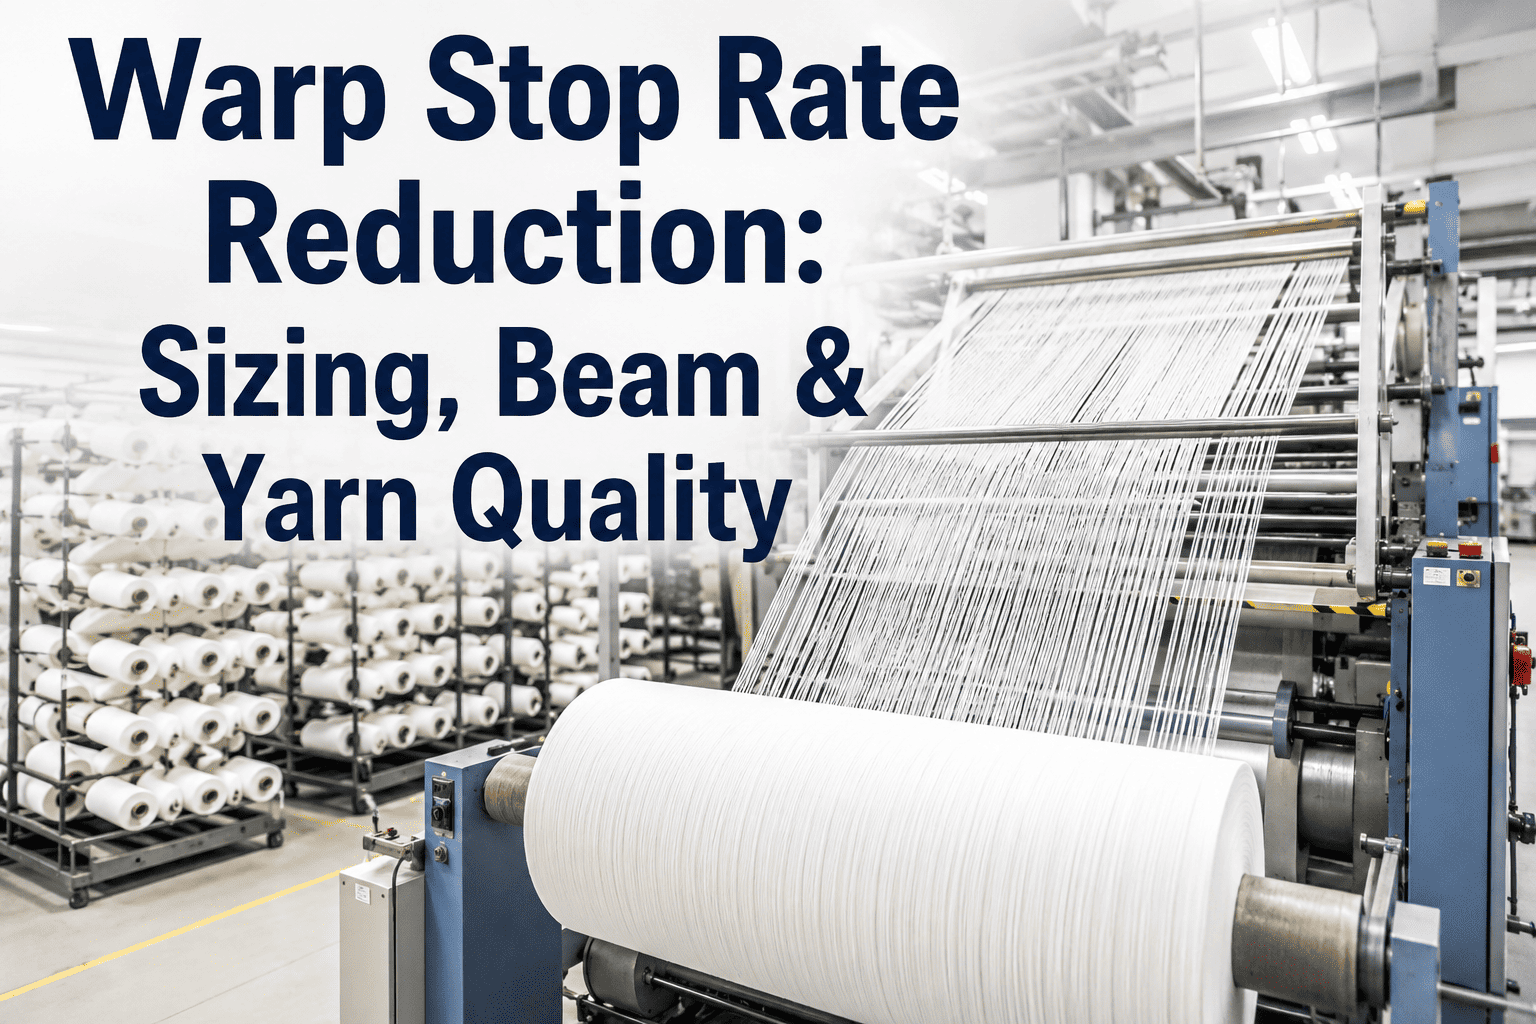
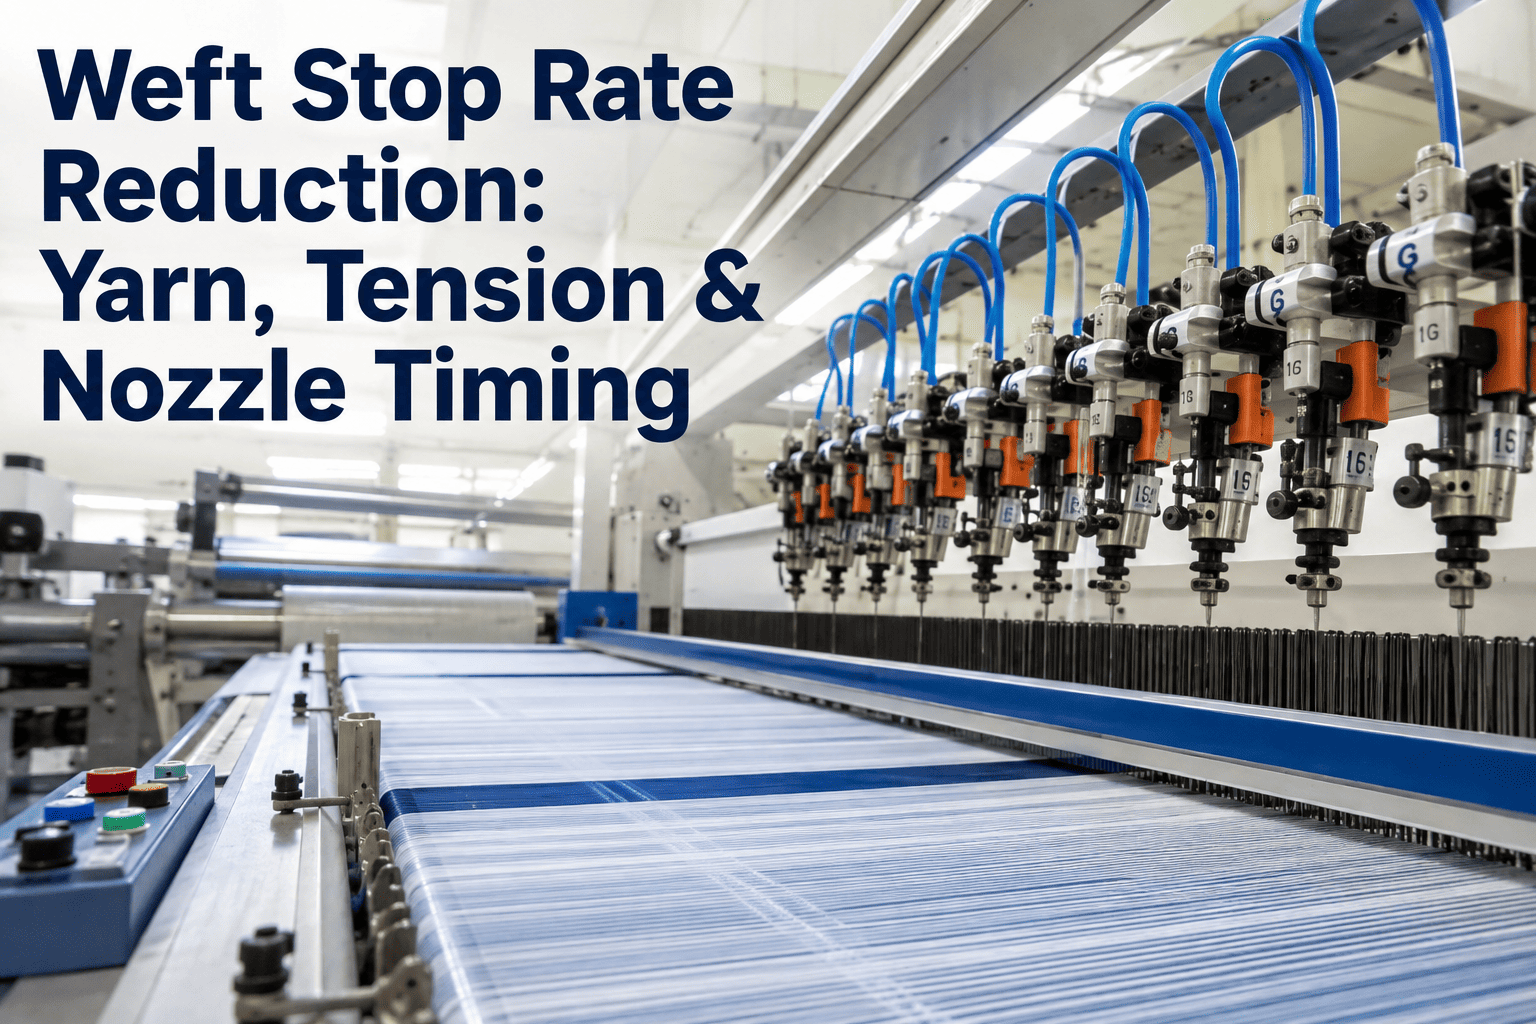
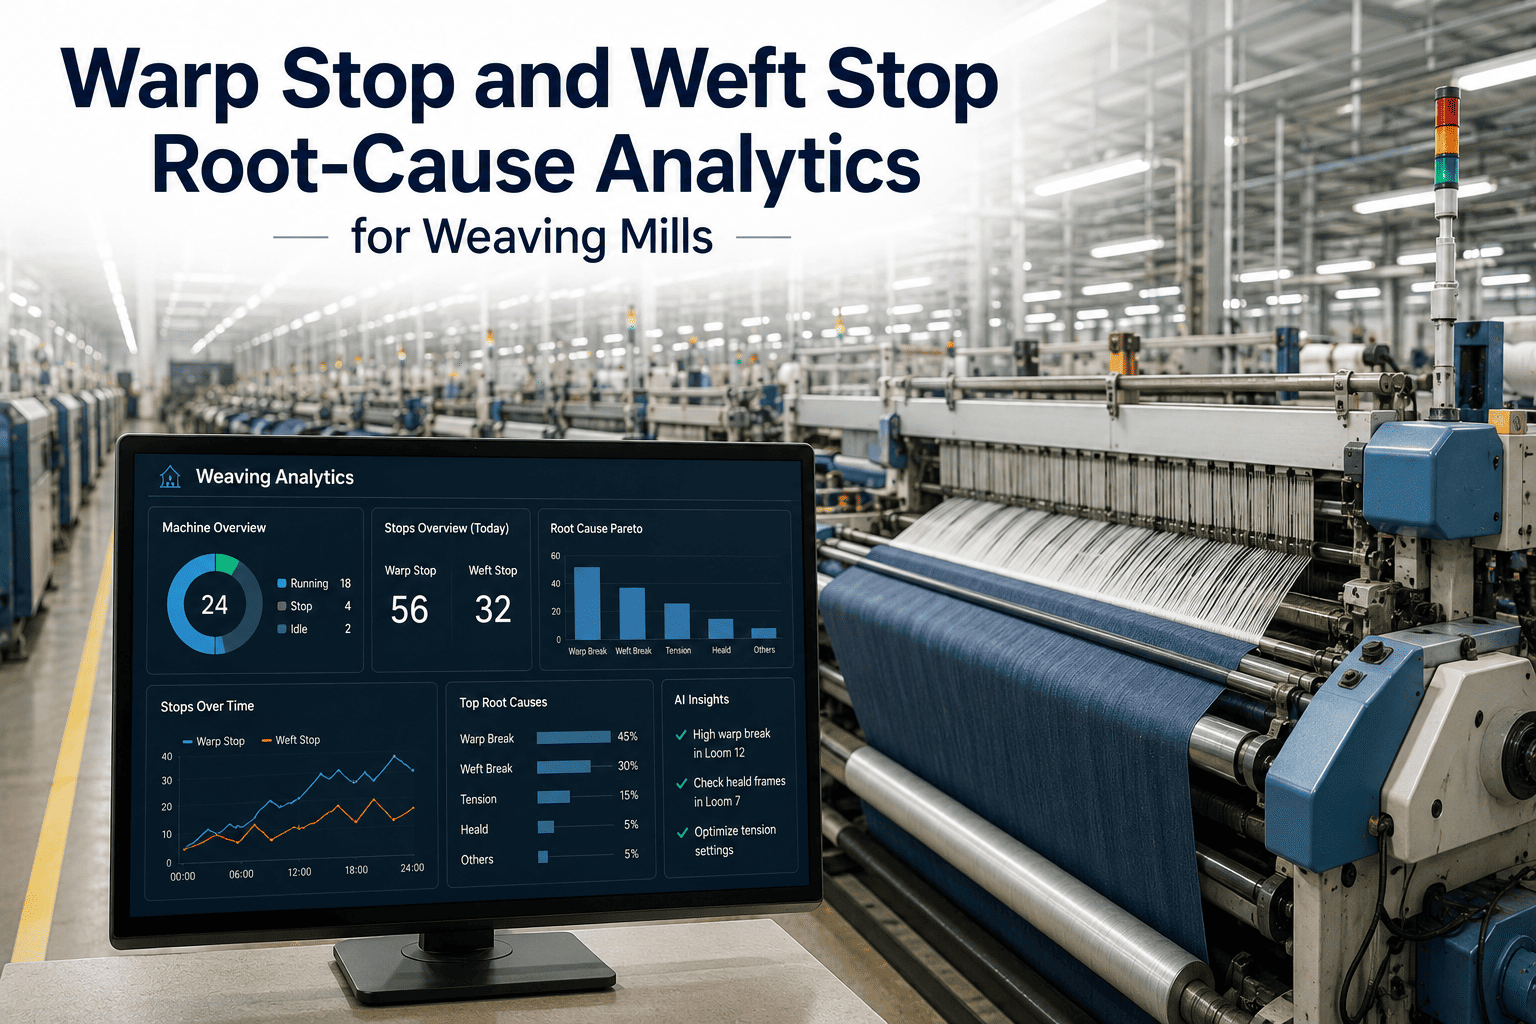
Every loom stoppage looks the same from across the weaving shed — the machine stops, a light flashes, an operator walks over — but the two most common causes behind that stoppage, a warp break and a weft break, come from almost entirely different parts of the process and need almost entirely different fixes. Mills that track yarn breakage only as a single combined number tend to chase the wrong root cause, because a warp-dominant breakage problem points back to sizing and beam preparation while a weft-dominant one points to insertion mechanics and yarn package quality. Separating the two, then categorizing causes within each, is what turns a vague "breakage is too high" complaint into a specific, fixable list. Mills that want to see breakage broken down by warp versus weft, by loom, and by shift automatically can book a demo and look at their own stoppage data this way.
WEAVING EFFICIENCY · YARN BREAKAGE
Yarn Breakage Rate Analysis: Finding the Real Root Cause on the Loom
Warp break vs weft break separation, cause categorization, and targeted fixes that actually move the efficiency number.
58%of loom stoppages in a documented air-jet weaving study traced to warp breaks
34%traced to weft breaks in the same study, with the remainder mechanical or electrical
2.87 minaverage repair time recorded per warp break in that study
30–50%yarn strength reduction from abrasion and size removal during weaving
Split the Number: Warp Breaks vs Weft Breaks
Before investigating a single cause, the breakage rate itself needs to be split by type, because warp and weft breaks come from different mechanical stresses and point maintenance attention in different directions. A published study of air-jet weaving stoppages found the majority of stops traced to warp breaks, with weft breaks a meaningful but smaller share, and mechanical or electrical causes trailing both — a pattern typical enough to use as a starting benchmark when a mill has not yet segmented its own data this way.
Warp Breaks — 58%
Weft Breaks — 34%
8%
Warp Breaks Point ToSizing quality, tension control during weaving, beam preparation, and yarn strain management through the shed.
Weft Breaks Point ToInsertion mechanics — air pressure on jet looms, nozzle timing, package quality, and weft brake damping settings.
Categorizing Causes Within Each Type
Once breaks are split by type, each category has its own short list of common root causes — and the fix for one is often unrelated to the fix for another, which is why "reduce breakage" as a single initiative tends to underperform compared to a targeted list attacking specific causes.
| Break Type | Common Root Cause | Typical Fix |
|---|
| Warp | Inadequate strain control on the yarn during weaving | Improved back-rest tension control and shed timing |
| Warp | Poor sizing film adhesion or insufficient strength gain | Sizing recipe and machine parameter optimization |
| Warp | Excessive abrasion against heald eyes and reed | Component wear inspection and friction-reducing finishes |
| Weft | Incorrect main or relay nozzle air pressure | Pressure re-calibration by yarn count and construction |
| Weft | Weft package quality — hairiness, uneven winding | Package inspection and winding tension review |
| Weft | Shed crossing timing mismatched to yarn type | Timing adjustment trials by yarn fineness |
SEE BREAKAGE SPLIT BY LOOM AND CAUSE AUTOMATICALLY
Stop Guessing Whether It's a Warp Problem or a Weft Problem
Connected stop-reason data separates warp and weft breaks by loom, shift, and construction — the starting point for a targeted fix.
The 4M Framework for Root Cause Investigation
When a specific loom's breakage rate is genuinely out of line with the rest of the shed, a structured investigation across four categories — Material, Machine, Method, and Environment — tends to surface causes faster than an unstructured walk-around, because it forces the investigation to check categories that are easy to overlook when the obvious suspect is right in front of you.
MATERIALYarn count consistency, sizing film quality, moisture content, and package-to-package variation.
MACHINEHeald and reed wear, tension device calibration, nozzle condition, and back-rest roller function.
METHODLoom settings — shed timing, air pressure, take-up rate — matched or mismatched to the specific construction.
ENVIRONMENTShed humidity and temperature affecting yarn moisture regain and static, especially in dry seasons.
Prioritizing Fixes by Impact and Effort
Not every identified cause deserves the same urgency — some fixes are quick calibration adjustments, others require capital investment or a longer trial period to confirm they work. Ranking candidate fixes by expected impact against effort required keeps the improvement program moving on the changes that pay back fastest first.
Re-calibrate nozzle air pressure by yarn countQuick Win
Adjust back-rest tension control settingsQuick Win
Inspect and replace worn heald eyes / reed dentsModerate Effort
Re-optimize sizing recipe for the yarn constructionModerate Effort
Shed humidification retrofit for dry-season stabilityCapital Project
Measuring Whether the Fix Actually Worked
A root cause fix is not confirmed until the breakage rate on the affected loom or construction has been tracked for long enough to rule out normal shift-to-shift variation — a single good day after a tension adjustment is encouraging, not proof. Comparing a rolling two-week average before and after the change is a more reliable read than comparing single shifts.
| Metric | Before Fix (2-Week Avg) | After Fix (2-Week Avg) |
|---|
| Warp Breaks / 100 Loom-Hours | Baseline recorded | Compared against baseline |
| Average Repair Time per Break | Baseline recorded | Compared against baseline |
| Loom Efficiency % | Baseline recorded | Compared against baseline |
Frequently Asked
Yarn Breakage Rate Analysis — Common Questions
Why does separating warp breaks from weft breaks matter so much for fixing the problem?
Warp and weft yarns experience fundamentally different mechanical stresses during weaving — warp yarns undergo repeated tension cycling as the shed opens and closes across the entire weaving cycle, while weft yarns experience a single high-speed insertion event per pick. A mill treating breakage as one combined number risks investing in a fix aimed at the wrong mechanism entirely, such as adjusting nozzle air pressure to address what is actually a sizing quality problem on the warp side. Segmenting the data first, even with a simple manual tally over a representative sample period, is the fastest way to avoid that misdirected effort.
What is a reasonable target breakage rate to benchmark against?
Reasonable targets vary significantly by yarn count, construction complexity, loom type, and fiber — a coarse cotton weave on a modern air-jet loom will run a very different breakage rate than a fine-count blend on an older shuttle loom, so external benchmarks should be treated as directional rather than a hard target to hit regardless of context. The more useful benchmark is usually the mill's own best-performing loom running the same construction, since that comparison controls for most of the variables that make cross-mill benchmarks unreliable, and closing the gap to that internal best-in-class number is a concrete, achievable goal.
How long does it take to confirm a root cause fix actually reduced breakage?
A meaningful comparison generally needs at least a rolling two-week average before and after the change, rather than comparing single shifts or single days, because normal shift-to-shift and day-to-day variation in breakage rate can easily mask or mimic a real improvement over a short window. Fixes tied to seasonal or environmental factors — humidity-related warp breakage, for example — may need to be evaluated across a full seasonal cycle before the mill can be confident the fix holds under the conditions that originally caused the problem, not just under the conditions present when the fix was implemented.
Can breakage patterns predict fabric quality problems before they show up in inspection?
Yes — a rising breakage rate on a specific loom or construction, even before it becomes severe enough to significantly hurt efficiency, is often an early indicator of a developing quality issue, since the same underlying causes that produce breaks — sizing degradation, tension instability, worn components — also tend to produce fabric defects like thin places, missing picks, or streaks once the yarn survives the loom but is compromised. Trending breakage data by loom and construction over time can flag these developing conditions before the fabric inspection stage catches the resulting defects, giving the mill a head start on corrective action.
Is it worth tracking breakage separately for every individual loom, or is a department average enough?
Individual loom tracking is significantly more useful for root cause work than a department average, because a department average of, for example, 15 breaks per 100 loom-hours could mean every loom performs consistently around that number, or it could mean two looms are running at 30 while the rest are running near 10 — and those two scenarios call for entirely different responses. Loom-level data is what allows a mill to identify genuine bad actors within a fleet of otherwise similar machines, rather than applying a blanket fix across equipment that may not need it. Mills setting up this level of tracking can get a walkthrough of configuration options through
support.
SEPARATE THE SIGNAL FROM THE NOISE ON YOUR LOOMS
Turn Loom Stoppage Data Into a Targeted Fix List
Warp vs weft split, cause categorization, and loom-by-loom breakage trends — see it against your own weaving shed data.