On a high-speed loom, a weft break costs only a few minutes, which is exactly why it gets underestimated. Multiply those minutes across hundreds of looms and several shifts and weft stops become one of the largest drains on efficiency in the shed. The useful question is never how many breaks happened, but which looms, which yarn lots and which hours produced them. A dashboard built around that question helps, and teams can ask iFactory AI how weft break data is organised by loom and cause.
See Every Weft Break by Loom, Lot and Hour
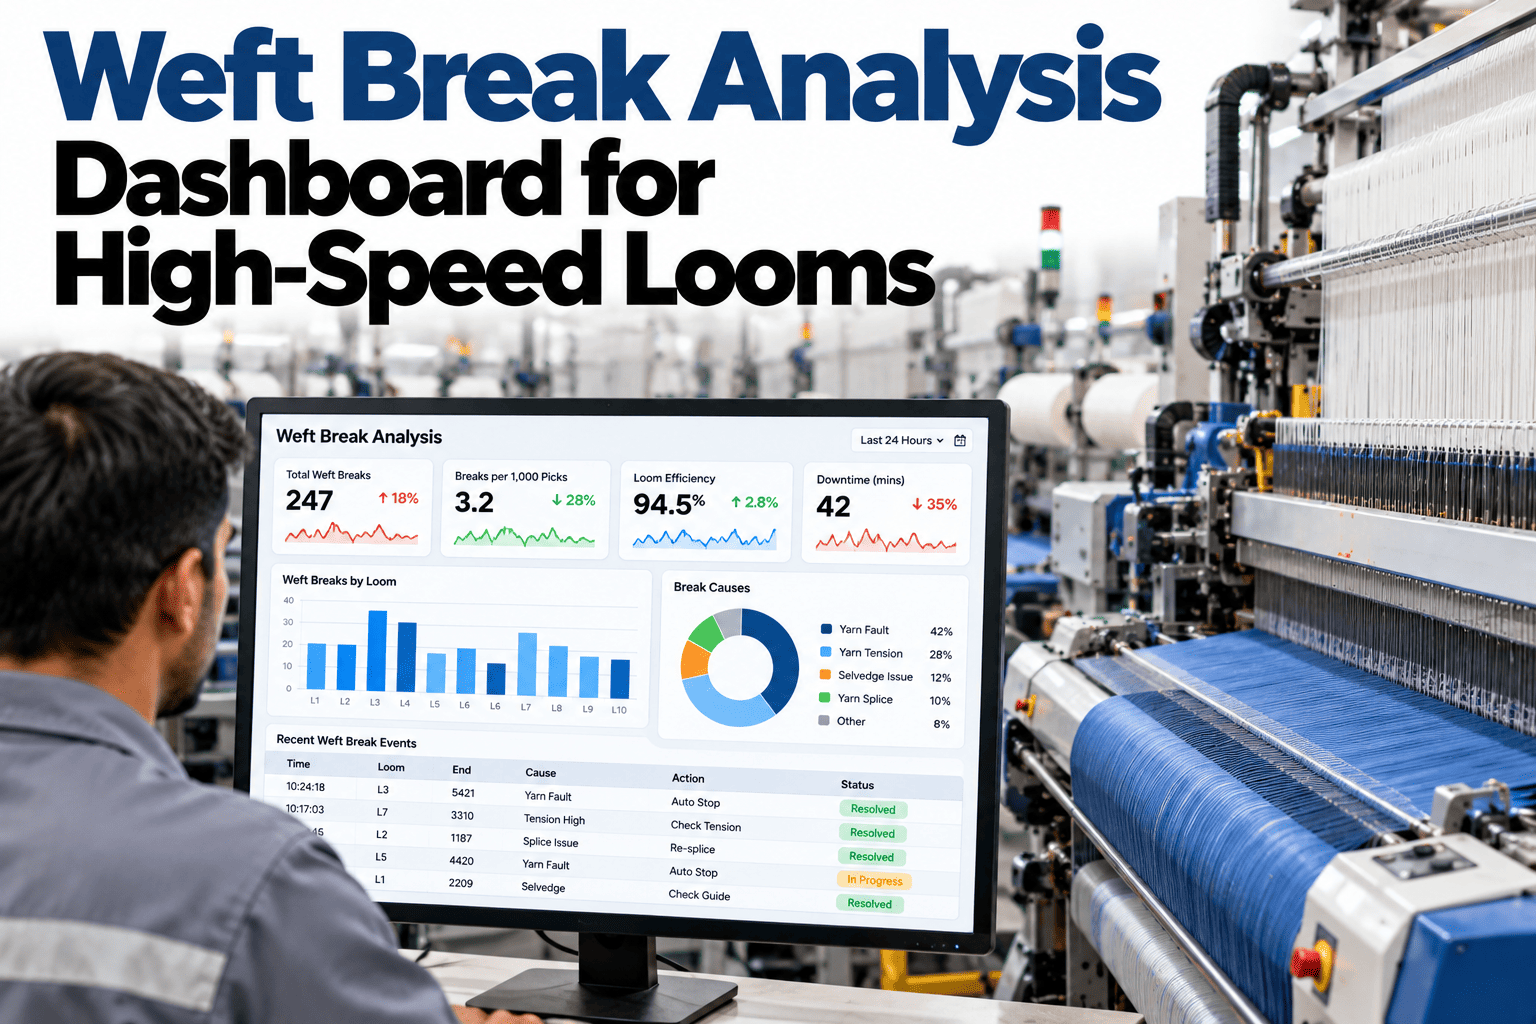
iFactory AI turns raw loom stop signals into a weft break dashboard that shows where breaks cluster, so the right fix goes to the right loom first.
What the Dashboard Tiles Should Show
A good weft dashboard answers four questions at a glance, without drilling through reports.
The Pareto: Which Causes Cost the Most
Causes are never equal. The chart shows an illustrative ranking, which is how teams decide what to fix first.
Where the Breaks Cluster
A heat view of looms against shifts often shows patterns invisible in totals. The grid is illustrative.
| Loom Group | Shift A | Shift B | Shift C |
|---|---|---|---|
| Looms 1 to 10 | Low | Low | Moderate |
| Looms 11 to 20 | Moderate | High | High |
| Looms 21 to 30 | Low | Moderate | Low |
| Looms 31 to 40 | High | Moderate | Moderate |
Why Weft Breaks Hurt More Than Their Duration
Each weft stop looks small, but the cost compounds. Understanding why helps justify the effort of analysing them properly.
Frequency multiplies loss
A two-minute stop sounds trivial until it happens many times per loom per shift across the whole shed.
Restart marks follow
Every stop and restart risks a starting mark or a faint line in the cloth, which turns a stop into a quality problem.
Operators stretch thin
Frequent weft stops pull weavers away from other looms, which raises waiting time on the rest of the shed.
Causes hide in the noise
Without analysis, material, machine and practice issues all look the same and get blamed on the nearest loom.
Weft Breaks by Insertion Method
The dominant causes differ between air jet and rapier looms. Reading the dashboard correctly means knowing which list applies.
Find the Weft Breaks Costing You the Most
Book a 30-minute session and iFactory AI will review your loom stop data to show where weft breaks cluster and which cause to attack first.
A Cause-to-Fix Ladder
Once the dashboard names the cause, the fix usually follows a predictable order, from cheapest to most involved.
Check the yarn lot
Compare breaks across lots before touching any machine.
Inspect the package and feed path
Look for damaged cones, snagging and tension points.
Tune feeder and tensioner
Adjust and re-measure on the worst looms.
Review insertion settings
Check air, timing or gripper condition on affected looms.
Escalate to maintenance
Plan repairs where a loom stays an outlier.
A Composite Scenario: One Lot, Many Complaints
This is a composite example, not a named weaving unit. It shows how a dashboard separates a yarn problem from a machine problem.
What iFactory AI Adds to Weft Analysis
iFactory AI is smart manufacturing and industrial software for weaving. Explore weft break analysis in a live product tour on realistic loom data.
Normalised Comparisons
Weft stops per 100,000 picks keep every loom on a fair basis.
Lot Tracing
Breaks are tied back to yarn lots, so material issues are visible.
Shift Patterns
Practice-related clusters surface without manual spreadsheets.
Ranked Action List
The dashboard ends with a short list of looms and causes to handle first.
A Weft Break Investigation Checklist
When a loom stands out on the dashboard, a short checklist keeps the investigation consistent between technicians.
Yarn Lot Signals Worth Linking to Weft Breaks
Linking yarn data to loom stops is one of the fastest ways to separate material from machine problems.
| Yarn Signal | What It Suggests | What to Do |
|---|---|---|
| Weak spots or thin places | Strength variation causing breaks | Quarantine the lot and alert the supplier |
| Excess hairiness | Friction and snagging in the weft path | Check yarn quality and feeder settings |
| Slubs and thick places | Count variation or spinning faults | Trace back to the spinning frame |
| Damaged packages | Handling or winding problems | Review transport and winding practice |
Setting a Sensible Weft Break Target
A good target is realistic, specific and tied to a style. This simple sequence helps avoid arbitrary numbers.
Calculate weft stops per 100,000 picks for the last month, by style.
Compare against your best looms on the same style.
Set a target halfway between today and your best looms.
Check progress weekly and adjust if the style changes.
A 30-Day Plan for the First Dashboard
Start with the data you already have. This plan builds a first useful dashboard in about a month.
Review of Weft Break Analysis Practice
A practical review of what makes weft break data useful on the floor, written as editorial guidance rather than a named expert quote.
Normalise before comparing
Raw counts mislead because looms run at different speeds. Use stops per 100,000 picks.
Separate yarn from machine
If breaks follow a lot across looms, it is material. If they follow a loom across lots, it is mechanical.
Fix the top cause only
Resist chasing every cause. Solving the largest one usually delivers most of the gain.
Frequently Asked Questions
Why measure weft stops per 100,000 picks?
Looms run at different speeds and for different hours, so raw counts are unfair. A rate per 100,000 picks levels the comparison. See normalised weft rates on a live dashboard during a short session. A normalised rate also makes it easy to set a realistic target for each style and track progress against it.
How do we tell yarn problems from loom problems?
Check whether breaks follow a yarn lot across many looms or follow one loom across several lots. The first points to material, the second to the machine, and good tracing makes this quick. Once the source is clear, the right team is called first and the wrong adjustments are never made.
Which breaks are cheapest to fix?
Material and package issues are usually cheapest, because changing a lot or fixing handling costs little. Ask support how lot tracing is set up so these causes are caught first. Fixing a yarn or package cause removes breaks across many looms at once, which is why it usually pays back fastest.
Does this work for rapier and air jet looms?
Yes. The dashboard logic is the same, though the likely causes differ, such as air settings on air jet looms and gripper condition on rapier looms. Whatever the loom type, the same dashboard layout can be reused so staff learn one view and apply it everywhere.
How soon can a unit see value?
Often within weeks of connecting stop data, since clusters and top causes appear early. Book a call to scope a first dashboard around your busiest styles. A short pilot on one style usually shows enough clusters and top causes to justify a wider rollout.
Turn Weft Stops Into a Short List of Fixes
iFactory AI shows which looms, lots and shifts are behind your weft breaks so effort goes where it counts. Book a walkthrough to see it on your own stop data.