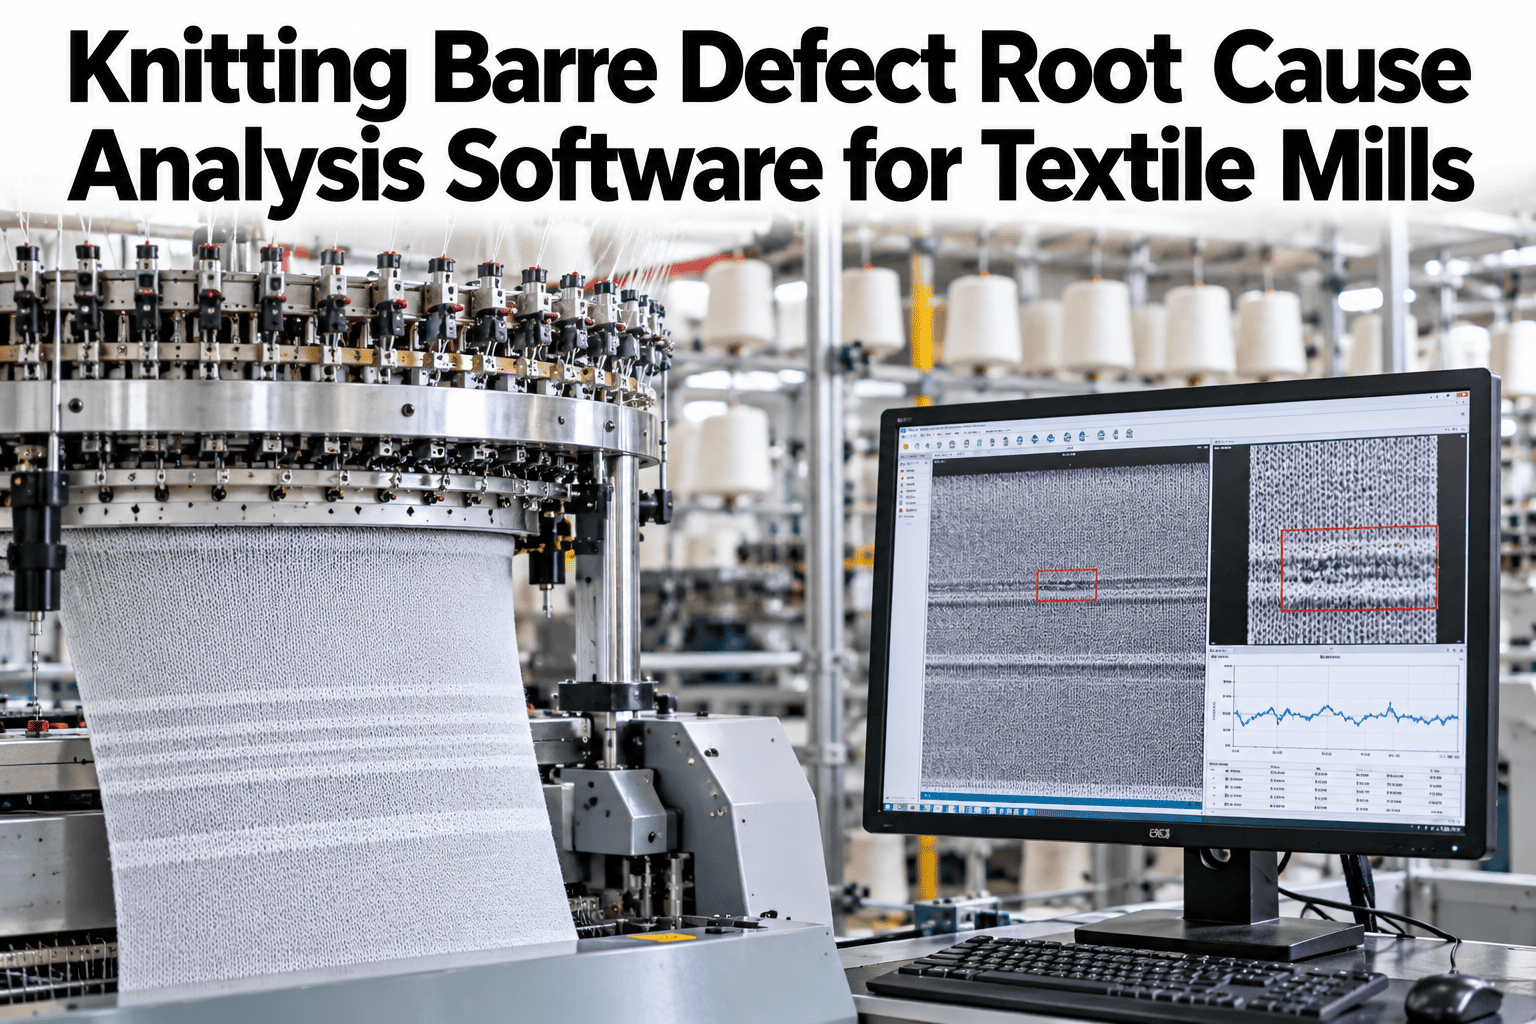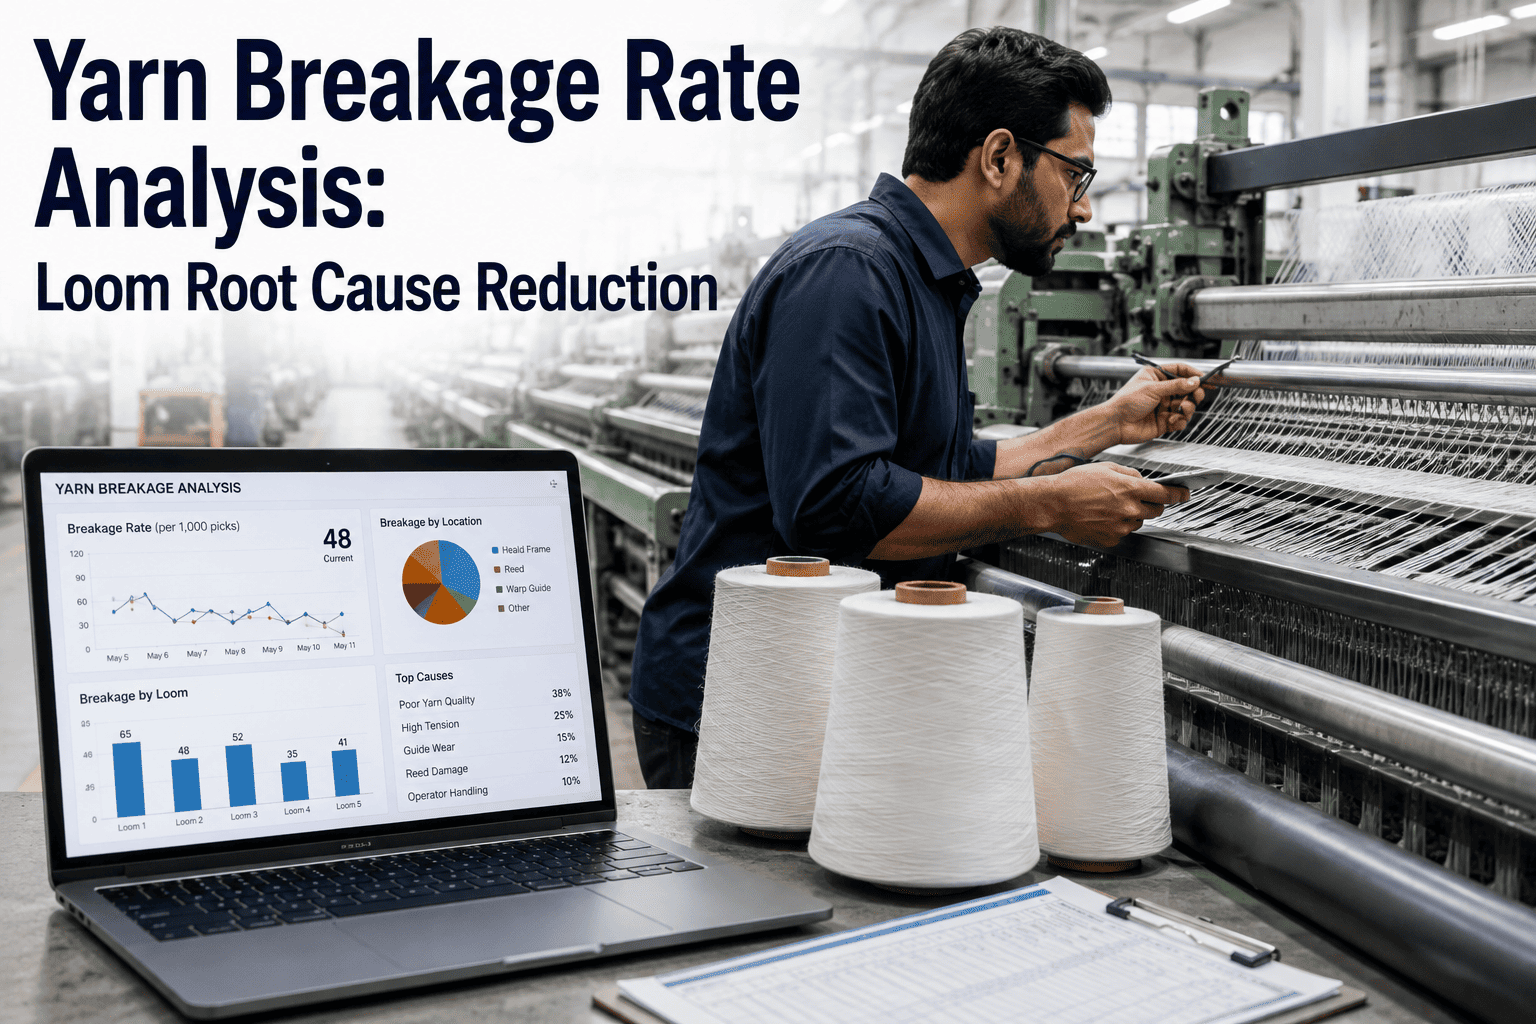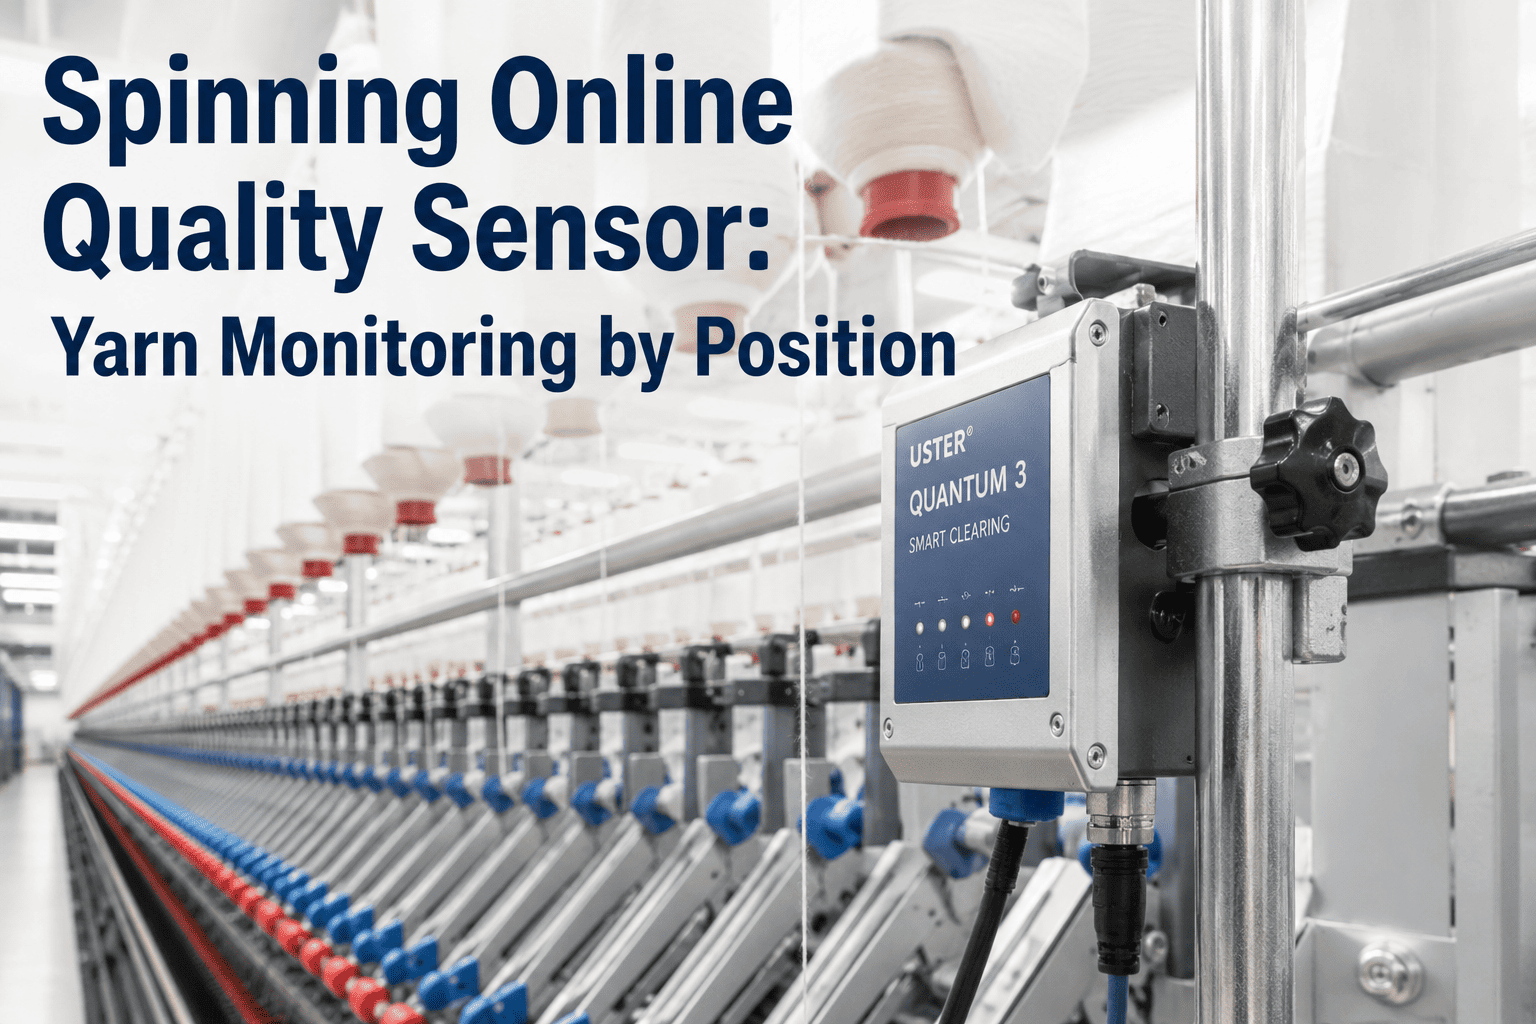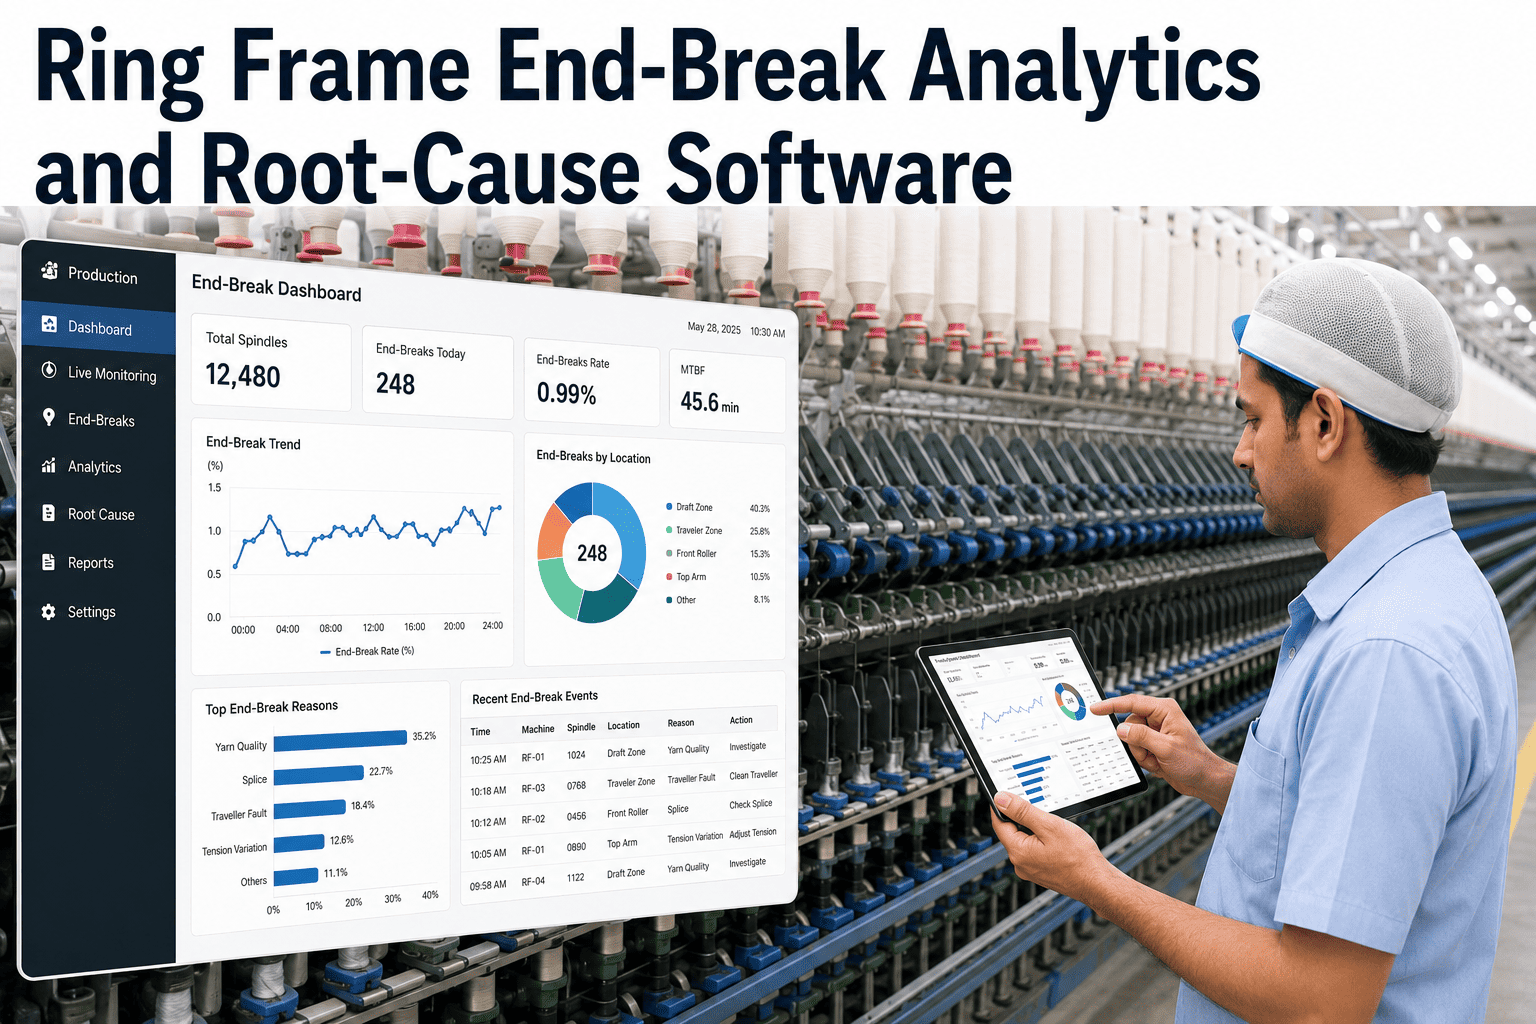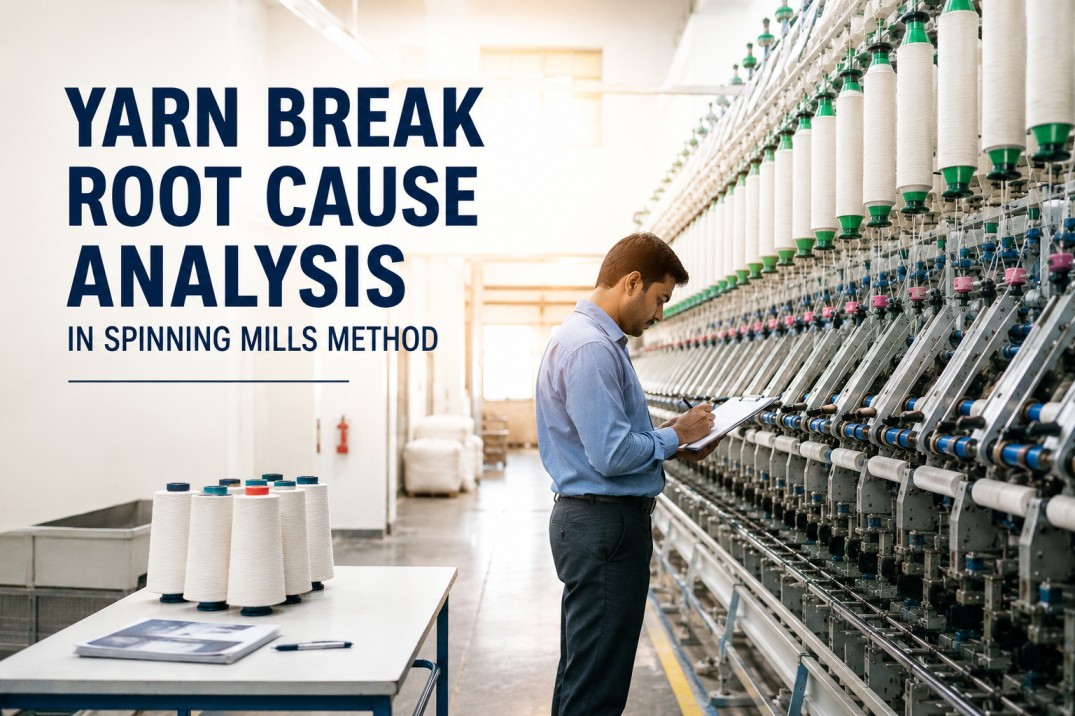
Every yarn break on a ring frame is a data point pointing to a root cause. The problem is not the break itself — it is the industry habit of treating each break as an isolated event rather than a systemic signal. A single end break costs 3 to 8 minutes of spindle downtime and 2 to 5 meters of yarn waste, but the compounding effect of unresolved root causes is far larger: mills running above 20 breaks per 100 spindle-hours lose 4 to 7 percentage points of machine efficiency and carry 12 to 18% higher yarn clearer cuts. Most mills collect break data but lack the diagnostic framework to convert it into corrective action. iFactory AI-Powered Root Cause Analytics ingests break location, frequency, spindle-group context, and real-time process parameters to automatically classify each break into one of five root cause domains — fiber, spindle, traveller, drafting, or atmosphere — and surfaces the most probable corrective action. Book a demo to see how mills using structured root cause analysis reduce break rates by 30% within 60 days.
Turn Your Mill's Break Data Into a Root Cause Action Plan
In a 30-minute walkthrough, our team shows how iFactory's RCA engine classifies every break by root cause domain, identifies the dominant failure mode per frame, and recommends prioritized corrective actions — so your team stops guessing and starts fixing.
Where Yarn Breaks Actually Come From
Every end break in ring spinning originates from one of five root cause domains. Each domain has distinct symptoms, measurement signatures, and corrective actions. Knowing which domain dominates your break profile is the first step to reducing it.
Fiber-Related Breaks
Signature: Random distribution across spindles and frames. Clusters during certain bale mixes or lot changeovers. Higher during high-speed counts.
- High short fiber content (>12% SFC)
- Excessive nep count (>40 neps/gram)
- Wide micronaire variation (>0.15 CV)
- Seed coat fragment presence
- Low trash removal in blowroom/carding
Spindle & Ring Assembly
Signature: Clustered on specific spindles or frame sections. Repeat breaks at the same spindle. Correlates with vibration and temperature readings above baseline.
- Spindle axis misalignment (>0.05 mm runout)
- Ring flange wear or ring tilting
- Spindle tape tension variation
- Bearing vibration spikes above 2x baseline
- Bolster wear or oil starvation
Traveller-Related Breaks
Signature: Increases in frequency as days since last traveller change progress. Peaks on day 7–10 of traveller life. Higher in compact spinning at elevated speeds.
- Exceeded traveller useful life (>10 days)
- Incorrect traveller weight for count
- Traveller-ring profile mismatch
- Accelerated wear from high spindle speed
- Inadequate traveller break-in procedure
Drafting System Breaks
Signature: Clustered on specific spindle positions or roller pairs. Higher in the back zone or front zone depending on draft distribution. Accompanied by mass irregularity in the yarn.
- Apron wear or hardening beyond 6 months
- Top roller eccentricity (>0.03 mm)
- Improper break draft ratio for fiber length
- Roller nip pressure below specification
- Spacer gap incompatible with yarn count
Atmospheric Breaks
Signature: Widespread across all spindles and frames simultaneously. Correlates with shift changes, weather events, or HVAC cycling. Follows a time-of-day pattern.
- RH below 45% or above 70% in spinning zone
- Temperature swings exceeding ±3°C within a shift
- Differential pressure imbalance in supply air
- Exhaust air recirculation with high lint load
- Humidifier nozzle blockage or scaling
Symptom-to-Cause Reference Table
When a break pattern emerges, the observable symptoms narrow the root cause domain. Use this matrix as a first-pass diagnostic reference before deploying detailed measurement protocols.
| Observable Symptom | Most Likely Domain | Secondary Domain | Primary Corrective Action | Verification Method |
|---|---|---|---|---|
| Breaks cluster on same spindle repeatedly | Spindle & Ring Assembly | Traveller | Check spindle runout & ring alignment | Dial gauge & vibration analysis |
| Breaks increase from day 6 to day 10 after traveller change | Traveller | Spindle & Ring | Reduce change interval or verify traveller weight | Remaining life prediction model |
| Breaks appear randomly across all spindles during certain bale mix | Fiber | Drafting | Review HVI data & adjust blending | AFIS fiber testing |
| Breaks concentrated on outer spindle positions of each frame side | Atmospheric | Drafting | Verify air distribution duct pressure | Differential pressure log |
| Breaks with thick place at break point | Drafting | Fiber | Check apron condition & top roller eccentricity | Roller eccentricity gauge |
| Breaks accompanied by visible traveler debris on ring | Traveller | Spindle & Ring | Inspect ring flange wear & traveler profile match | Ring profile gauge |
| Breaks spike 30–60 min after shift change | Atmospheric | Fiber | Check humidifier cycling & door discipline | RH/temperature trend log |
| Breaks with thin place at break point — mass irregularity | Drafting | Fiber | Check break draft ratio & apron tension | Draft distribution audit |
| Breaks follow pattern of specific spindle speed change | Traveller | Spindle & Ring | Re-evaluate traveller weight for new speed | Traveller weight selection chart |
| Breaks concentrated on one frame section with HV duct | Atmospheric | Drafting | Inspect duct dampers & filter screens | Airflow measurement at supply point |
Your Mill's Break Data Already Contains the Answers
iFactory's root cause engine doesn't just count breaks — it classifies every one by domain, tracks weekly root cause distribution, and surfaces the highest-impact corrective action for each frame. Stop collecting data. Start diagnosing.
Seven-Step Root Cause Investigation Process
Effective root cause analysis follows a structured sequence. Each step narrows the hypothesis space and moves the team from observation to corrective action. The entire cycle can be completed within 48 hours when data systems are in place.
How iFactory Automates Root Cause Classification
Manual root cause analysis is slow, inconsistent, and dependent on the shift supervisor's experience. iFactory's RCA engine performs the same diagnostic logic in real time — every break classified within seconds, every trend tracked across days and weeks.
Auto-Capture Break Events
Spindle-level sensors and piecing robot integration detect every break event with spindle ID, timestamp, and duration. No manual logging. No missed events.
Pattern Recognition Engine
A Bayesian classifier evaluates each break against 22 pattern templates — spindle clustering, temporal clustering, traveller-age correlation, and RH correlation — and assigns probabilities for each of the five root cause domains.
Trend & Shift Dashboard
Week-over-week root cause distribution charts show whether corrective actions are working. A rising fiber share signals raw material drift. A rising traveller share signals wear schedule drift.
Corrective Action Recommender
Based on the dominant root cause domain per frame, the system recommends the specific corrective action with expected impact and links to a work order template for immediate execution.
Frequently Asked Questions
What is a realistic end break rate target for a well-run ring spinning mill?
For Ne 30–40 combed cotton at 18,000–20,000 rpm, a well-maintained mill should target 8–12 breaks per 100 spindle-hours. For Ne 50–60, 12–18 is achievable. For Ne 80+, up to 25 may be acceptable. The trend matters more than the absolute number — a mill moving from 22 to 14 breaks per 100 spindle-hours in 60 days is demonstrating effective RCA discipline even if not yet at benchmark.
How do I distinguish between a traveller-caused break and a spindle-caused break?
The primary differentiator is the temporal pattern. Traveller-caused breaks increase predictably with days since last change and cluster on spindles with similar traveller ages. Spindle-caused breaks recur on the same spindle regardless of traveller age. If spindle A breaks three times in a shift but spindle B on the same traveller cycle does not, the root cause is the spindle assembly — not the traveller.
Can root cause analysis be done without automated break detection sensors?
Yes — the seven-step methodology works with manual data collection. However, manual recording typically captures 50–60% of break events and introduces position bias (operators miss spindles at the far end of the frame). Mills using automated capture see twice the improvement rate because the data quality supports faster, more accurate diagnosis.
What is the single fastest corrective action a mill can take to reduce break rates this week?
Verify and correct relative humidity in the spinning room. RH below 48% is the single most common reversible cause of elevated break rates across all counts. A 5-point RH increase (e.g., from 45% to 50%) can reduce break rates by 15–25% within hours — no capital expenditure, no spare parts, no maintenance downtime.
How long does it take to deploy iFactory's automated RCA system?
Sensor installation on 8–16 frames takes 4–6 hours during a planned maintenance window. Break detection and spindle mapping are operational immediately. The RCA classifier begins generating domain probability assignments within 48 hours and reaches full accuracy after 14 days of training data. The dashboard is live from day one with basic break rate and clustering views.
Stop Counting Breaks. Start Diagnosing Them.
Your break data already contains every answer. iFactory's automated RCA engine classifies, tracks, and recommends — so your team spends less time guessing and more time fixing the root cause.