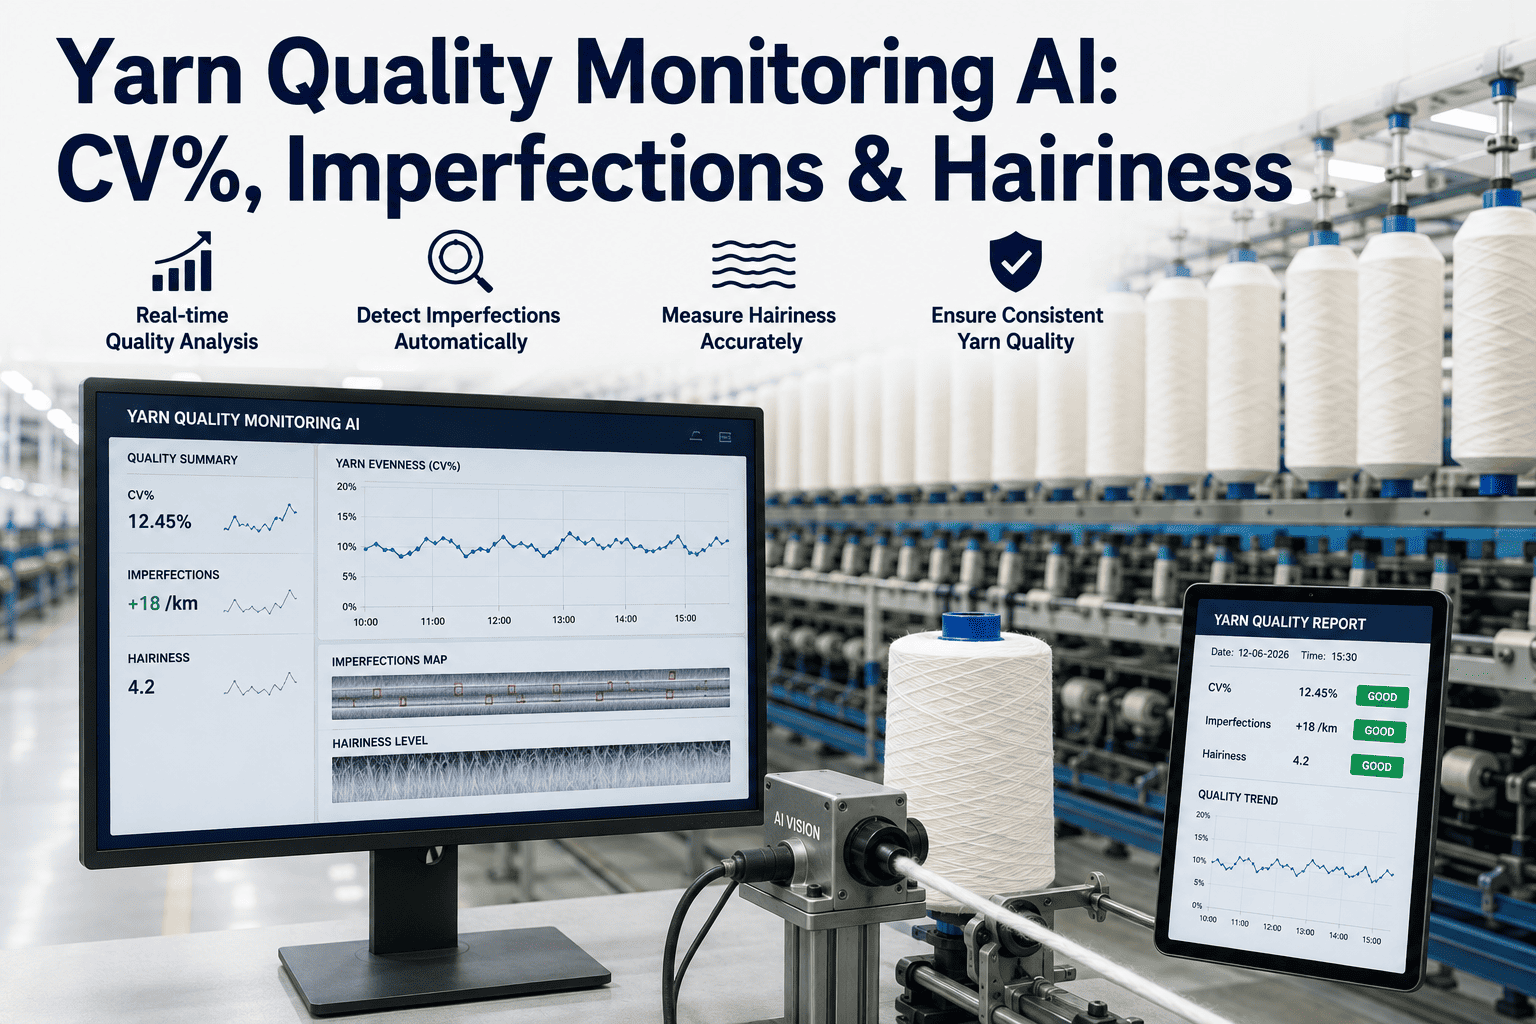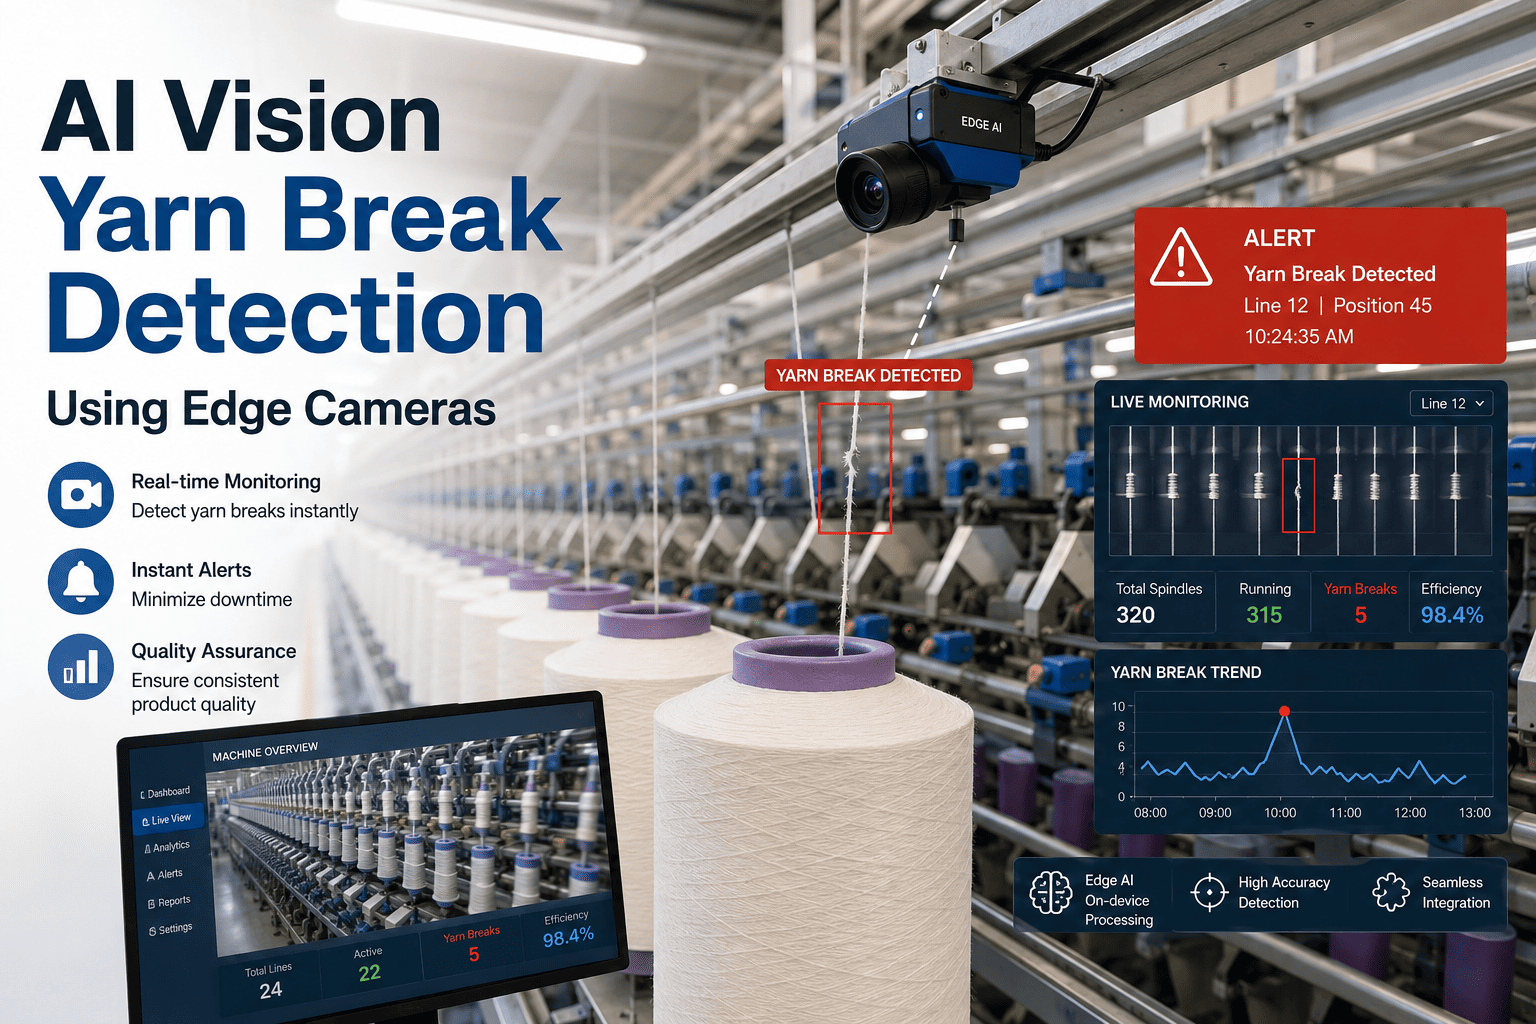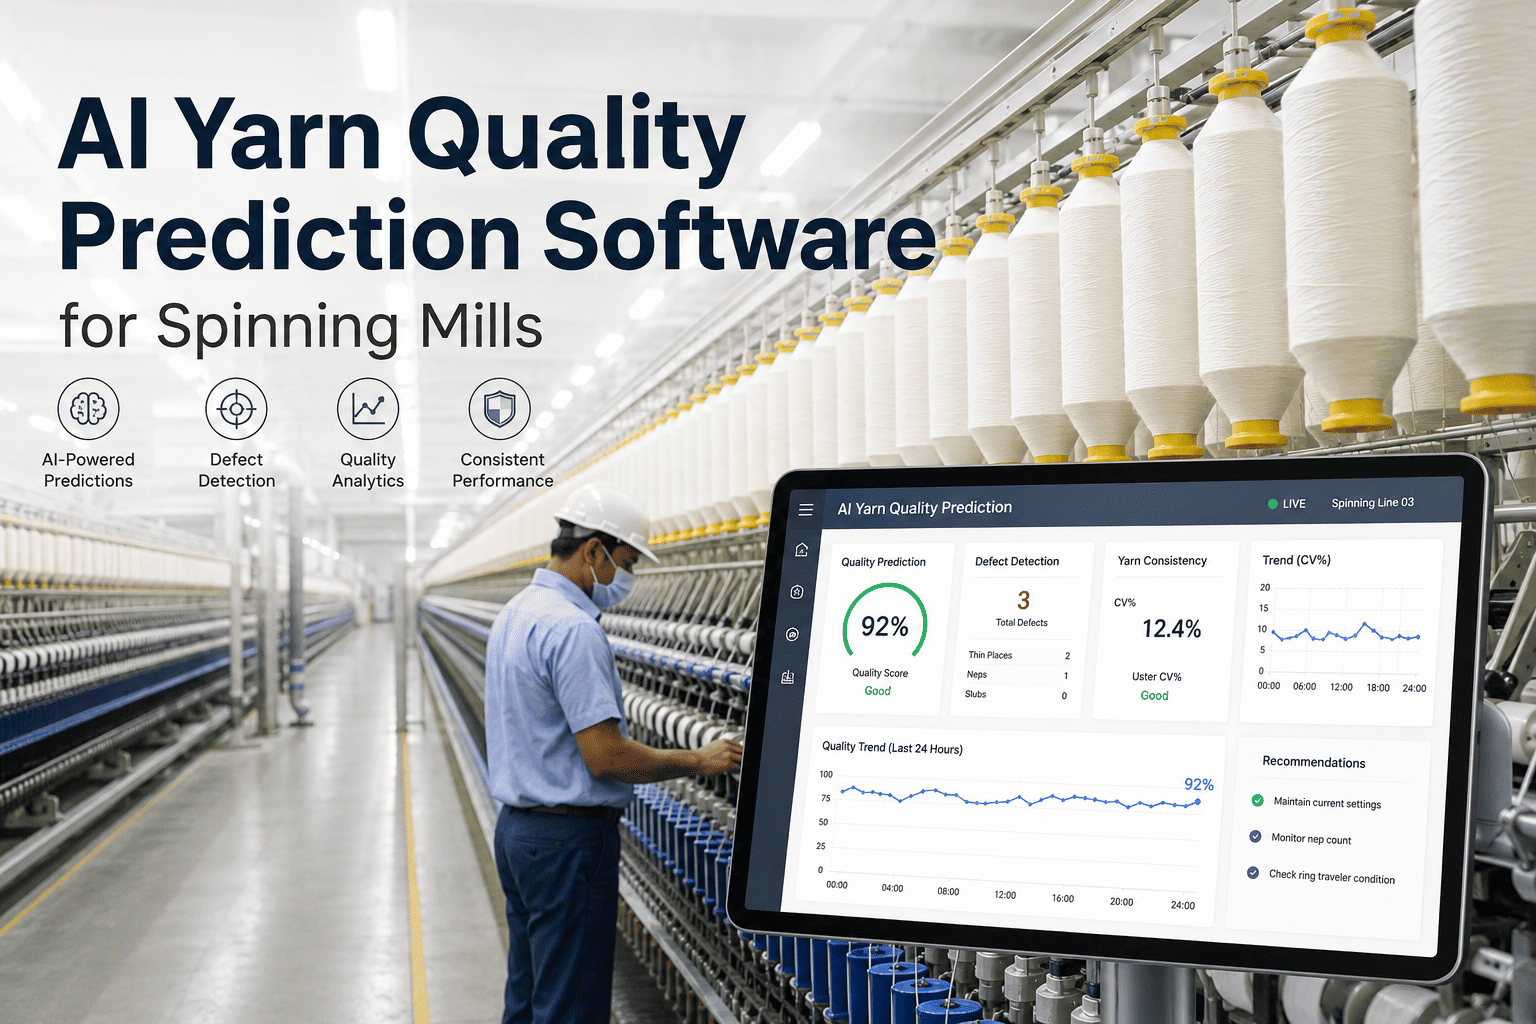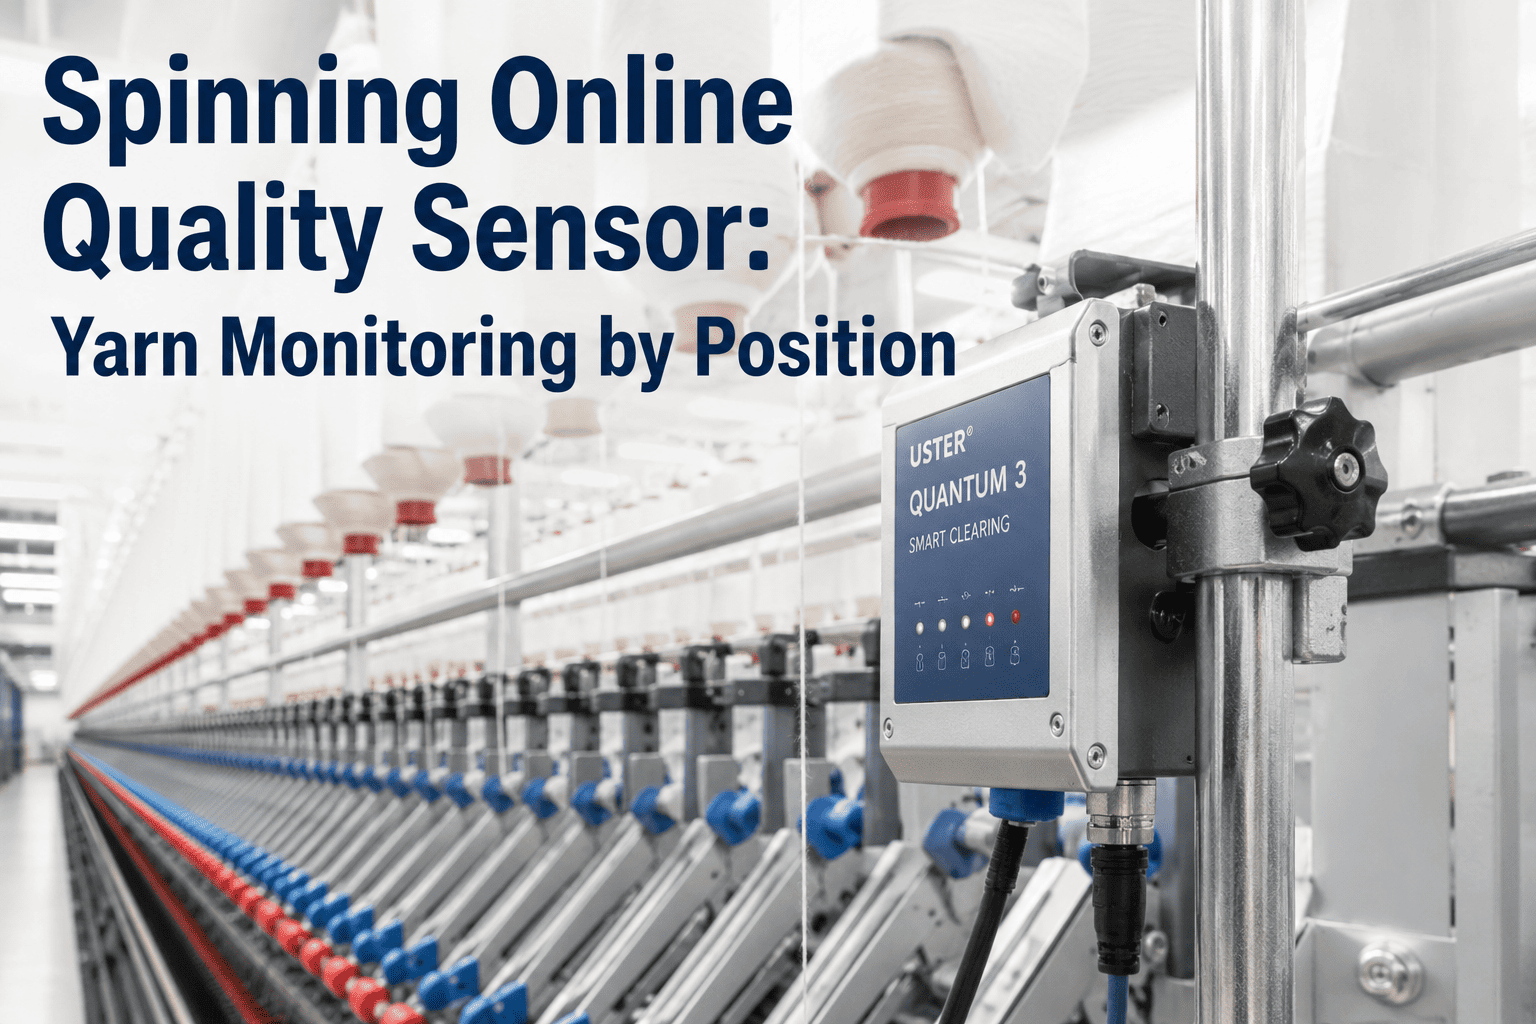
A spinning frame can run for hours with a single position drifting slowly out of specification, producing bobbin after bobbin of yarn that looks acceptable to a passing glance but fails evenness or imperfection standards once tested. By the time a periodic quality check catches the drift, that one position alone may have produced enough off-spec yarn to affect several downstream lots. Online quality sensors mounted at the position level change this entirely, tracking evenness, imperfections, and hairiness continuously as yarn is actually being formed, and flagging a drifting position within minutes rather than at the next scheduled sampling round. Book a demo of position-level spinning monitoring to see how this works on your frames.
Spinning Quality · Position-Level Monitoring
Online Quality Sensors for Spinning: Catch a Drifting Position Before It Becomes a Rejected Lot
Real-time evenness, imperfection, and hairiness measurement at every spinning position — turning periodic sampling into continuous, position-level surveillance.
What Gets Measured
Four Parameters Tracked Continuously at Every Position
Evenness (U% / CV%)
Continuous measurement of yarn mass variation along its length, catching gradual drift toward unacceptable unevenness long before a periodic sample would reveal it.
Imperfections
Real-time counting of thin places, thick places, and neps per kilometre, flagging positions producing imperfection rates outside your specification as they occur.
Hairiness Index
Ongoing measurement of protruding fibre count, an indicator both of yarn quality and of early wear or misalignment in the spinning mechanism itself.
Yarn Diameter Variation
Continuous diameter tracking that reveals gradual drift patterns invisible to spot-check sampling but clearly visible in a continuous trend line.
Each of these four parameters is tracked independently but also evaluated together as a combined position health picture, since a real quality issue often shows correlated movement across more than one parameter simultaneously. A position whose evenness and hairiness are both trending unfavourably at the same time is a stronger signal of a genuine mechanical or process issue than a single parameter drifting in isolation, which might simply reflect normal short-term variation. Combining parameters this way reduces false alarms while still catching genuine multi-symptom deviations earlier than a single-metric threshold system would.
The Sampling Gap
Why Periodic Sampling Misses What Continuous Monitoring Catches
Traditional spinning quality control relies on periodic sampling — pulling yarn from a subset of positions on a fixed schedule and testing it offline. This approach works reasonably well for catching a position that is already badly out of specification, but it structurally cannot catch gradual drift between sampling intervals, and it only ever examines a fraction of your total spinning positions at any given time. A position that begins drifting immediately after a sample is taken can run for the entire remaining interval before the next scheduled check, producing a significant volume of yarn that never gets evaluated until it reaches a downstream process — or a customer. The economics of this gap are rarely visible in a simple defect-rate metric, because the yarn produced during an undetected drift period is not usually classified as a defect at the point of production — it only becomes visible as a problem once it causes a downstream fault in weaving or knitting, at which point tracing the root cause back to a specific spinning position and time window is far more difficult than it would have been with continuous position-level data available from the start.
Periodic Sampling
Checks a subset of positions on a fixed schedule
Can miss drift that begins right after a check
Detection delay measured in hours
Reactive — confirms a problem already occurred
Online Position Sensors
Monitors every instrumented position continuously
Catches drift as it begins to develop
Detection delay measured in minutes
Proactive — flags a trend before it becomes a defect
See Position-Level Data From Your Own Frames
iFactory Connects Online Sensors to a Live Dashboard Your Team Can Actually Use
Raw sensor data is only useful if your team can see it, understand it, and act on it quickly. iFactory turns continuous position-level readings into a live dashboard with clear alerts, trend visualisation, and position-specific history — so a drifting position gets attention before it produces a rejected lot.
How Alerts Work
From Position Drift to Operator Action in Minutes
1
Continuous Baseline Tracking
Each position's sensor establishes a rolling baseline for evenness, imperfections, and hairiness under normal operating conditions specific to that position's typical performance.
2
Deviation Detection
When a position's readings begin drifting away from its established baseline or beyond your defined specification threshold, the system flags the trend rather than waiting for a hard limit breach.
3
Prioritised Alert
Alerts are prioritised by severity and trend speed, so operators can distinguish a slowly drifting position that has time for a scheduled check from one that needs immediate attention.
4
Operator Response and Logging
The operator's response — adjustment, cleaning, or component replacement — is logged against that position's history, building a maintenance record that helps identify positions with recurring issues.
This alerting workflow is deliberately designed around minimising disruption to normal operation while still ensuring genuine deviations receive prompt attention. Low-severity trend alerts are typically queued for review during the operator's normal rounds rather than demanding immediate action, while high-severity deviations that risk producing significant off-spec volume trigger a more urgent notification. This tiered approach avoids the alert fatigue that undermines less thoughtfully designed monitoring systems, where every deviation regardless of severity generates an identical urgent alert until operators begin ignoring the system altogether.
What Changes on the Floor
The Operational Impact of Position-Level Monitoring
Fewer Off-Spec Lots Reaching Downstream Processing
Catching drift within the position where it originates means fewer batches of marginal-quality yarn ever reach warping, weaving, or knitting, reducing the downstream rework and rejection this yarn would otherwise cause.
Earlier Detection of Mechanical Wear
A gradually rising hairiness index or evenness deviation is often an early indicator of mechanical wear in the spinning mechanism itself, giving maintenance teams a heads-up before the wear causes a harder failure.
Reduced Dependency on Manual Sampling Labour
Continuous automated monitoring reduces the labour hours currently spent on manual periodic sampling, freeing quality staff to focus on investigating flagged trends rather than routine sample collection.
Position-Level Performance History
A continuous data record per position builds a performance history that helps identify chronically underperforming positions needing deeper maintenance attention, rather than treating every position as equally reliable.
These four benefits compound over time rather than delivering their full value immediately at installation. In the first weeks after deployment, most of the value comes from catching individual drifting positions that would previously have gone unnoticed. Over subsequent months, the accumulated position-level history becomes increasingly valuable for maintenance planning, revealing patterns such as particular positions that drift more frequently after a certain number of operating hours, informing a more targeted and predictive maintenance schedule rather than a uniform calendar-based approach applied equally across every position regardless of its actual wear pattern.
Spinning Floor Perspective
The thing that surprises plant managers most when they first see continuous position-level data is how much variation exists between positions on the same frame that periodic sampling never revealed — you assume every position is performing roughly the same because your sample checks show acceptable averages, and then you see the actual position-by-position trend lines and realise two or three positions have been quietly drifting for weeks. That visibility alone, before any alerting logic even kicks in, changes how maintenance teams prioritise their attention on the floor.
Radomir Vasquez-Lindqvist
Spinning Operations Manager · 14 years in ring and rotor spinning quality systems · Certified textile quality engineer, specialising in in-process monitoring deployment
Beyond the immediate quality catch, teams that have run continuous position-level monitoring for an extended period often report a secondary benefit that was not part of the original business case: the data becomes a valuable input for process improvement projects unrelated to defect prevention, such as identifying which machine settings or maintenance schedules correlate with the best-performing positions and using those insights to raise the baseline performance of underperforming positions rather than simply reacting to individual deviations as they occur.
Spinning Sensor Questions
Frequently Asked Questions
Do we need to instrument every single spinning position, or can we start with a subset?
A phased rollout starting with a subset of positions — often the frames or positions with the highest historical defect rate or the newest, highest-value product running through them — is a common and reasonable approach that lets your team validate sensor accuracy and build operational familiarity with the alert workflow before expanding coverage. Full-frame or full-plant coverage delivers the most complete visibility, but a well-chosen pilot subset still delivers meaningful value and de-risks the larger rollout decision. Book a call to discuss a phased deployment plan suited to your frame count and budget.
How accurate are online sensors compared to laboratory testing equipment we currently use for periodic sampling?
Modern online quality sensors are designed to correlate closely with standard laboratory testing methods for evenness, imperfections, and hairiness, though they measure continuously in the production environment rather than under the controlled conditions of a laboratory instrument, which means initial calibration against your existing lab equipment is an important commissioning step. Once calibrated and validated against your lab results, online sensors typically provide directionally reliable, continuously updated readings that are more than sufficient for trend detection and drift alerting, even if occasional laboratory verification remains valuable for formal specification compliance reporting.
What happens if a sensor itself malfunctions or gives an inaccurate reading — how do we avoid false alarms?
Sensor malfunction is a legitimate operational consideration, and a well-designed monitoring system includes self-diagnostic checks that flag when a sensor's own readings appear inconsistent or out of expected range, distinguishing a genuine yarn quality deviation from a sensor fault. Regular calibration checks and a clear escalation path for suspected sensor malfunction, separate from the yarn quality alert workflow, help your team quickly distinguish between the two scenarios and avoid unnecessary line stops caused by faulty sensor readings rather than actual yarn defects. Contact support for details on our sensor validation and calibration process.
Can this system integrate with the spinning frame monitoring or MES systems we already have installed?
Integration with existing frame monitoring and MES systems is generally achievable, since most modern spinning quality sensors are designed with standard industrial communication protocols specifically to support integration into a plant's broader data infrastructure rather than operating as an isolated standalone system. The specific integration approach depends on your current MES platform and its available data interfaces, so a technical review of your existing systems is a useful first step before finalising a sensor deployment plan. This review typically covers what data your current MES already captures, where the new position-level sensor data would add value versus duplicate existing coverage, and how alerts should be routed so operators are not required to monitor multiple disconnected dashboards for what should be a single unified quality picture. Book a session with our integration team to review compatibility with your current systems.
How much operator training is required to work effectively with continuous position-level alerts?
Operators generally need training focused less on the underlying sensor technology and more on how to interpret alert severity, what response is appropriate for different types of flagged deviation, and how to log their response correctly so the system builds an accurate position history over time. Most plants find operators adapt to the new alert workflow within a few weeks of exposure, particularly when the alert interface clearly distinguishes between low-priority trend notifications and high-priority deviations requiring immediate action, avoiding the alert fatigue that can occur with poorly tuned or poorly explained systems. A short structured onboarding session covering the four core parameters, what a typical alert looks like, and a few worked examples of past deviations and their correct resolution tends to be sufficient preparation, with ongoing familiarity building naturally through day-to-day exposure to real alerts on the floor.
Stop Waiting for the Next Sample to Find Out a Position Has Drifted
Give Every Spinning Position Continuous, Real-Time Quality Visibility
iFactory connects online quality sensors at the position level to a live monitoring dashboard, catching evenness, imperfection, and hairiness drift as it develops — before it turns into a rejected lot or a downstream quality escape.