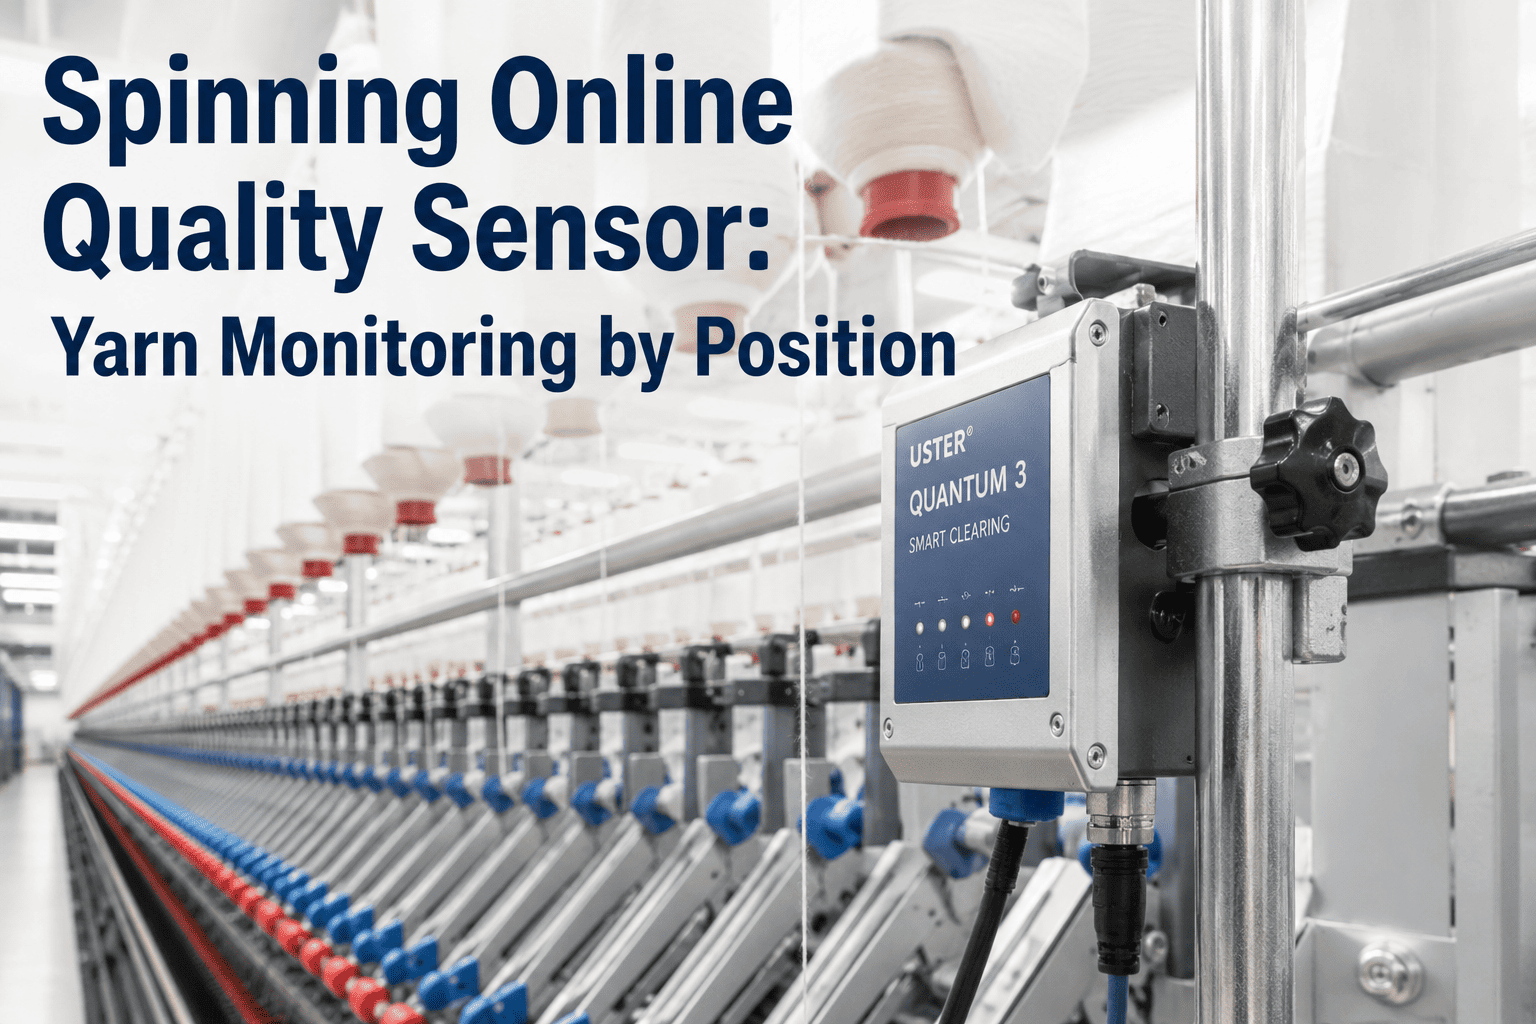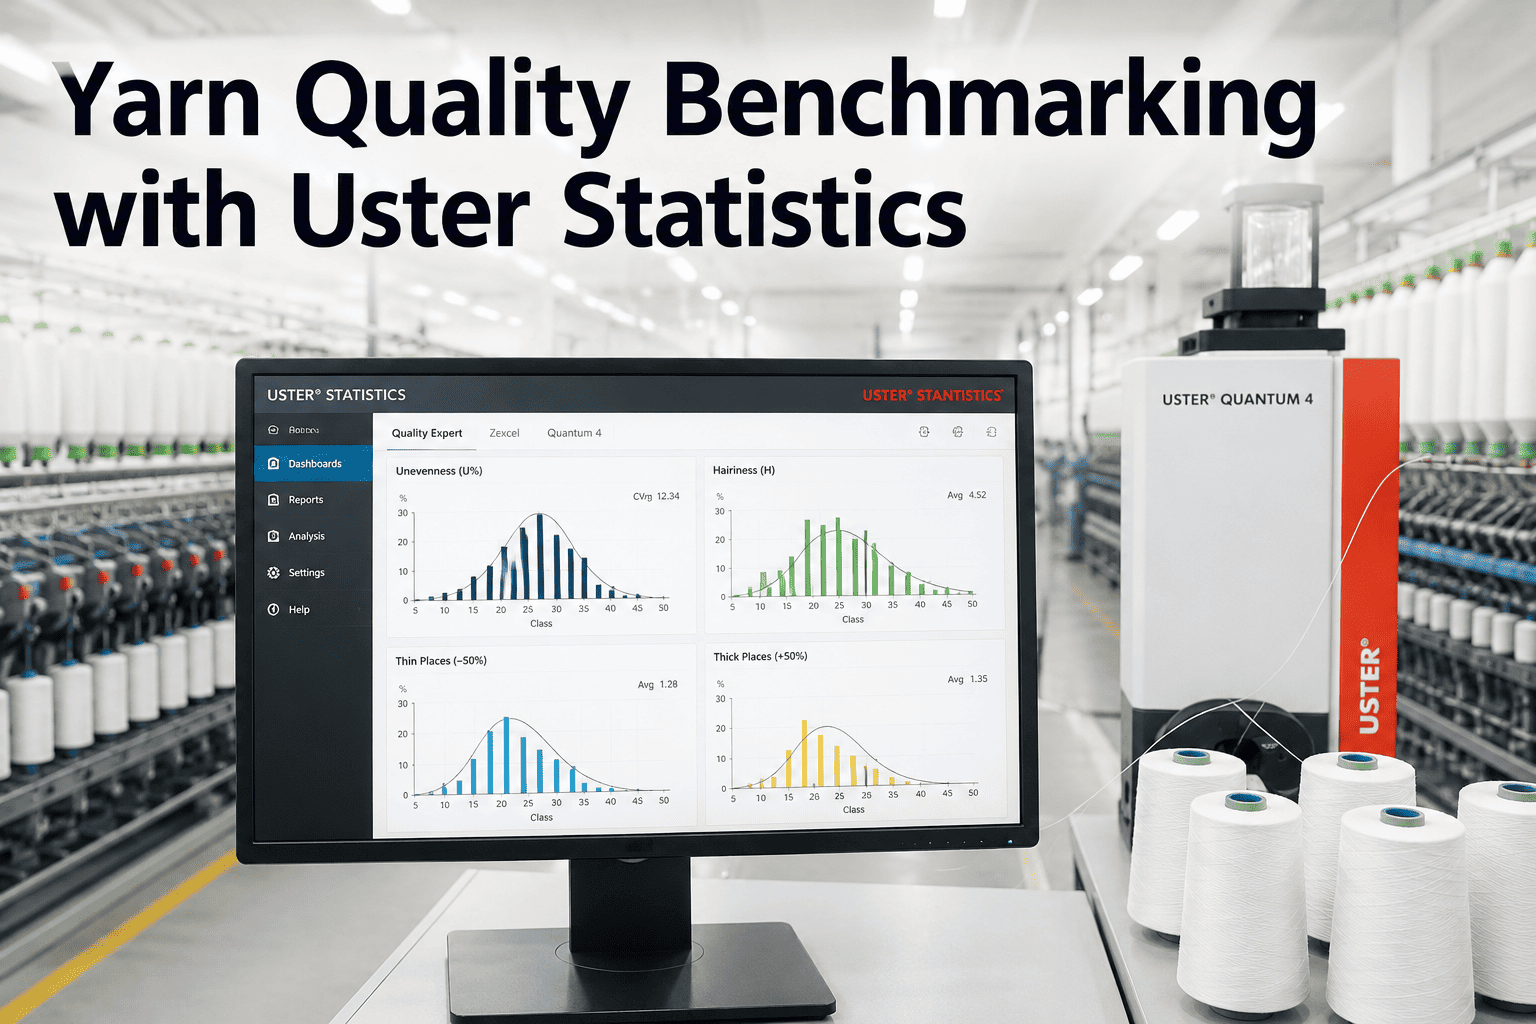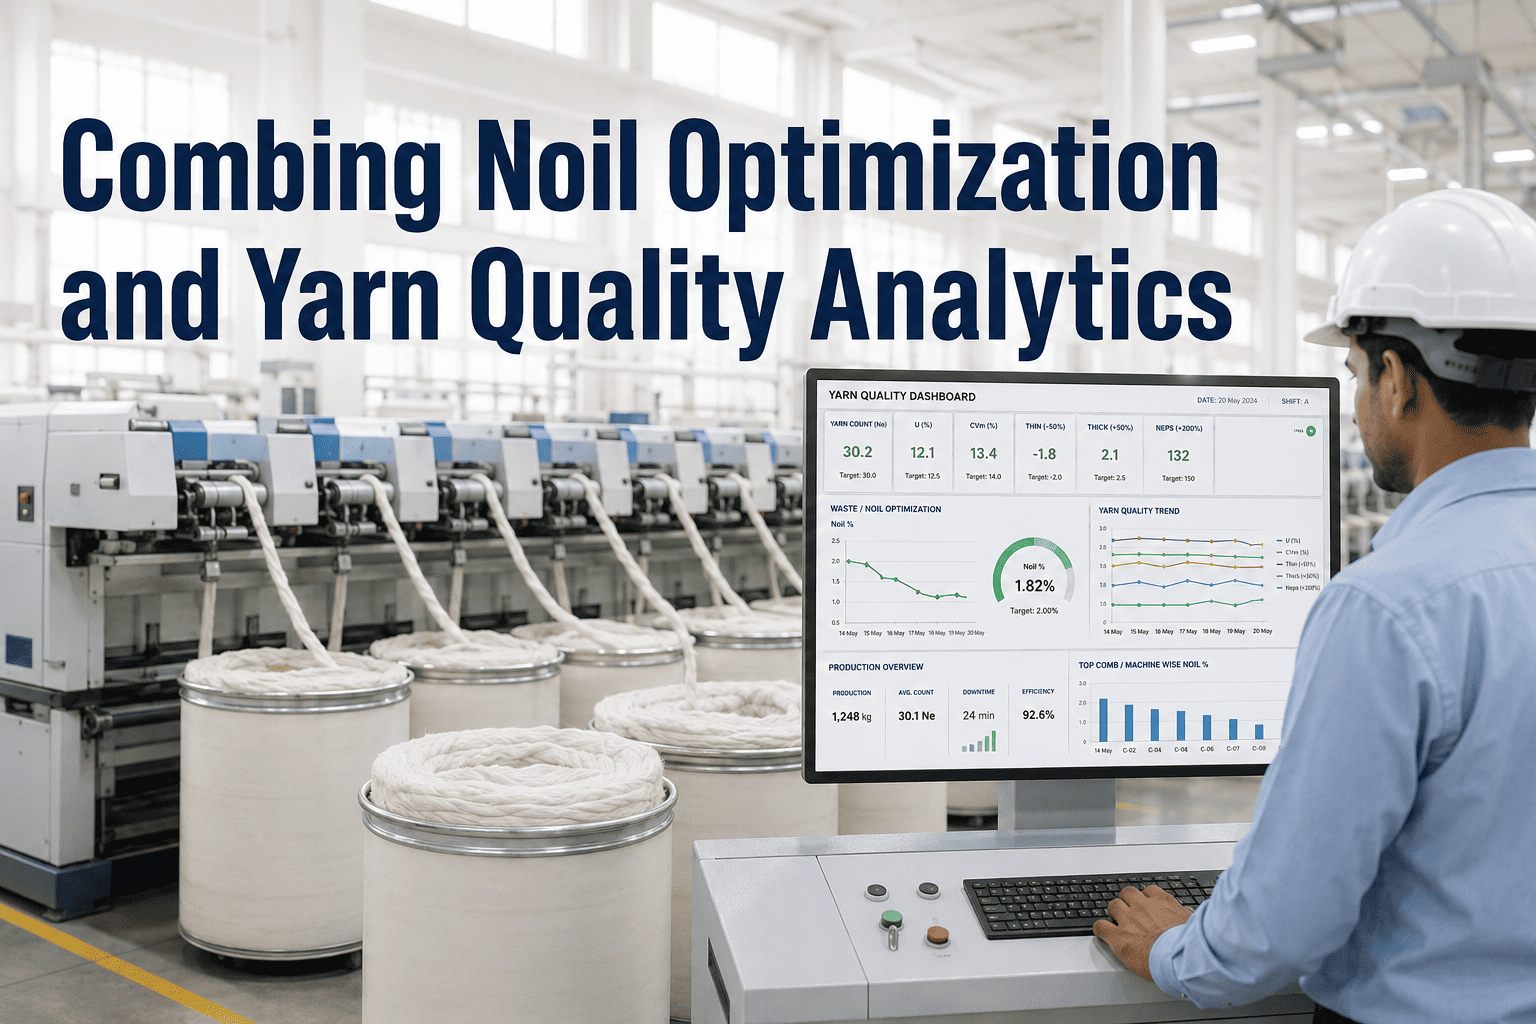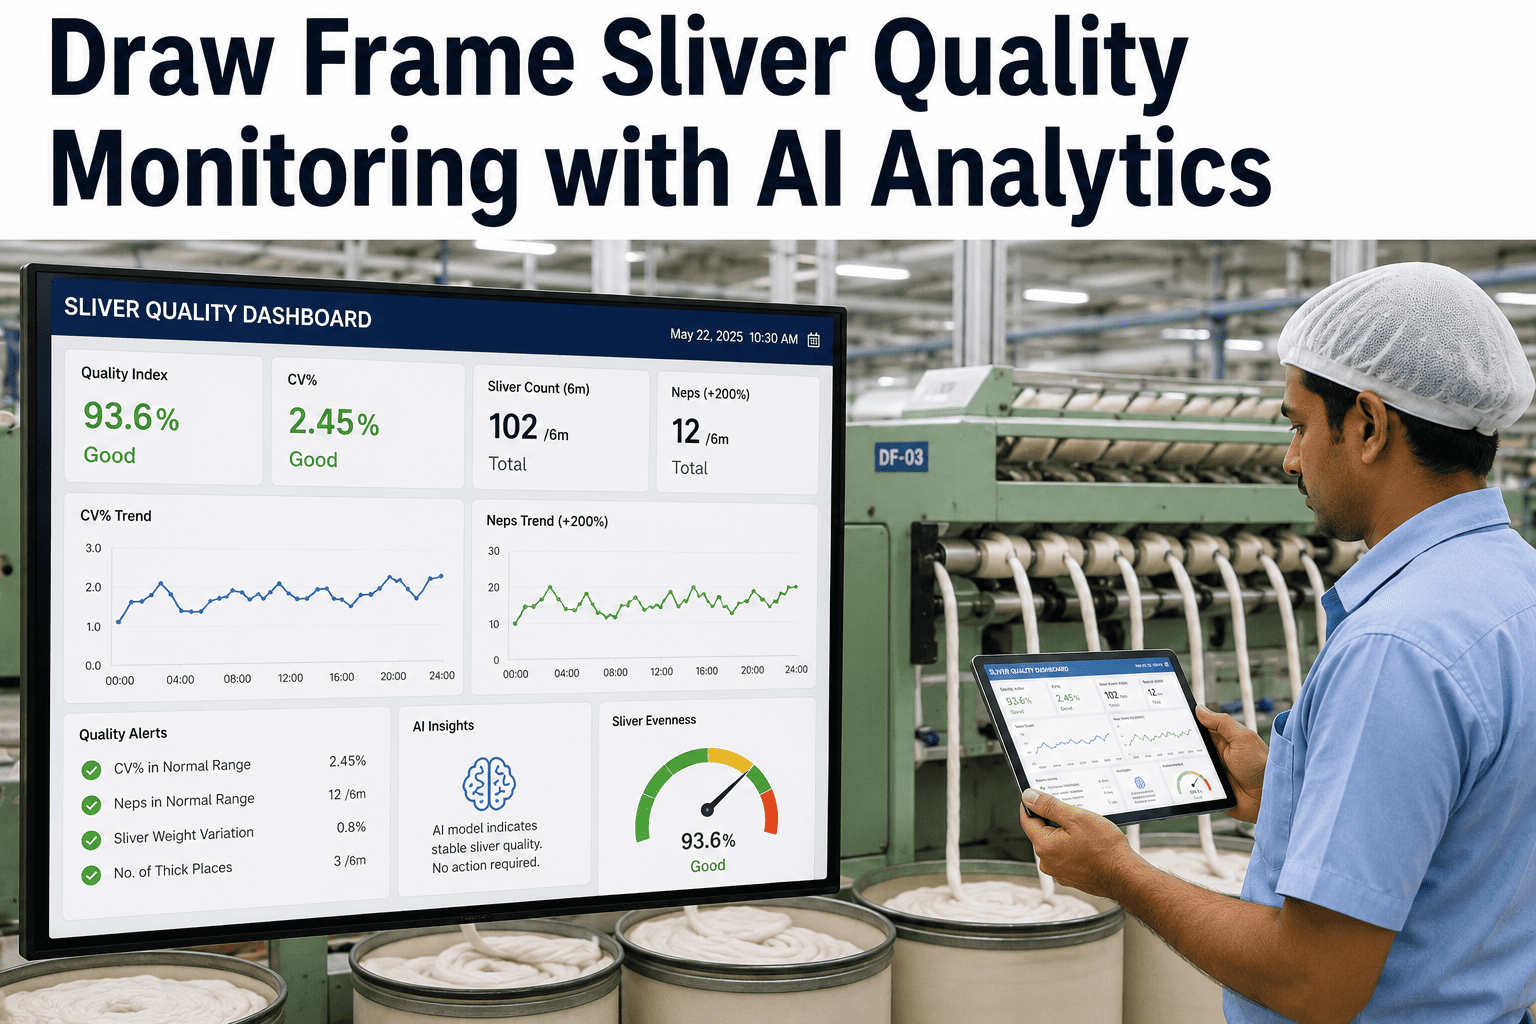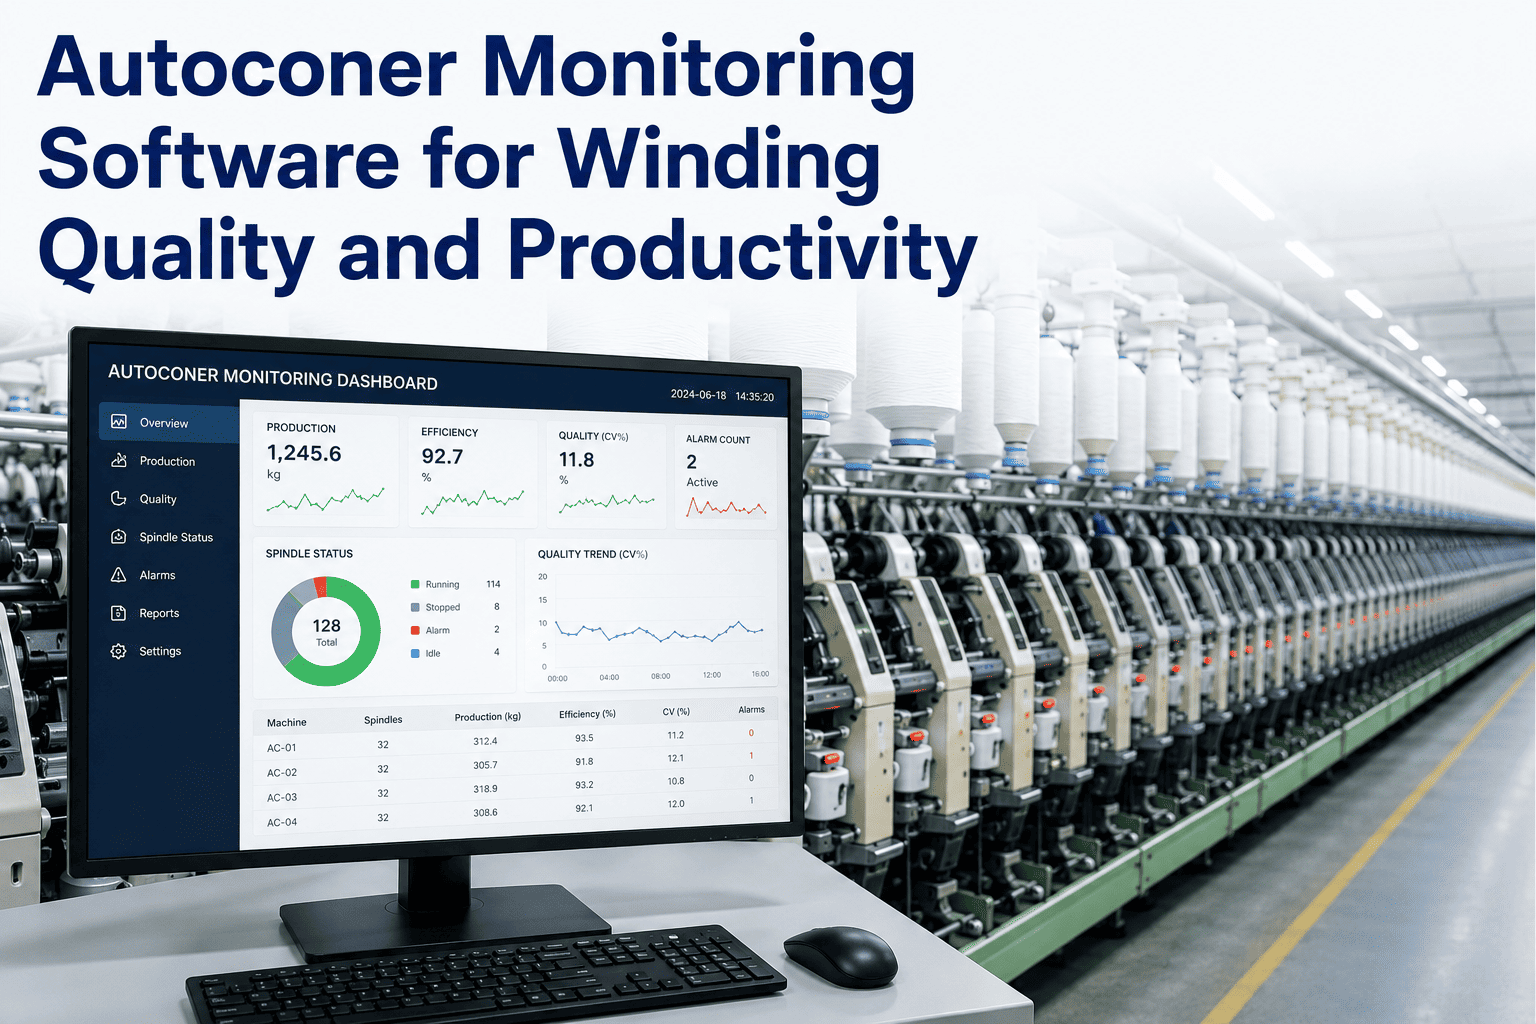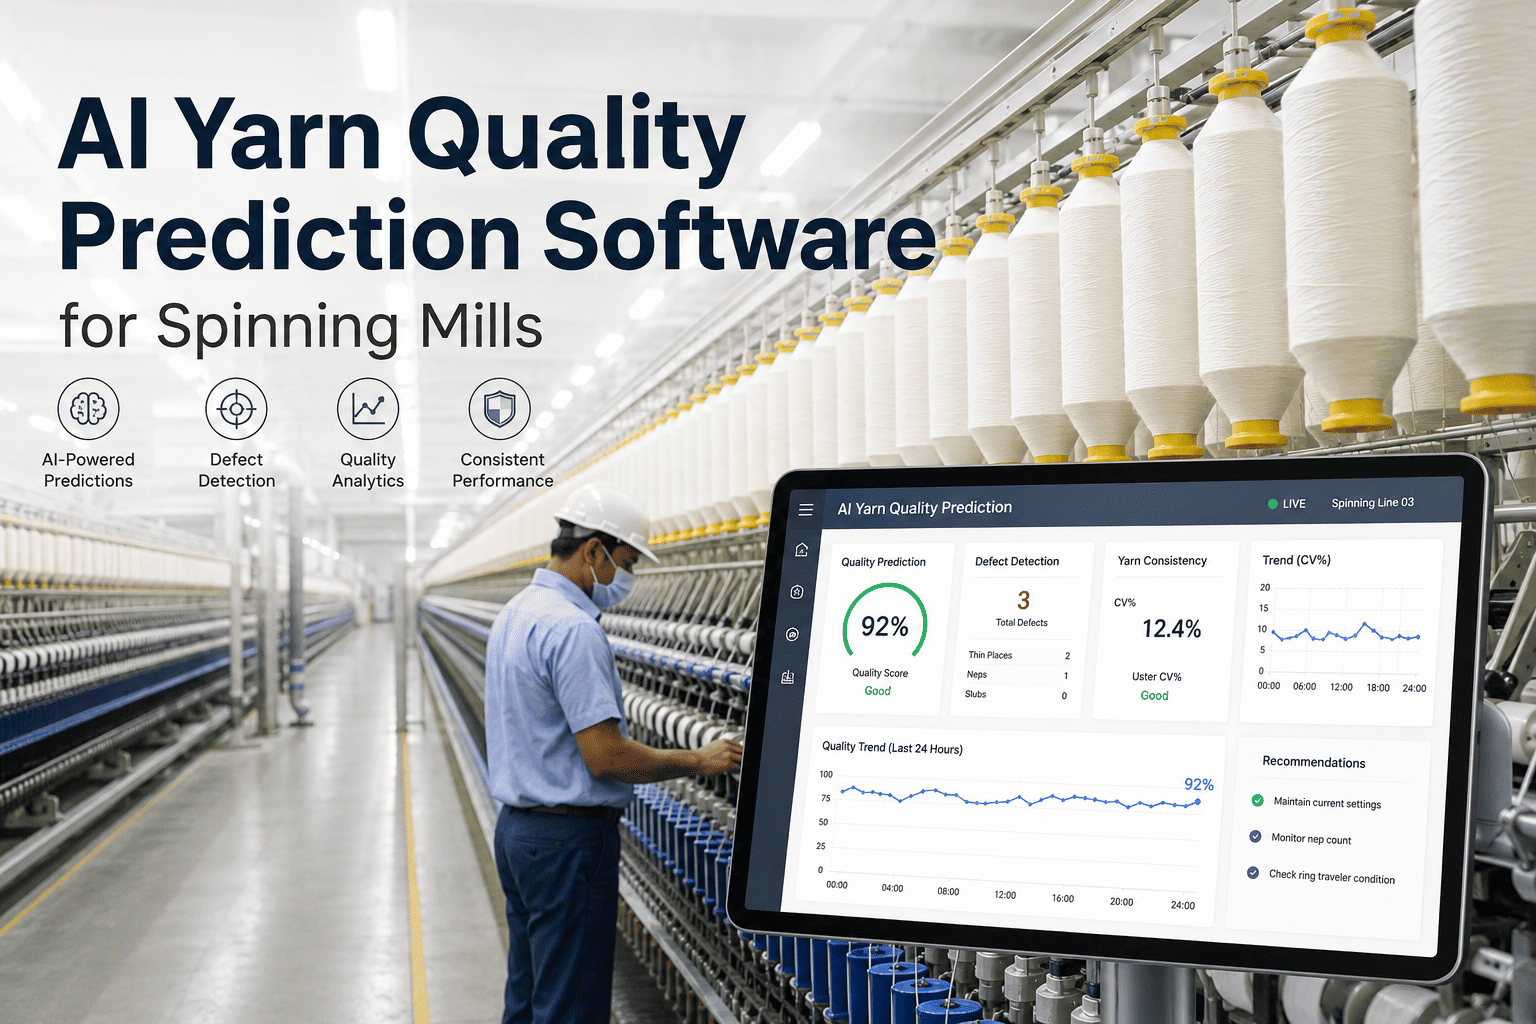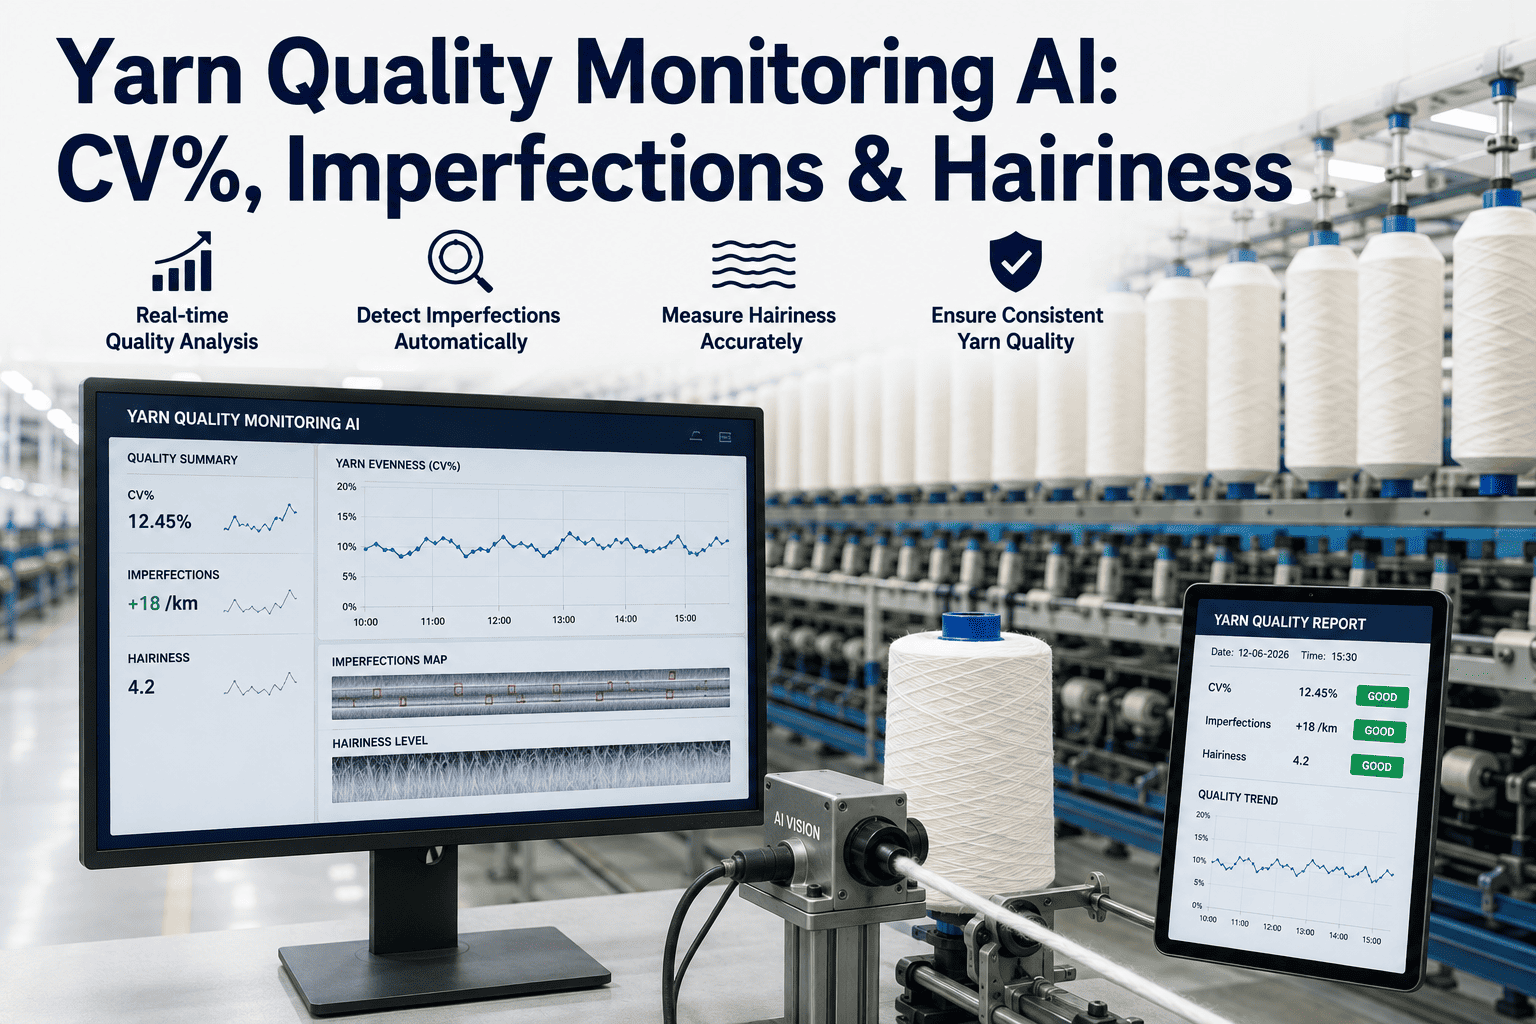
Traditional yarn quality control samples a small fraction of total production, tests it offline in a lab, and reports results long after the yarn in question has already been wound, packed, or in worse cases, already delivered to a customer. By the time a quality problem is confirmed, the run that produced it is finished, and the only remaining question is how much of it needs to be reworked or scrapped. Continuous AI-based monitoring changes the timing entirely — quality parameters are read from every meter of yarn as it is spun, not sampled after the fact, which means a drifting parameter can be caught and corrected mid-run instead of discovered after the run is already complete. Mills wanting to see this in action can Book a Demo.
Sample Testing vs. Continuous Monitoring: A Fundamentally Different Detection Window
Conventional yarn quality control relies on periodic sampling — a technician pulls a length of yarn from a bobbin at set intervals, runs it through a testing instrument, and records the results against that spindle or that shift. This approach has served the industry for decades and remains useful, but it has a structural limitation that no amount of testing discipline can fully overcome: it only sees the yarn produced at the moment of sampling, and everything produced between samples is inferred, not measured.
If a spinning frame begins drifting out of specification shortly after a sample was pulled, that drift can continue undetected for the entire interval until the next scheduled sample, which on many mills' testing schedules can represent a substantial volume of yarn already produced under out-of-spec conditions before anyone notices. The defect is real and present in the yarn the entire time; it simply is not visible to the quality system until the next sampling point happens to catch it.
AI-based continuous monitoring closes this detection gap by reading quality parameters from sensors integrated directly into the spinning process, generating a continuous data stream rather than discrete sample points. Every meter of yarn contributes a data point, which means a parameter drift is visible from the moment it begins rather than discovered whenever the next scheduled sample happens to be pulled. The practical difference this makes is not a marginal improvement in data density — it is the difference between catching a problem in its first few minutes versus discovering it only after an entire shift's production has already been affected.
From Alarm to Lot Segregation: How the Workflow Actually Runs
Continuous monitoring only delivers value if the data it generates triggers a clear, automated response rather than sitting unreviewed in a dashboard. A well-designed alarm and segregation workflow follows a specific sequence that moves from detection to corrective action with minimal manual intervention required at each step.
What Trending Data Reveals That a Single Reading Cannot
A single quality reading, whether from a periodic sample or a single continuous data point, tells you whether that specific measurement was in or out of specification. It does not tell you whether the process is stable or gradually drifting toward a threshold it has not yet crossed. This distinction matters enormously for how proactively a mill can manage yarn quality, and it is one of the most underused capabilities of continuous monitoring even in mills that have already implemented it.
Trending analysis looks at the trajectory of a parameter over time rather than its instantaneous value, and this trajectory frequently reveals problems well before any individual reading would trigger a threshold-based alarm. A CV% reading that is technically within specification but has been steadily climbing over the past several hours is a materially different situation than a CV% reading holding flat near the same value, even though a simple threshold check would treat both readings identically. The trending case represents a process heading toward an eventual excursion; the flat case represents a stable process that happens to be running somewhat elevated.
Mills that build trend-based alerting alongside simple threshold alerting catch a meaningfully different, earlier class of problem — the slow mechanical wear on a component, the gradual drift in fiber feed consistency, the accumulating effect of a machine setting that was adjusted slightly out of optimal range during a previous shift change. None of these produce an immediate threshold breach on their own, but all of them show up clearly as a trend once enough continuous data points are available to establish one.
There is also a maintenance-planning benefit to trend visibility that goes beyond the immediate quality question. A component wearing down gradually enough to produce a slow CV% or hairiness drift over several days or weeks is a maintenance signal as much as a quality signal, and mills that connect trend data back to their maintenance scheduling function gain an early warning system for mechanical issues that would otherwise only surface as a sudden, more disruptive failure later. This connection between quality trend data and predictive maintenance is one of the areas where continuous monitoring delivers value well beyond its original quality-control purpose, extending the return on the underlying sensor and data infrastructure investment considerably further than a quality-only framing would suggest.
Where AI Adds Value Beyond Simple Threshold Monitoring
The term "AI monitoring" covers a range of capability, and it is worth distinguishing basic threshold alerting — which is really just automated rule-checking, not genuinely AI-driven — from the pattern-recognition capabilities that justify the AI label and deliver meaningfully more value on top of the continuous data stream.
Anomaly detection models trained on a mill's own historical production data can identify unusual parameter combinations that would not trigger any single threshold individually but that historically correlate with downstream quality problems. A CV% reading and a hairiness reading might each independently sit within acceptable range, but a model trained on historical patterns can recognize that this specific combination, at this specific point in a production run, has historically preceded a quality escape — a correlation that a human reviewing each parameter separately against its own threshold would have no way to notice.
Predictive alerting takes this further by estimating the likely trajectory of a parameter based on its recent trend and historical patterns from similar production runs, flagging a probable future breach before it actually occurs rather than only reacting once a threshold is crossed. This shifts the operator's role from responding to problems after they happen toward intervening based on a forecasted risk, which — when the underlying model is well-calibrated to the mill's actual process behavior — meaningfully reduces the volume of yarn produced under drifting conditions before a correction is made.
Sensor Placement and Data Quality: The Foundation the AI Depends On
Every AI capability described so far depends entirely on the quality and completeness of the underlying sensor data feeding it, and this foundational layer is worth as much attention as the analytics built on top of it. A model, however sophisticated, produces unreliable output when trained on inconsistent or poorly calibrated sensor readings, and mills sometimes underinvest in this groundwork while over-investing in the analytics layer that sits above it.
Sensor calibration drift is the most common data quality issue in practice. Optical and capacitive sensors used for evenness and imperfection detection require periodic recalibration to maintain measurement accuracy, and a sensor that has drifted out of calibration produces systematically biased readings that can either mask real quality problems or generate false alarms, depending on the direction of the drift. A disciplined recalibration schedule, verified against known reference standards, is unglamorous maintenance work but directly determines whether the continuous data stream feeding the AI layer can be trusted.
Sensor placement and coverage also matter more than mills sometimes expect going in. Monitoring every spindle on every frame produces the most complete picture but carries a real cost in sensor hardware and data infrastructure. Many mills instead implement a hybrid approach — comprehensive monitoring on a representative subset of positions per frame, statistically validated to represent the frame's overall output, supplemented by full coverage on frames or products where quality risk is highest. This kind of coverage decision should be made deliberately, weighing the marginal detection value of additional coverage against its cost, rather than defaulting either to full coverage everywhere or to minimal coverage that leaves meaningful blind spots in the data.
Data retention and storage architecture is a related, often overlooked consideration. Continuous monitoring across many spindles generates a substantially larger data volume than periodic sampling ever did, and mills need a deliberate policy for how long raw, high-frequency sensor data is retained at full resolution versus aggregated into shift-level or lot-level summaries for longer-term storage. Keeping every raw reading indefinitely is rarely necessary or cost-effective, but discarding raw data too aggressively can undermine the trend and anomaly-detection capabilities that depend on having enough historical granularity to train against. Most mills settle on a tiered approach — full-resolution data retained for a rolling recent window sufficient for active trend analysis, with older data aggregated into summary statistics that still support longer-term pattern review without the storage burden of retaining every individual reading indefinitely.