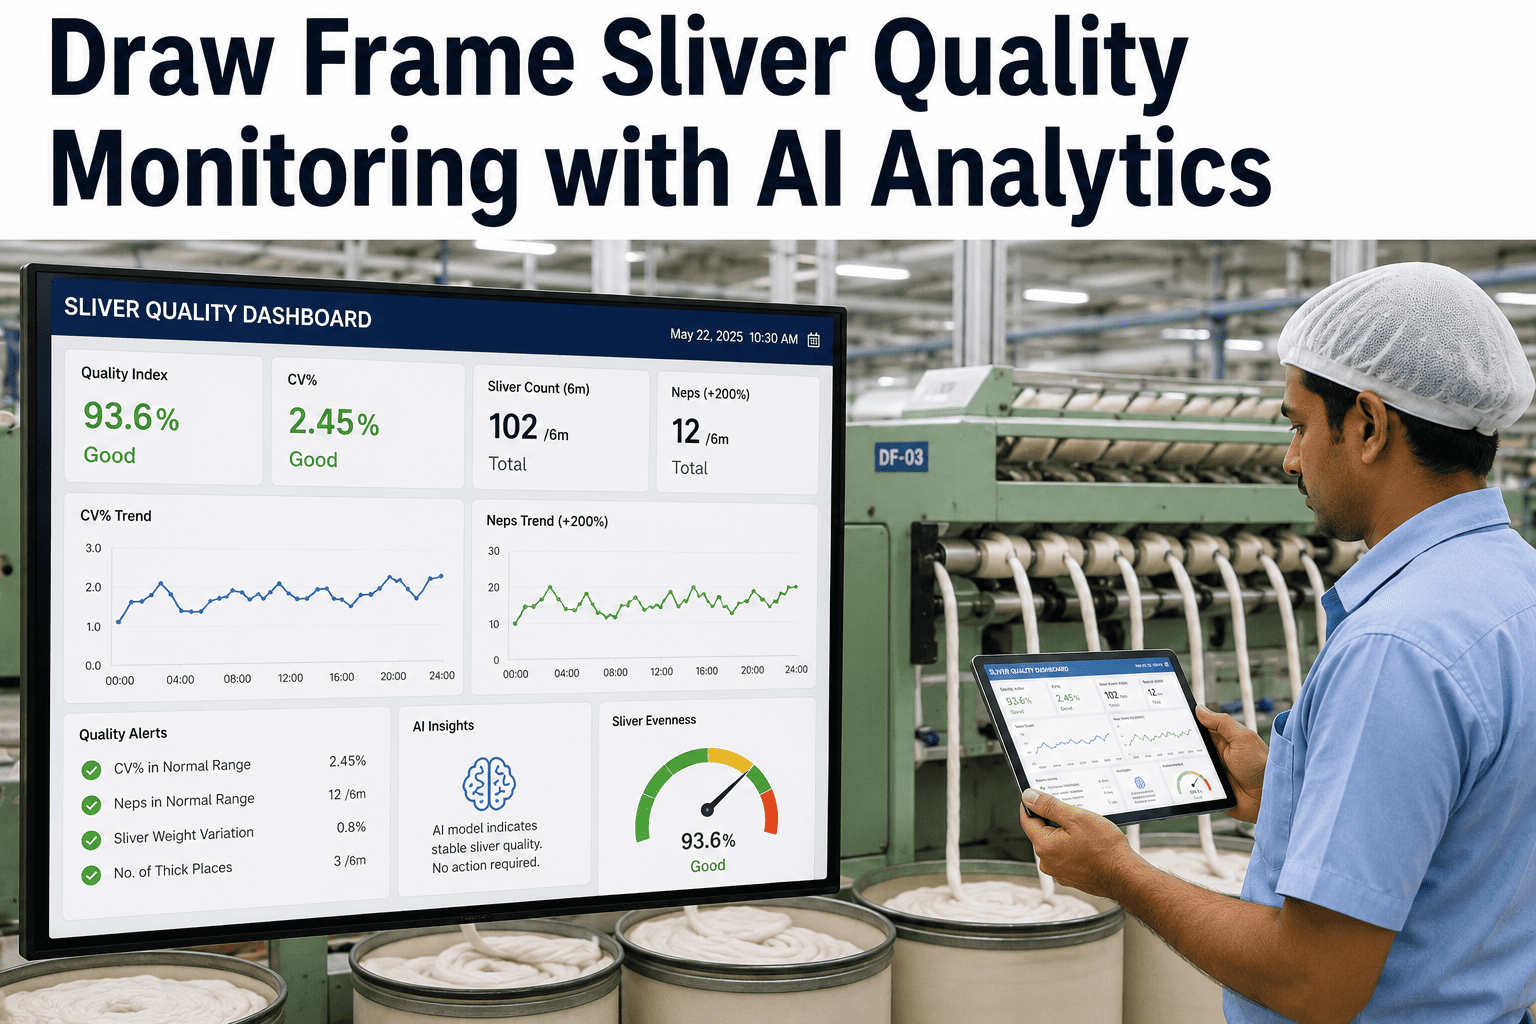
The draw frame is where a mill either corrects the unevenness carried forward from carding or quietly passes it downstream to become a yarn quality problem several stages later. Autolevellers exist specifically to catch and correct that unevenness in real time, but an autoleveller quietly drifting out of calibration doesn't stop working, it just starts correcting less accurately, and sliver CV creeps upward without triggering any alarm. By the time that drift shows up as a yarn evenness complaint, tracing it back to a specific draw frame and delivery is far harder than catching the drift at the source. AI analytics on sliver CV and autoleveller performance catches that drift while it's still small, and process engineers can book a demo to see it against their own draw frame data.
SPINNING ANALYTICS · DRAW FRAME QUALITY
Catch Autoleveller Drift Before It Becomes a Yarn Complaint
AI analytics tracks sliver CV, autoleveller correction accuracy, and delivery speed continuously, catching gradual drafting drift long before it shows up as an evenness problem downstream.
Sliver CV% Trend, Four Weeks, One Delivery
A gradual upward drift like this rarely trips a single-point alarm, but it's exactly the pattern that precedes a downstream evenness complaint.
Why Gradual Drift Is Harder to Catch Than a Sudden Failure
A sudden autoleveller failure is easy to catch because it produces an obvious, immediate quality problem that someone notices quickly. Gradual drift is the harder case: correction accuracy degrades by a small amount each week, sliver CV creeps up slowly, and no single reading crosses an alarm threshold until the cumulative drift has already been happening for a month or more.
This is precisely the pattern that continuous trend analysis is built to catch. A single CV reading in isolation doesn't tell you much, but a CV trend line moving steadily in one direction over several weeks is an unambiguous signal that something in the drafting or leveling process needs attention, well before it becomes a yarn-stage quality issue.
SEE YOUR OWN CV TREND
Watch Drift Get Flagged Before It Reaches Spinning
A working session using your own draw frame and autoleveller data.
What Gets Monitored on Every Delivery
| Parameter | What Drift Usually Indicates |
|---|
| Sliver CV% | Overall evenness degrading, often tied to leveling accuracy |
| Autoleveller Correction Accuracy | Sensor calibration or servo response drifting out of spec |
| Delivery Speed Consistency | Mechanical wear affecting consistent draft ratios |
| Drafting Zone Tension | Roller setting drift not matched to current fiber or count |
Continuous
CV and correction accuracy are tracked on every delivery, not sampled periodically
Weeks Earlier
Trend-based detection typically catches drift well before a threshold alarm would
Traced to Source
A downstream yarn issue can be traced back to the specific delivery and date it began
What a Process Engineer Told Us
Our autoleveller was still technically within spec on any single reading, but the CV trend had been creeping up for almost a month before we caught it through the analytics. A single spot check would never have shown us that, it only became obvious once we could see the trend line.
Process Engineer, Spinning Preparatory Department
Comparing Deliveries Side by Side, Not One at a Time
A draw frame with multiple deliveries can develop drift on one delivery while the others stay stable, and reviewing each delivery's data in isolation makes it easy to miss that the problem is localized rather than machine-wide. Viewing all deliveries on the same frame side by side makes an isolated delivery issue visually obvious in a way that scanning separate reports rarely does, and it also helps rule out a frame-wide cause, like a shared drive system issue, when every delivery moves together.
Humidity's Role in Sliver Evenness
Draw frame performance is sensitive to the same humidity and temperature conditions that affect ring frame breaks, and a sliver CV increase during a seasonal humidity swing can easily be mistaken for autoleveller drift if environmental data isn't part of the comparison. Tracking CV trends alongside logged department humidity separates a genuine mechanical or calibration issue from a seasonal pattern that will resolve on its own once conditions normalize, which prevents unnecessary recalibration work chasing a problem that isn't really there.
What a Meaningful CV Shift Looks Like
| Signal | What It Usually Means |
|---|
| Sustained upward CV trend over 2+ weeks | Likely autoleveller correction drift, worth investigating |
| Single-day CV spike, no trend | Often a raw material or humidity blip, not mechanical |
| CV rises only on one delivery | Points to that specific delivery, not the whole frame |
| CV rises across all deliveries together | Points to a shared cause like drive system or humidity |
Frequently Asked Questions
Does this replace the autoleveller's own built-in sensors?
No, the analytics platform reads data from the autoleveller's existing sensors and correction logs rather than replacing the leveling hardware itself. It adds a trend and pattern layer on top of data the machine is already producing, which most mills aren't capturing or analyzing over time in a structured way. Teams can
book a demo to see how existing sensor data feeds the trend view.
How is a genuine drift pattern separated from normal day-to-day variation?
The system establishes a baseline range for each delivery and fiber type from historical data, then flags sustained directional movement outside normal variation rather than reacting to single noisy readings. This statistical approach is what allows it to catch slow drift without generating false alarms from ordinary shift-to-shift fluctuation.
Can this help decide when an autoleveller needs recalibration versus replacement?
Trend history showing how correction accuracy has degraded over time, combined with maintenance records, gives a much clearer basis for that decision than a single point-in-time inspection. Mills often use this history to justify recalibration timing or, in cases of consistent decline despite recalibration, a hardware replacement decision. Specific maintenance planning can be discussed through
support.
Does fiber type or blend affect the baseline used for comparison?
Yes, baselines are established separately for each fiber type and blend, since normal CV range varies meaningfully between, for example, pure cotton and a cotton-polyester blend. Comparing current performance against the wrong baseline would produce misleading drift signals, so this separation is built into how the analytics are configured.
How quickly can drift actually be caught once monitoring is running?
Once a baseline is established, which typically takes a few weeks of initial data collection, ongoing drift detection can flag a developing pattern within days of it starting to diverge from normal range. This is a significant improvement over discovering the same drift only after it surfaces as a yarn-stage quality complaint weeks or months later.
CATCH DRIFT WHILE IT'S STILL SMALL
Stop Yarn Evenness Problems Before Spinning
See how CV and correction accuracy trend on your own draw frames.