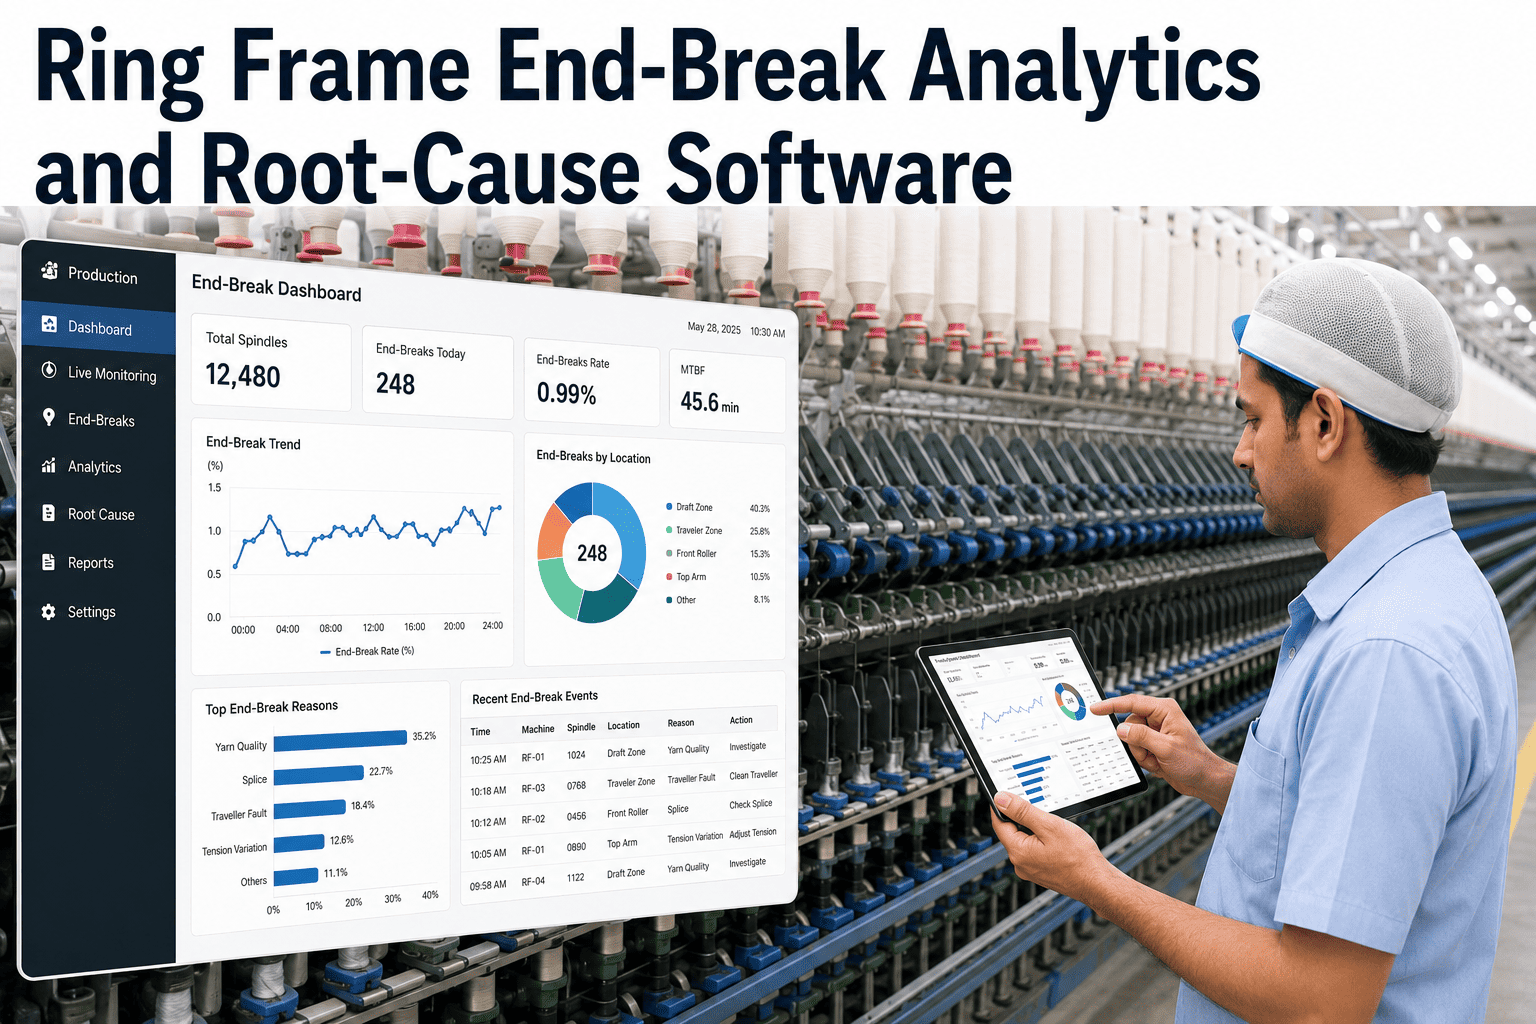
Every end break on a ring frame stops production at that spindle until an operator notices and re-pieces it, and on a frame running thousands of spindles, a break rate that looks small in a shift summary can represent a meaningful share of lost spinning time once it's spread across the full frame. Modern ring frames are expected to run below ten breaks per thousand spindle hours, but most mills only track total breaks per shift, not which spindles, counts, or operators are actually driving that number. End-break analytics fills that gap by breaking the number down to the spindle level, showing exactly where and why breaks are concentrating. Spinning managers can book a demo to see root-cause breakdowns against their own frame data.
SPINNING ANALYTICS · RING FRAME END BREAKS
Find Out Which Spindles Are Actually Driving Your Break Rate
End-break analytics breaks total breaks down by spindle, count, shift, operator, and machine condition, turning a single shift number into a root cause you can actually act on.
Spindle-Level Break Concentration, One Frame, One Shift
Normal
Elevated
High
Investigate
Why a Shift-Level Break Number Hides the Real Problem
A frame averaging nine breaks per thousand spindle hours looks fine against the modern benchmark, but that average can mask two or three specific spindles running well above the rest of the frame, each pointing to a mechanical issue like ring wear or traveler wear that won't show up until it's checked individually. Spindle-level visibility turns a single reassuring average into an actionable maintenance list.
The same masking happens across shifts and counts. A break rate that looks stable month over month can still hide a specific count that's consistently harder to run, or a specific shift where start-up breaks after doffing are running well above the recommended threshold. Without breaking the number down, none of that becomes visible.
SEE YOUR OWN FRAME BROKEN DOWN
Find the Spindles Driving Your Break Rate
A working session using your own frame, count, and shift data.
Root Causes the Analytics Helps Separate
| Pattern Observed | Likely Root Cause |
|---|---|
| Isolated high-break spindles | Ring or traveler wear specific to that position |
| Breaks spike after doffing | Start-up tension or traveler run-in issue |
| Breaks rise with finer counts | Roller setting or draft not matched to count |
| Breaks vary sharply by shift | Humidity, temperature, or operator response time drift |
<10
Breaks per 1,000 spindle hours generally expected on well-maintained modern ring frames
67-80%
Typical spindle utilization range in mills, against a recommended standard closer to 98%
<3%
Recommended ceiling for start-up breaks immediately following a doff
What a Spinning Mill Manager Told Us
Our shift average looked fine for months while two specific spindles on one frame were quietly running at three times the rate of the rest. We only found that once we could see the breakdown by position instead of just the shift total, and the fix was a five-minute ring replacement.
Spinning Mill Manager, Cotton Yarn Producer
Humidity and Seasonal Effects Are Easy to Misread
Break rates commonly rise during humidity swings, particularly when relative humidity drops below the standard range typically maintained in a spinning department, since low humidity increases static and fiber brittleness. Without visibility into environmental conditions alongside break data, a seasonal humidity spike can look identical to a genuine mechanical or setting problem, leading maintenance teams to chase a fix that was never needed.
Tracking break rate trends against logged humidity and temperature readings helps separate a true mechanical issue from an environmental one, so maintenance effort gets directed at the frames and spindles that actually need attention rather than every frame during a seasonally difficult week.
From Flagged Spindle to Closed Maintenance Ticket
Identifying a high-break spindle is only useful if it turns into an actual fix, and that's where a lot of manual tracking efforts quietly fail, since a spindle noted on a shift report often doesn't make it onto a maintenance technician's list until it's flagged again days later. Connecting the analytics directly to a maintenance ticket closes that gap, and tracking whether the break rate actually improved after the fix confirms whether the repair addressed the real cause or just masked it temporarily.
Break Rate Benchmarks Worth Knowing
| Condition | Typical Break Rate Benchmark |
|---|---|
| Well-maintained modern frame | Below 10 breaks per 1,000 spindle hours |
| Start-up breaks after doffing | Below 3% is the generally recommended ceiling |
| Recommended spindle utilization | Standard operating norm of around 98% |
| Common actual utilization range | Often observed between 67% and 80% in practice |
Frequently Asked Questions
How does the system know where a break happened on the frame?
Break events are captured at the spindle level through existing frame sensors or piecing logs, then aggregated into position, shift, and count views automatically. This is what allows the system to separate a frame-wide trend from an issue isolated to a handful of positions, which a manual shift log simply can't do at that resolution. Teams can book a demo to see spindle-level tracking in action.
Can this integrate with our existing maintenance scheduling?
Yes, spindles flagged as consistently high-break can be routed into a maintenance work order automatically, closing the loop between analytics and the actual mechanical fix rather than leaving the finding as a report nobody acts on. Integration specifics for your maintenance system can be reviewed through support.
Does break rate benchmark differ by count or fiber type?
Yes, finer counts and certain fiber blends naturally run somewhat higher break rates than coarser counts on well-maintained equipment, so the analytics benchmarks each count and product against its own historical baseline rather than a single blanket target across your full product mix. This avoids flagging normal count-driven variation as a false problem.
How quickly can a root cause pattern actually be identified?
Isolated spindle issues, like a single worn ring, often show up within a single shift of data once spindle-level tracking is running, since the deviation from surrounding positions tends to be immediate and clear. Broader patterns tied to humidity, count, or shift-level factors typically take one to two weeks of data to confirm with confidence.
Will this work on older ring frames without modern sensors?
Older frames without built-in break sensors can often still be covered through supplementary monitoring hardware, though the specific approach depends on your frame's age and configuration. A floor assessment during setup determines the best way to capture spindle-level data on your specific equipment mix.
STOP TRACKING JUST THE SHIFT AVERAGE
See Which Spindles Need Attention First
Get a root-cause breakdown built from your own ring frame data.