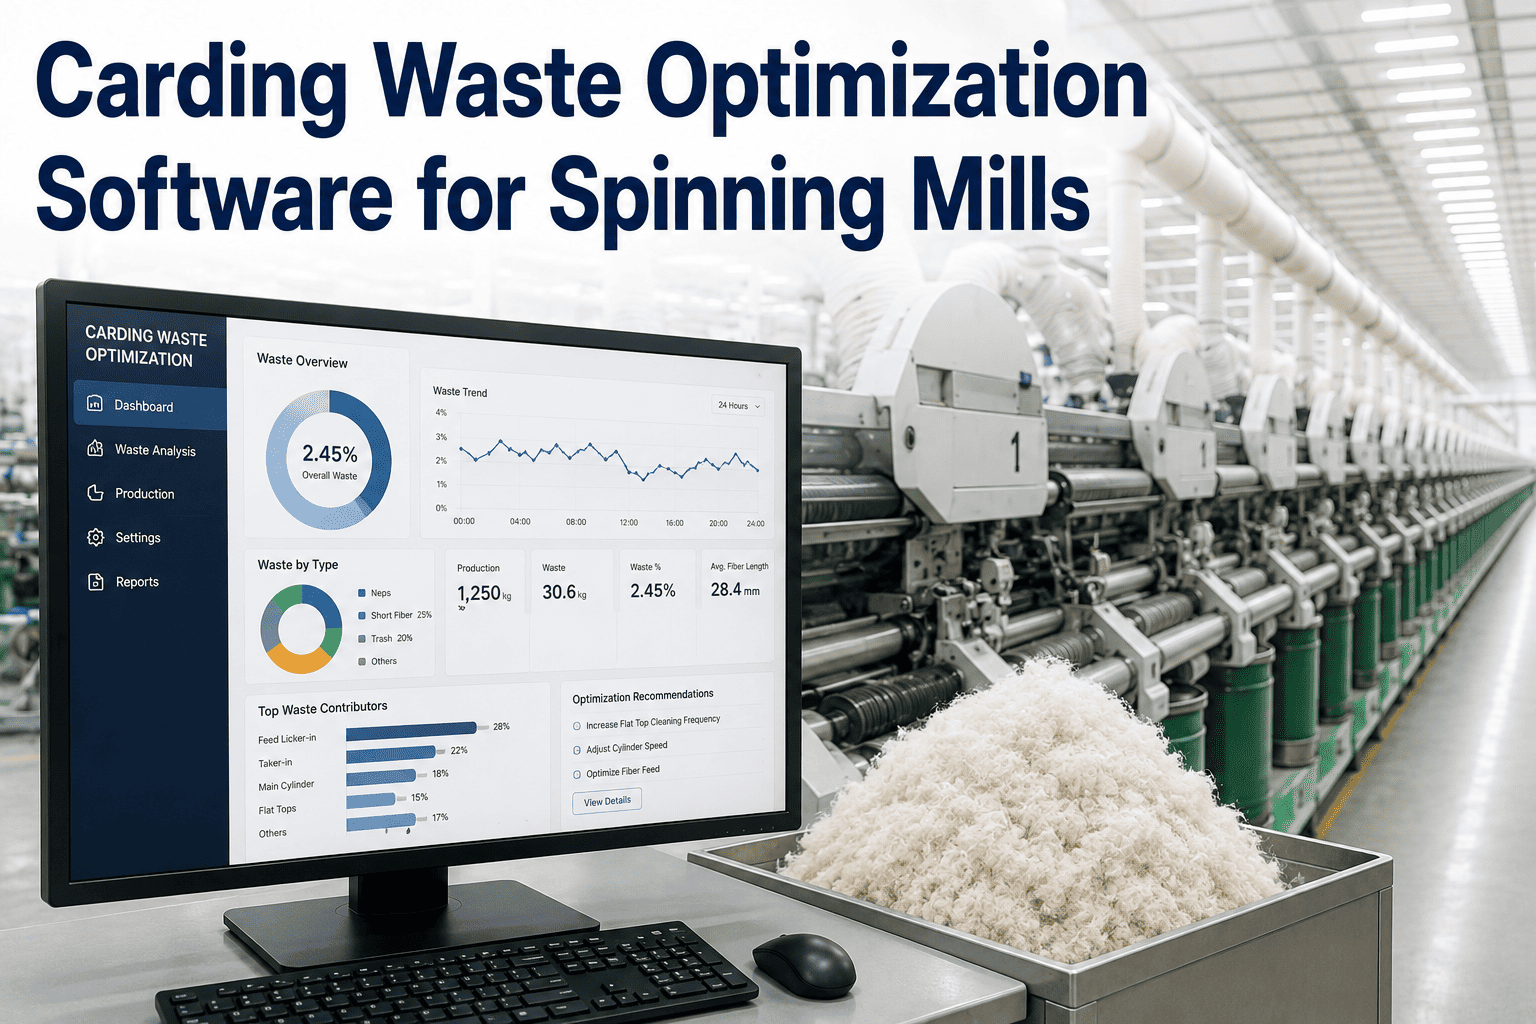
Cutting carding waste sounds like a straightforward cost win until the sliver quality drops and downstream breaks start rising, at which point the mill has traded one cost for another that's often worse. Waste settings on a carding machine exist in tension with fiber quality, and adjusting them without visibility into the quality side is a common way mills end up chasing a waste percentage improvement that quietly costs more in yarn quality than it saves in raw material. Carding waste optimization software tracks both sides of that tradeoff together, so waste reductions get made with sliver quality data in view, not despite it. Spinning mill managers can book a demo to see the tradeoff modeled against their own carding data.
SPINNING ANALYTICS · CARDING WASTE
Cut Carding Waste Without Trading Away Sliver Quality
Waste percentage and sliver quality get tracked together, machine by machine and lot by lot, so waste reduction decisions are made with the quality tradeoff visible, not guessed at.
Waste Reduction
Lower waste percentage, more usable fiber retained
vs
Sliver Quality
Fewer neps and cleaner fiber alignment retained
Why Waste Percentage Alone Is the Wrong Target
A carding machine adjusted purely to minimize waste will typically retain more short fiber and neps in the sliver, which shows up later as more end breaks at the ring frame and inconsistent yarn quality that's much more expensive to trace back to its carding-stage origin than it would have been to prevent. The right target isn't the lowest waste number possible, it's the waste level that still protects the sliver quality your downstream process needs.
This is exactly why waste and quality need to be viewed together rather than as two separate reports reviewed by two different teams. A production manager optimizing for waste cost and a quality manager optimizing for sliver consistency are often making opposing adjustments to the same machine settings without realizing it.
MODEL YOUR OWN TRADEOFF
See Waste and Quality Data Together for Your Cards
A working session using your own carding settings and lot history.
Comparing Settings Across Lots, Not Just Machines
| Comparison | What It Reveals |
|---|---|
| Same Machine, Different Lots | Whether waste variation is coming from raw material, not the machine |
| Same Lot, Different Machines | Whether one card is running settings out of line with the rest |
| Before & After Maintenance | Whether wire condition is driving waste and quality drift over time |
Lot-Level
Waste and quality comparisons run at the lot level, isolating raw material effects
Machine-Level
Every card is benchmarked against the rest of the fleet running the same material
Tracked Together
Waste percentage and downstream sliver quality never get reviewed in isolation
What a Spinning Mill Production Manager Told Us
We cut waste by pushing settings on one card and celebrated the raw material savings for about a month, until end breaks on that count started climbing at the ring frame. Now we can't make a waste change without seeing what it's projected to do to sliver quality first, which has completely changed how we approach these decisions.
Production Manager, Cotton Spinning Mill
Setting Waste Targets by Product Line, Not Mill-Wide
A single mill-wide waste target almost always means some product lines are being run more conservatively than necessary while others are pushed harder than their quality tolerance really allows. Setting a target per product line, informed by that line's actual buyer specification and historical quality results, is what turns waste optimization from a blunt cost-cutting exercise into something that protects margin without protecting it at quality's expense.
This also creates a more defensible basis for waste targets during internal cost reviews, since each target can be traced back to a specific quality requirement rather than an arbitrary company-wide percentage that nobody can fully justify when a product's needs change.
Connecting Carding Data to Ring Frame Outcomes
The real test of a carding waste setting isn't what happens at the card, it's what happens several stages later at the ring frame, where poor sliver quality shows up as elevated end breaks. Linking carding waste and quality data to downstream ring frame break rates for the same lot closes that loop, making it possible to see directly whether a waste reduction on a specific lot correlated with a break rate increase downstream, rather than treating the two processes as unconnected.
Typical Waste Percentages Worth Benchmarking Against
| Process Stage | Typical Waste Range |
|---|---|
| Blowroom & Carding Combined | Roughly 8% of raw cotton input is generated as waste here |
| Combing (When Applicable) | Typically 15% to 20% depending on count and quality target |
| Optimum Comber Waste Approach | Set near half the short fiber content, then fine-tuned by trial |
Frequently Asked Questions
How does the system measure sliver quality alongside waste?
Sliver quality data, including nep count and evenness, is pulled from existing lab or inline testing and connected to the same lot and machine record as the waste percentage for that run. This lets the system show both numbers side by side for every setting change instead of requiring someone to manually cross-reference two separate reports. Teams can book a demo to see this comparison built from real lot data.
Can this recommend specific setting changes, or just show data?
The system surfaces the tradeoff clearly enough for your process engineers to make an informed setting decision, and over time it can highlight setting ranges that have historically produced the best balance for a specific fiber type, but the final setting decision stays with your team rather than being fully automated.
Does raw material variation get separated from machine performance?
Yes, comparing the same card across different raw material lots versus different cards running the same lot is exactly how the system isolates whether a waste or quality issue is coming from the fiber itself or from a specific machine's condition. This separation is one of the most common sources of confusion in manual waste tracking. Specific data setup questions can go through support.
How does wire condition factor into the analysis?
Wire wear degrades both waste and quality gradually over time, so the system tracks trends before and after maintenance events to show how much of a machine's current performance is attributable to wire condition versus a setting choice. This helps distinguish a maintenance need from a settings adjustment, which are easy to conflate without this kind of trend view.
How long before we see a measurable improvement in the waste-quality balance?
Most mills see clear enough data within two to three weeks to start making informed setting adjustments, since carding runs enough volume in that window to produce a statistically meaningful comparison across lots and machines. Sustained improvement typically builds over one to two production cycles as adjustments get validated against real downstream results.
BALANCE WASTE AND QUALITY TOGETHER
Make Waste Decisions With the Full Picture
See how your own cards balance waste against sliver quality.