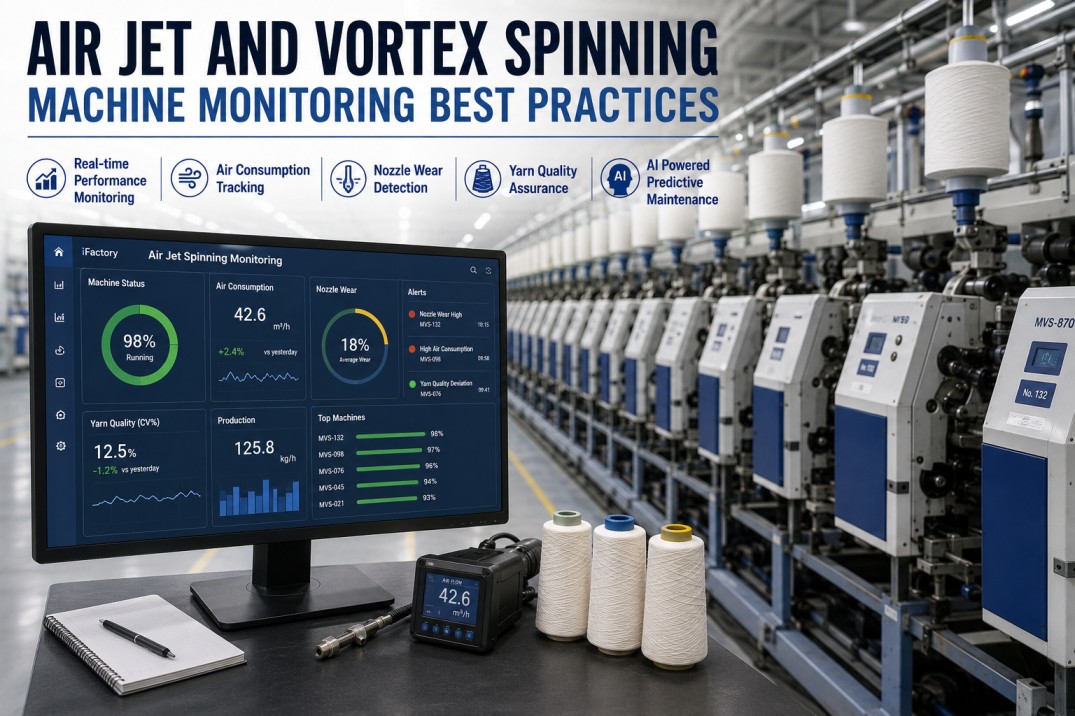
By 2026, air-jet and vortex spinning machines will account for over 30% of global staple yarn production, driven by delivery speeds exceeding 550 m/min and the elimination of roving and winding stages. But with that productivity comes complexity. iFactory Air-Jet Spinning Monitoring delivers real-time visibility into nozzle pressure, compressed air consumption, yarn quality parameters, and spindle-level performance across Murata MVS, Rieter J series, and Saurer Autoairo installations — helping U.S. textile mills reduce conversion costs, extend nozzle life, and maintain consistent Com4 and vortex yarn quality across every position. Book a demo to see the platform live on your data.
Monitor Every Spindle, Every Nozzle, Every Air Jet — in Real Time
A practical guide to air-jet and vortex spinning machine monitoring for U.S. textile mills — covering nozzle wear detection, compressed air optimization, yarn quality tracking, predictive maintenance, and the IIoT architecture that connects Murata MVS, Rieter J 70, and Saurer Autoairo data to a single operational pane.
How Air-Jet and Vortex Spinning Machines Work
Air-jet spinning uses compressed air jets to twist fibers into yarn without the mechanical rotation of ring spinning. Vortex spinning — pioneered by Murata's MVS platform — uses a controlled air vortex inside a stationary spindle to wrap surface fibers around a parallel core. Both technologies eliminate roving and winding processes, reducing floor space by 30% and labor by 40% compared to ring spinning, but they introduce new monitoring requirements centered on nozzle condition, air pressure stability, and fiber-airflow dynamics.
Drafting & Fiber Preparation
Sliver is drafted through a 4-over-4 roller system to attenuate fibers to the target linear density. Draft ratios typically range from 20:1 to 60:1 depending on yarn count.
Air Jet Twist Insertion
Compressed air at 4.0-5.5 bar enters the nozzle block. In dual-nozzle systems, opposing vortex directions create the false-twist effect. In MVS, a single vortex wraps surface fibers around the core at up to 200,000 rpm.
Yarn Formation & Take-Up
The formed yarn passes through a yarn clearer (Q 30A / MSC), waxing device, and is wound onto a package at 450-550 m/min. Real-time sensors monitor mass variation, hairiness, and foreign fibers at every position.
Air-Jet vs. Vortex vs. Ring Spinning at a Glance
Each spinning technology serves a distinct production niche. The table below compares the three systems across the metrics that matter most to U.S. mill operators — speed, quality, energy, floor space, and monitoring complexity.
| Parameter | Ring Spinning | Air-Jet (Rieter J 70) | Vortex (Murata MVS) |
|---|---|---|---|
| Delivery Speed | 20-25 m/min | Up to 600 m/min | Up to 550 m/min |
| Yarn Count Range | Ne 3 - Ne 120 | Ne 10 - Ne 60 | Ne 10 - Ne 80 |
| Energy Consumption | High (3.5-4.5 kWh/kg) | Low (1.8-2.4 kWh/kg) | Low (1.6-2.2 kWh/kg) |
| Floor Space per 1000 sp. | 2,000 sq ft (est.) | 1,200 sq ft | 1,100 sq ft |
| Yarn Hairiness | Moderate | Very Low | Very Low |
| Pilling Resistance | Moderate | Excellent | Excellent |
| Fiber Yield | 93-95% | 97-98% | 96-98% |
| Critical Monitoring | Spindle bearing, traveler wear | Nozzle pressure, air quality | Vortex stability, nozzle wear |
| Automation Level | Semi-automated | Fully automated (robots) | Fully automated (robots) |
Six Parameters That Define Air-Jet Yarn Quality
Air-jet and vortex spinning machines are sensitive to a narrow set of process variables. When any of these six parameters drifts outside its tolerance band, yarn quality degrades immediately — and the mill doesn't discover it until the package reaches the laboratory. Real-time monitoring closes that detection gap from hours to seconds.
Nozzle Air Pressure
The single most critical parameter. A 0.3 bar drop reduces yarn strength by 8-12%. Typical range: 4.0-5.5 bar depending on fiber type and yarn count.
Delivery Speed
Higher speed increases productivity but reduces fiber control. The optimal operating point balances throughput against CV% and hairiness targets.
Compressed Air Quality
Oil, moisture, and particulate contamination in the air supply accelerate nozzle fouling. ISO 8573-1 Class 2 or better is required for consistent spinning.
Fiber Draft Ratio
Draft ratio determines fiber straightness and uniformity. Over-drafting creates thin places; under-drafting increases mass CV%. Monitoring draft stability at each position is essential.
Nozzle Wear Index
Nozzle orifices erode over time from fiber contact and air entrained particles. A worn nozzle increases air consumption and degrades the core-sheath fiber structure.
Yarn Clearer Performance
Yarn clearers (Uster Quantum, Rieter Q 30A, Murata MSC) detect thick/thin places, foreign fibers, and count deviations. Calibration drift is a common source of undetected quality issues.
Turn Air-Jet Spindle Data Into a Competitive Advantage
U.S. textile mills using iFactory's air-jet monitoring module report a 23% reduction in nozzle-related downtime, 14% improvement in first-quality yield, and 11% reduction in compressed air costs within the first 90 days. Connect your Murata MVS, Rieter J 70, or Saurer Autoairo machines and start seeing every spindle in a single dashboard.
Common Nozzle and Air System Failures
The most expensive downtime events in air-jet spinning are preceded by detectable precursor signals. The table below maps common failure modes to their observable symptoms, detection methods, and recommended response windows.
| Failure Mode | Symptoms | Detection Method | Response Window |
|---|---|---|---|
| Nozzle Orifice Erosion | +8-15% air consumption, hairiness increase, strength drop | Trend air pressure vs. flow per nozzle | 2-4 weeks before quality breach |
| Air Filter Fouling | Pressure drop across filter, inconsistent yarn quality across machine | Differential pressure sensor | Immediate (shutdown risk) |
| Compressor Moisture Breakthrough | Corrosion deposits on nozzle, erratic twist, increased neps | Dew point monitoring at machine inlet | Hours to shift change |
| Yarn Clearer Drift | Undetected thick places, false cuts increasing, quality complaints | Cross-check with lab Uster data | 1-2 shifts |
| Draft Roller Wear | Mass CV% increase, periodic defects, roller lapping | Spectrogram analysis, vibration monitoring | 1-3 days |
| Vortex Instability (MVS) | Bursts of high hairiness, broken filaments, increased ends down | Real-time ends-down mapping per position | Minutes to hours |
Deploying Air-Jet Monitoring in Your Mill
A phased approach minimizes production disruption while building toward full spindle-level visibility. Most U.S. mills move from baseline to full deployment in 12-16 weeks.
Baseline Audit
Install air flow meters at machine inlets. Map compressed air distribution, measure baseline nozzle pressure, and establish energy consumption baselines per machine.
Sensor Deployment
Install pressure transducers, flow sensors, and dew point monitors at each machine. Connect yarn clearer data streams (Uster, Rieter Q 30A, Murata MSC) to the edge gateway.
Dashboard & Alerts
Configure iFactory dashboards per machine type. Set nozzle wear trend alerts, air quality thresholds, and quality deviation rules. Train shift supervisors on the interface.
Optimization
Analyze first 30 days of data. Identify underperforming positions, set nozzle replacement schedules, optimize air pressure setpoints. Begin predictive maintenance routines.
What U.S. Mills Are Achieving With Monitoring
Data from iFactory deployments across North Carolina, Georgia, and South Carolina textile plants shows consistent returns across three categories. Your mill's results will vary based on baseline conditions and machine configuration.
Compressed Air Cost
Identifies leaking nozzles, over-pressurized positions, and compressor scheduling inefficiencies that drive unnecessary energy consumption.
Nozzle-Related Downtime
Trend-based wear detection replaces reactive nozzle changes. Mills schedule replacements during planned maintenance rather than emergency stops.
First-Quality Yield
Real-time detection of pressure drift, clearer calibration issues, and draft ratio deviations prevents quality escapes to downstream processes.
Frequently Asked Questions
What is the difference between air-jet spinning and vortex spinning?
Air-jet spinning uses one or two directed air jets to insert false twist into the fiber strand, creating yarn through a wrapping mechanism. Vortex spinning (Murata MVS) is a specific sub-type that uses a single stationary vortex inside a spindle to wrap surface fibers around a parallel core — producing a yarn with a structure more similar to ring-spun yarn. Both are air-based technologies, but vortex spinning achieves higher fiber utilization and can spin 100% cotton fibers at speeds exceeding 500 m/min.
How often should air-jet spinning nozzles be replaced?
Nozzle replacement intervals vary significantly by fiber type, air quality, and operating pressure. Processing polyester typically extends nozzle life to 12-18 months, while cotton with uncleaned air may require replacement every 6-9 months. The most cost-effective approach is trend-based replacement: monitor air consumption per nozzle position and replace when flow increases 10-15% above the position's baseline — indicating orifice erosion has reached the economic threshold.
What compressed air quality does air-jet spinning require?
ISO 8573-1 Class 2 quality is recommended for air-jet and vortex spinning — particle size under 1 micron, pressure dew point below -40 C, and oil content under 0.1 mg/m. Without proper filtration, moisture and oil vapor condense inside nozzle blocks, causing fiber sticking, erratic twist insertion, and accelerated nozzle wear. Continuous dew point monitoring at each machine inlet is the most reliable way to verify air quality in real time.
Can iFactory connect to both Murata MVS and Rieter J 70 machines simultaneously?
Yes. iFactory's machine connectivity layer supports Murata MVS (MSC-F yarn clearers, VOS-III control), Rieter J 26 / J 70 (ESSENTIALmonitor, Q 30A yarn clearers), and Saurer Autoairo (Belairo) data streams through standard OPC-UA, MQTT, and proprietary API connectors. All machine data converges into a single operational dashboard, so a mill running mixed fleets can compare performance, set common alert thresholds, and manage maintenance scheduling across all platforms from one interface.
What is the typical payback period for an air-jet monitoring deployment?
For a typical U.S. mill with 20-40 air-jet spinning machines, the combined savings from compressed air optimization, nozzle lifetime extension, reduced quality escapes, and lower ends-down rate deliver a payback period of 5-9 months. The largest single contributor is typically compressed air — air-jet spinning uses 30-50% more compressed air than necessary when pressure is not optimized per position, and monitoring corrects this within the first 30 days of deployment.
See Every Nozzle, Every Spindle, Every Shift
Stop relying on end-of-shift lab reports to catch air-jet quality issues. iFactory brings live spindle-level data, nozzle wear trends, air consumption analytics, and automated quality reporting into one platform — purpose-built for U.S. textile mills that need to maximize throughput while maintaining the yarn quality their customers expect.