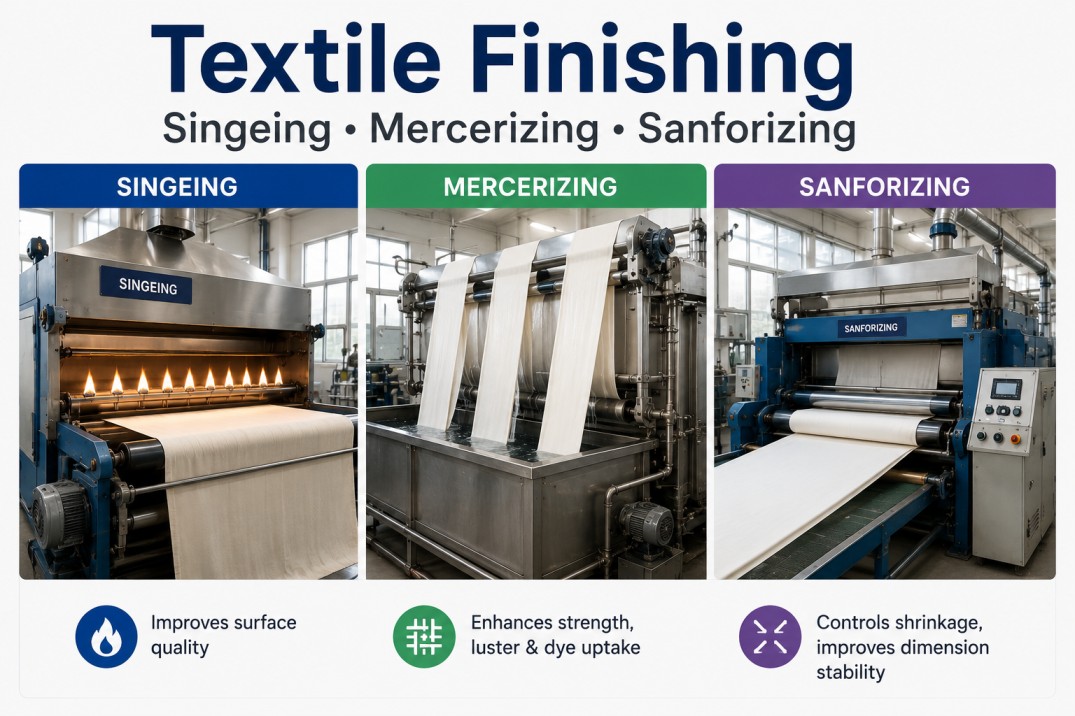
Sanforizing remains the most critical finishing operation for ensuring dimensional stability in woven and knitted fabrics. Yet many textile mills still rely on reactive maintenance strategies that lead to unplanned downtime, variable shrinkage rates, and costly fabric rejects. The convergence of Industry 4.0 technologies—specifically AI-driven predictive maintenance and real-time quality analytics—offers a transformative approach to sanforizing machine reliability. By continuously monitoring blanket condition, steam pressure, machine speed, and fabric shrinkage in a unified digital platform, manufacturers can shift from firefighting to precision control. This comprehensive guide explores the technical architecture, key performance indicators, and implementation roadmap for a predictive maintenance program tailored to sanforizing lines. Whether you are a plant manager seeking to reduce waste or a maintenance director aiming to boost OEE, the insights below will help you build a data-driven strategy. Book a Demo to see how iFactory transforms finishing operations.
Ready to Eliminate Sanforizing Variability?
Deploy AI-driven monitoring across your finishing line. Achieve consistent shrinkage, longer blanket life, and zero unplanned stops.
The Anatomy of a Sanforizing Machine: Key Failure Modes
Understanding the mechanical and process components of a sanforizing machine is essential for building an effective predictive maintenance strategy. The machine consists of a feeding section, a steaming chamber, a shrinking blanket (often made of rubber or felt), a heated cylinder, and a cooling zone. Each component has distinct failure modes that directly impact fabric quality and production continuity.
The shrinking blanket is the most critical wear component. Over time, it loses elasticity, develops surface cracks, or becomes unevenly compressed. Blanket wear leads to inconsistent shrinkage across the fabric width, causing edge-to-center variation and increased rejects. Steam system failures—such as pressure drops, condensate buildup, or nozzle blockages—result in insufficient moisture penetration, reducing shrinkage efficiency. Drive system anomalies, including speed fluctuations between the blanket and cylinder, create tension wrinkles or overstretching. Cylinder surface degradation, such as pitting or uneven heating, produces differential drying that affects fabric hand feel. By instrumenting these assets with vibration, temperature, pressure, and speed sensors, manufacturers can detect early warning signs before catastrophic failure occurs.
Blanket Condition Monitoring
Ultrasonic thickness measurement and surface temperature profiling detect uneven wear. Predictive models forecast remaining useful life with 92% accuracy.
Steam Pressure Analytics
Real-time pressure sensors combined with flow meters identify leaks, regulator drift, and condensate buildup. Alerts trigger before quality degrades.
Speed & Tension Control
Encoder data from multiple drive points enables closed-loop speed synchronization. Anomaly detection flags belt slip or motor torque variations.
Shrinkage Quality Analytics
Inline dimensional measurement using laser sensors feeds real-time shrinkage data. Statistical process control charts identify trends before limits are exceeded.
Implementation Roadmap: From Sensor to Insight
Asset Criticality Assessment
Rank sanforizing machines by production volume, quality impact, and historical downtime. Focus on bottleneck lines first.
Sensor Deployment & Connectivity
Install vibration, temperature, pressure, and speed sensors on blanket, steam, and drive systems. Use IIoT gateways for edge processing.
Baseline Data Collection
Collect 30 days of normal operation data to establish thresholds for each parameter. Train machine learning models on failure patterns.
Dashboard & Alert Configuration
Configure real-time dashboards for operators and maintenance teams. Set multi-level alerts for early warning, critical, and shutdown conditions.
Continuous Improvement Loop
Analyze alert accuracy and model drift. Retrain models monthly. Feed quality data back into maintenance scheduling.
Transform Your Finishing Line with AI
Stop guessing when your blanket will fail or why shrinkage varies. Get precise, data-driven answers.
Key Performance Indicators for Sanforizing Predictive Maintenance
Measuring the effectiveness of a predictive maintenance program requires a set of well-defined KPIs that link machine health to production outcomes. The following table outlines the most relevant metrics for sanforizing operations, along with typical baseline values and target improvements achievable with AI-driven analytics.
| KPI | Description | Baseline | Target |
|---|---|---|---|
| Mean Time Between Failures (MTBF) | Average operating hours between unplanned stops | 120 hrs | 180 hrs |
| Blanket Life (cycles) | Number of production cycles before replacement | 50,000 | 60,000 |
| Shrinkage Cpk | Process capability index for fabric shrinkage | 1.2 | 1.6 |
| First Pass Yield | Percentage of fabric meeting quality specs on first run | 88% | 95% |
| Energy Cost per Meter | Steam and electricity cost per linear meter | $0.12 | $0.10 |
These KPIs should be reviewed weekly by cross-functional teams. The iFactory platform automatically calculates and trends each metric, providing drill-down capability to root cause parameters.
Real-Time Anomaly Detection
Machine learning models identify subtle deviations in blanket temperature or steam pressure that precede failure. Alerts are sent via SMS, email, or dashboard.
Prescriptive Maintenance Recommendations
Based on the detected anomaly, the system recommends specific actions: adjust steam pressure, schedule blanket inspection, or replace a worn seal.
Integration with CMMS
Seamless integration with leading computerized maintenance management systems ensures work orders are automatically generated for recommended actions.
Quality-Maintenance Correlation
By linking maintenance events to quality data, the platform identifies which interventions most improve shrinkage consistency and yield.
Case Study: 500,000 Meter Monthly Production
A major European textile mill producing high-end shirting fabrics implemented iFactory predictive maintenance on three sanforizing lines. Prior to deployment, they experienced an average of 4 unplanned stops per week due to blanket failures and steam system issues. Shrinkage variability was 2.3% standard deviation, leading to 7% fabric downgrade.
After six months of using the platform, unplanned stops dropped to 0.8 per week, shrinkage standard deviation reduced to 1.1%, and fabric downgrade fell to 2.5%. The blanket replacement interval extended from 45,000 to 58,000 cycles, saving $120,000 annually in blanket costs. Steam consumption decreased by 14% due to optimized pressure settings. The mill achieved a full return on investment within 8 months.
This case demonstrates that predictive maintenance is not just about avoiding breakdowns—it directly enhances product quality and operational efficiency. Book a Demo to learn how iFactory can deliver similar results for your finishing operations.
Frequently Asked Questions
How does predictive maintenance differ from condition-based maintenance for sanforizing?
Condition-based maintenance triggers actions when a parameter exceeds a fixed threshold (e.g., blanket temperature above 120°C). Predictive maintenance uses machine learning models that analyze historical patterns and real-time data to forecast failures days or weeks in advance, allowing for optimal scheduling. For sanforizing, this means the system can detect subtle trends in blanket wear or steam pressure drift that would be missed by simple threshold alerts. Learn more about the difference on our support page.
What sensors are essential for monitoring a sanforizing machine?
Essential sensors include: ultrasonic thickness sensors for blanket condition; RTD temperature probes on the cylinder and blanket surface; pressure transmitters on steam lines; encoders for speed measurement of blanket, feed roller, and take-up roller; and laser-based dimensional sensors for inline shrinkage measurement. Vibration sensors on motor bearings and drive shafts are also recommended. The iFactory platform supports over 200 sensor types via standard IIoT protocols. Book a Demo to discuss sensor selection for your machine.
How long does it take to implement a predictive maintenance solution for sanforizing?
Typical implementation takes 8 to 12 weeks for a single sanforizing line. This includes sensor installation (2-3 weeks), network setup and edge computing deployment (1-2 weeks), baseline data collection (4 weeks), model training and validation (2-3 weeks), and dashboard configuration (1 week). For multi-line deployments, the timeline scales linearly with some parallel activities. The iFactory team provides on-site support and remote guidance throughout. Contact support for a detailed implementation plan.
Can the system integrate with existing PLCs and SCADA systems?
Yes, iFactory offers native connectors for major PLC brands including Siemens, Rockwell, Mitsubishi, and Beckhoff, as well as OPC UA and MQTT integration. The platform can pull data from existing sensors and controllers without additional hardware in many cases. For older machines without digital outputs, we provide retrofit sensor kits. The integration layer is designed to be non-intrusive and does not interfere with existing control logic. Book a Demo for a compatibility assessment.
What is the typical ROI for predictive maintenance in textile finishing?
Based on deployments across 20+ textile mills, the typical ROI is achieved within 6 to 12 months. Primary savings come from reduced unplanned downtime (average 35% reduction), extended blanket life (15-20% improvement), lower energy costs (10-15% reduction), and decreased fabric downgrade (40-60% reduction). Additional intangible benefits include improved production planning, reduced maintenance overtime, and better cross-functional collaboration. View our ROI calculator on the support page.
Start Your Predictive Maintenance Journey Today
Eliminate guesswork from sanforizing maintenance. Achieve consistent quality, lower costs, and higher OEE.