Steam is the single largest utility cost in most textile wet processing plants, and it is also the utility that leaks, wastes, and misallocates the most without anyone noticing until the fuel bill arrives at month end. A failed steam trap can silently vent live steam for weeks, an insulation gap on a distribution line can bleed heat around the clock, and a dye house pulling more steam than scheduled can starve a finishing line without either team knowing why their process slowed down. iFactory's steam network monitoring platform gives boiler operators and dye house planners one shared, real-time view of steam generation, distribution, and demand across the entire plant, so losses get caught in hours instead of being discovered in the monthly fuel reconciliation. Book a Demo to see your own steam network mapped and monitored live.
STEAM NETWORK · BOILER TEAMS · DYE HOUSE · ENERGY MONITORING
Your Boiler Team and Your Dye House Team Are Both Guessing About the Same Steam Network — From Two Different Rooms
iFactory's AI dashboard unifies boiler output, distribution losses, and dye house demand into one live view so both teams can see exactly where every kilogram of steam is going and where it is being wasted.
THE HIDDEN COST
Where Steam Actually Disappears Between the Boiler House and the Process Floor
Steam distribution losses are rarely visible on any single gauge, which is exactly why they persist for months or years at most plants. The figures below reflect typical loss ranges found during steam network audits at textile mills before continuous monitoring was introduced.
15-25%
Typical steam energy lost to failed traps, leaks, and poor insulation across an unmonitored distribution network
1 in 5
Approximate share of steam traps found failed or leaking during a typical annual manual trap survey
30-60 Days
Average time a failed trap or leak goes undetected between manual inspection rounds
6-10%
Fuel cost reduction commonly achieved through continuous steam network monitoring and faster leak response
MONITORING CHECKLIST
Seven Points in the Steam Network iFactory Watches Continuously
A complete steam monitoring program has to cover generation, distribution, and end use together, because a problem at any one point changes the picture at the other two. The checklist below reflects the full scope of what iFactory's platform tracks across a typical textile plant.
1
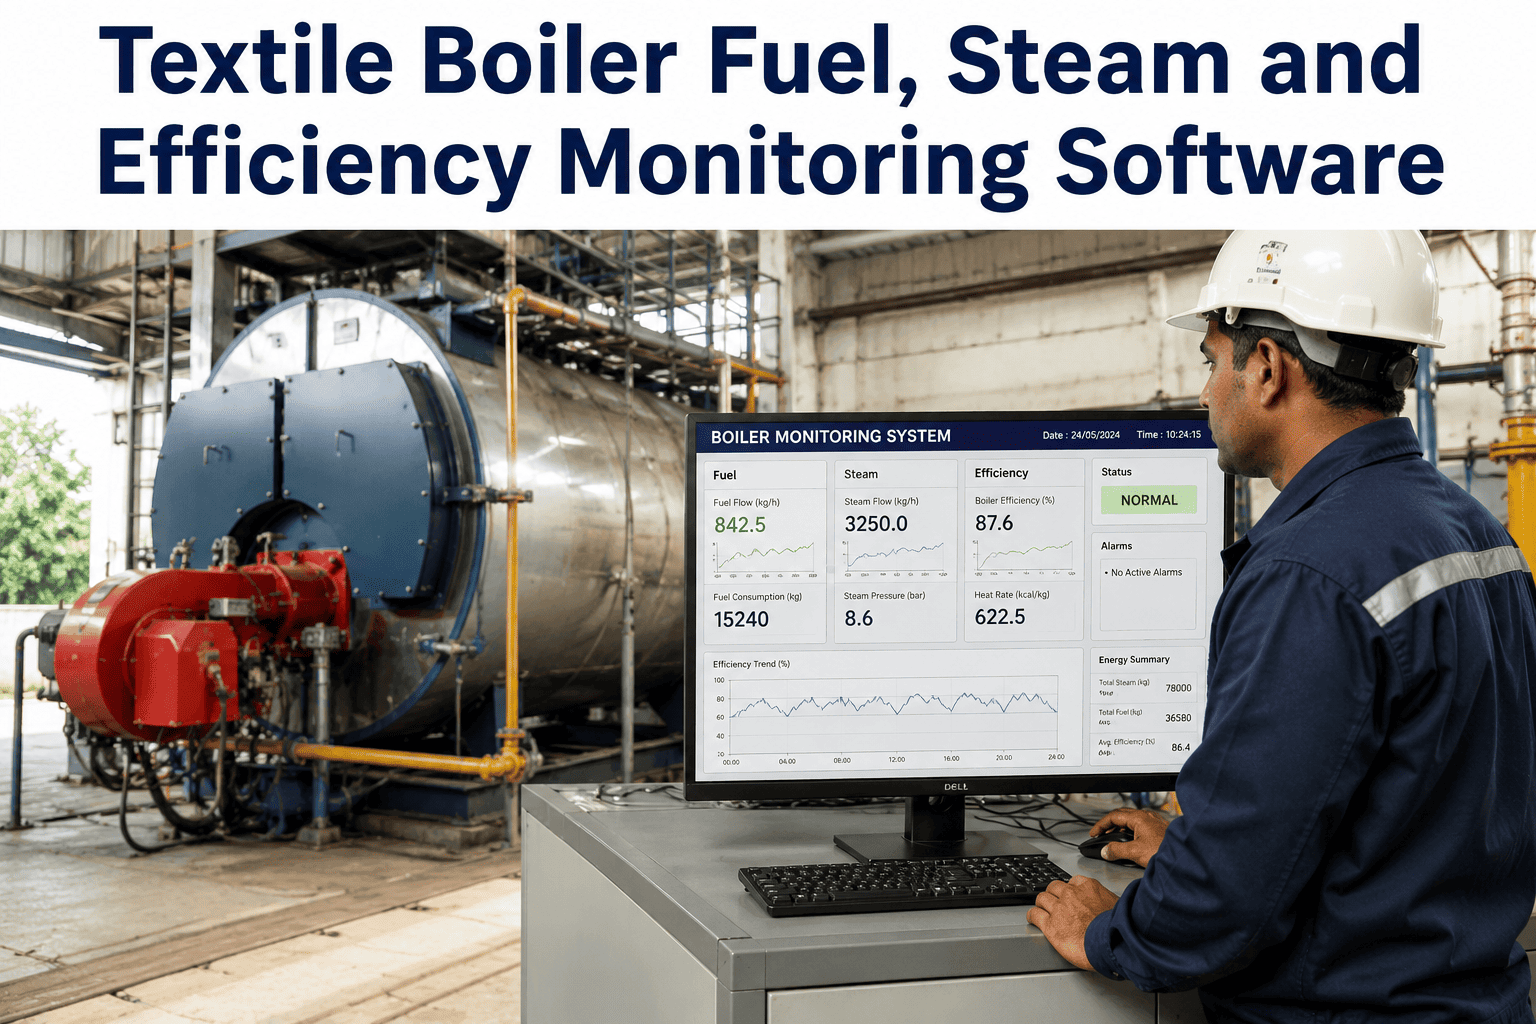
Boiler output and combustion efficiency — fuel-to-steam conversion tracked against design efficiency in real time
2
Steam header pressure stability — pressure drops across the distribution header flagged before they affect downstream processes
3
Steam trap performance — acoustic and temperature signatures used to detect failed-open, failed-closed, and leaking traps automatically
4
Insulation and heat loss along distribution lines — surface temperature trending used to flag degraded or missing insulation sections
5
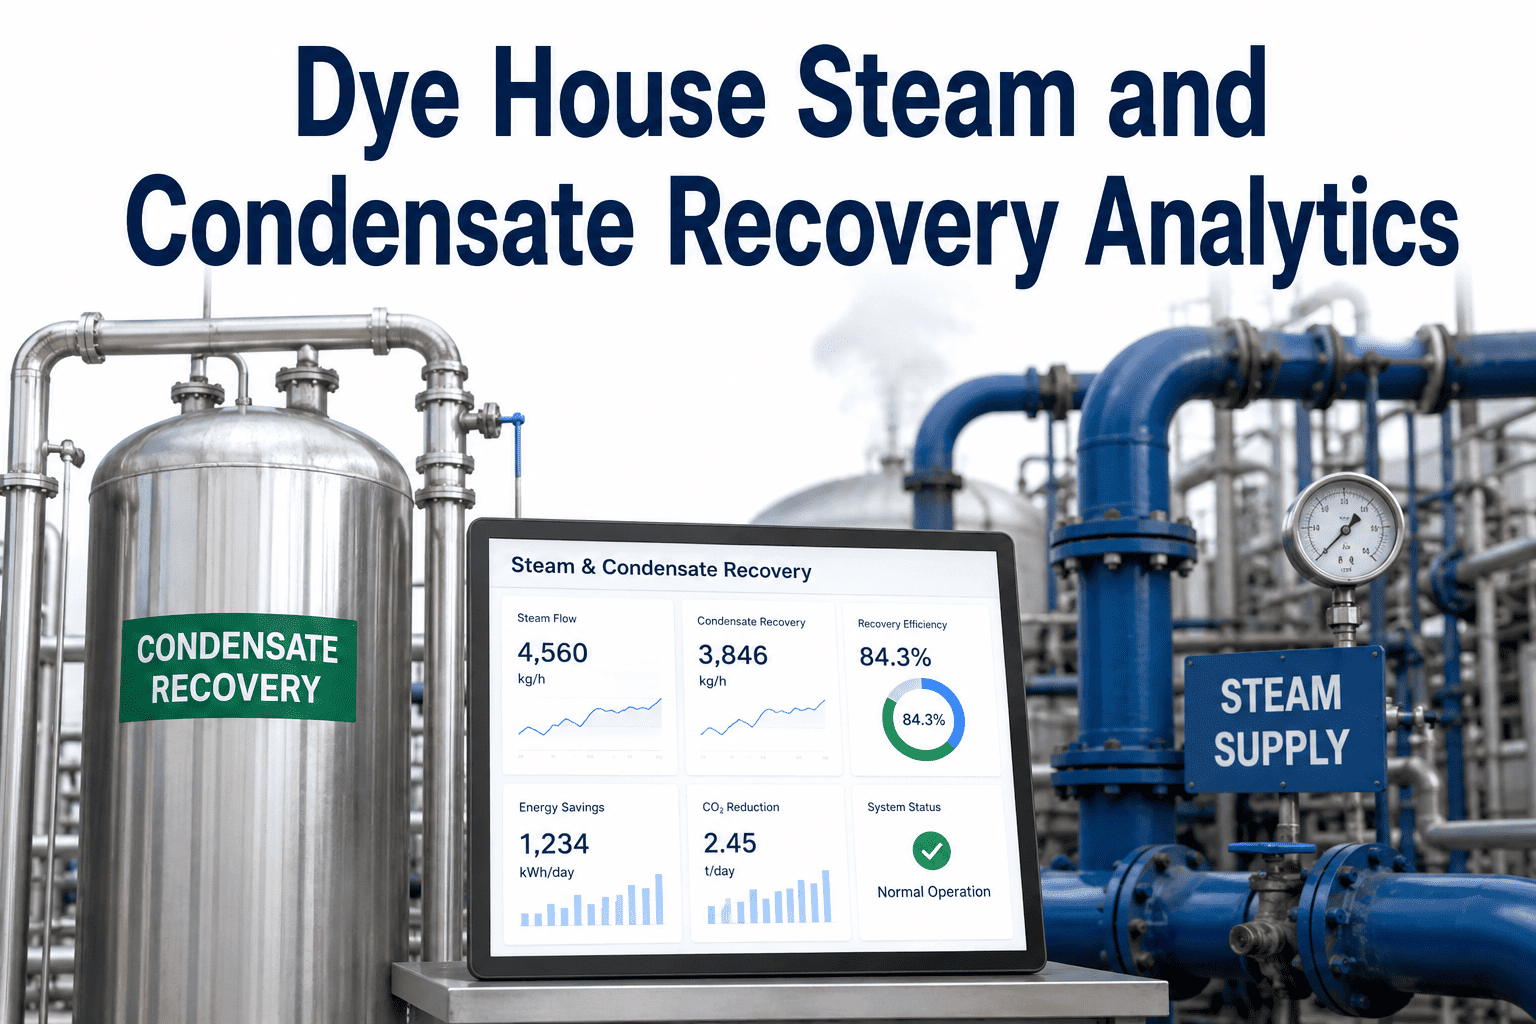
Condensate return rate — volume and temperature of returned condensate tracked to catch losses that increase fresh makeup water and fuel demand
6
Dye house and finishing demand allocation — steam consumption attributed to each department and machine for accurate cost allocation
7
Blowdown frequency and water treatment load — blowdown events tracked against water quality readings to avoid excess energy loss
A Steam Trap Can Fail Open on a Tuesday and Keep Venting Live Steam Until the Next Scheduled Survey
iFactory's continuous monitoring flags trap failures, pressure drops, and heat loss within hours, not at the next quarterly audit. See it running on your own steam network.
LOSS BREAKDOWN
What Typically Accounts for Steam Losses Across a Textile Plant
Understanding where losses concentrate helps plant teams prioritize which part of the network to fix first. The breakdown below is based on iFactory's steam audit data across dye house and finishing operations.
Failed and leaking steam traps36%
Missing or degraded pipe insulation24%
Flange, valve, and fitting leaks16%
Low condensate return rate14%
Excess blowdown and venting10%
SHARED DASHBOARD
What Boiler and Dye House Teams See When They Look at the Same Screen
The table below shows how the same steam network data is surfaced differently for the two teams who depend on it most, resolving the finger-pointing that happens when a process slows down and nobody can agree on why.
| Data Point | Boiler Team View | Dye House Team View |
|---|
| Header Pressure | Live trend vs setpoint | Impact on machine cycle time |
| Steam Demand | Aggregate load forecast | Department-level allocation |
| Trap Health | Failure alerts by zone | Machines affected by loss |
| Fuel Efficiency | Combustion ratio trend | Cost per batch estimate |
FREQUENTLY ASKED QUESTIONS
Questions Plant Teams Ask About Steam Network Monitoring
Do we need to install acoustic or temperature sensors on every single steam trap in the plant?
Full coverage delivers the fastest payback, but iFactory typically recommends starting with the traps on the highest steam consuming lines and the traps in locations that are hardest to reach for manual inspection, since these represent the highest risk and the highest inspection cost today. The monitoring network can then be expanded zone by zone as the initial deployment demonstrates savings, rather than requiring a full plant-wide installation before any value is realized.
Contact our support team for a prioritized trap monitoring plan for your plant layout.
How does the system tell the difference between normal steam demand variation and an actual leak or trap failure?
iFactory's models establish an expected steam demand baseline for each zone based on production schedule, machine count, and time of day, then compare live consumption against that baseline rather than against a fixed threshold. A leak or failed trap typically produces a sustained, unexplained increase in steam draw that does not correlate with any scheduled production activity, which is a distinct pattern from the normal rise and fall of demand tied to batch starts and stops. This baseline approach significantly reduces false alerts compared to simple fixed-threshold monitoring.
Book a Demo to see the anomaly detection running on live steam data.
Can this system help us allocate steam and energy costs accurately to different departments or customer orders?
Yes, cost allocation is one of the most requested capabilities from finance and operations teams who currently rely on rough estimates or equal-split assumptions to attribute steam cost across departments. iFactory tracks steam consumption at the machine and department level, which allows the platform to calculate an accurate steam cost contribution for each production order, department, or shift, supporting more precise costing and identifying which product lines carry the heaviest energy burden.
Contact our support team to review cost allocation reporting options.
What is the typical payback period for a steam network monitoring deployment at a mid-sized textile plant?
Most textile plants recover the cost of a steam monitoring deployment within six to twelve months, driven primarily by faster detection and repair of failed traps and leaks that would otherwise have gone unnoticed for weeks or months between manual surveys. Additional savings from improved condensate return, better blowdown timing, and more accurate department-level cost accountability typically continue to accumulate well beyond the initial payback period as teams act on the ongoing visibility the platform provides.
Book a Demo for a savings estimate specific to your boiler capacity and plant size.
Every Kilogram of Steam You Generate Should Reach a Process, Not a Leak — Find Out Where Yours Is Actually Going
iFactory's steam network monitoring platform gives boiler and dye house teams one shared, real-time view of steam generation, distribution, and demand across your entire plant. Book a demo and see your own network mapped.