In the hyper-competitive textile manufacturing landscape, every percentage point of machine efficiency directly impacts profitability, order fulfillment, and operational agility. Traditional manual data collection methods—clipboards, stopwatches, and spreadsheets—are no longer sufficient to capture the granular, real-time insights needed to drive continuous improvement. Textile OEE software with machine-level loss analysis provides a comprehensive, data-driven framework to measure and optimize availability, performance, and quality across looms, spinning frames, knitting machines, and dyeing equipment. By automatically capturing production losses at the individual machine level, textile manufacturers can pinpoint root causes of downtime, reduce waste, and maximize throughput. This enterprise-grade guide explores how advanced OEE analytics transform textile operations, from fiber to finished fabric. For a personalized assessment of your plant's OEE potential, Book a Demo with our Industry 4.0 experts.
Transform Textile Production with Machine-Level OEE
Unlock hidden capacity, reduce downtime, and improve quality across every department.
Real-Time Machine Monitoring
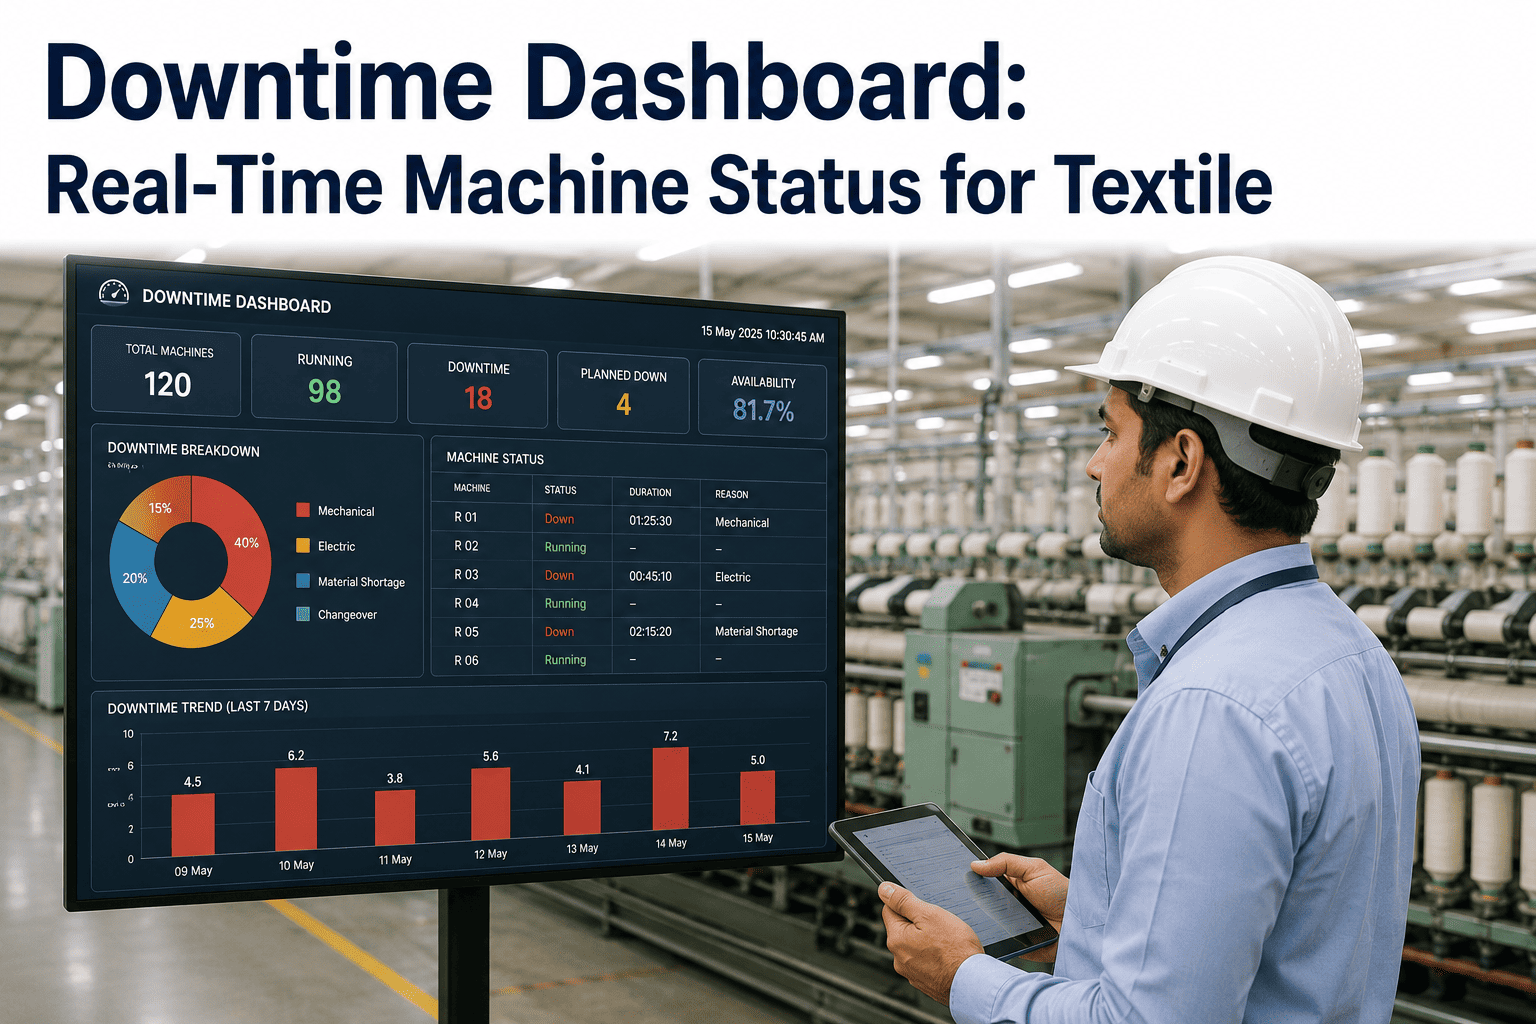
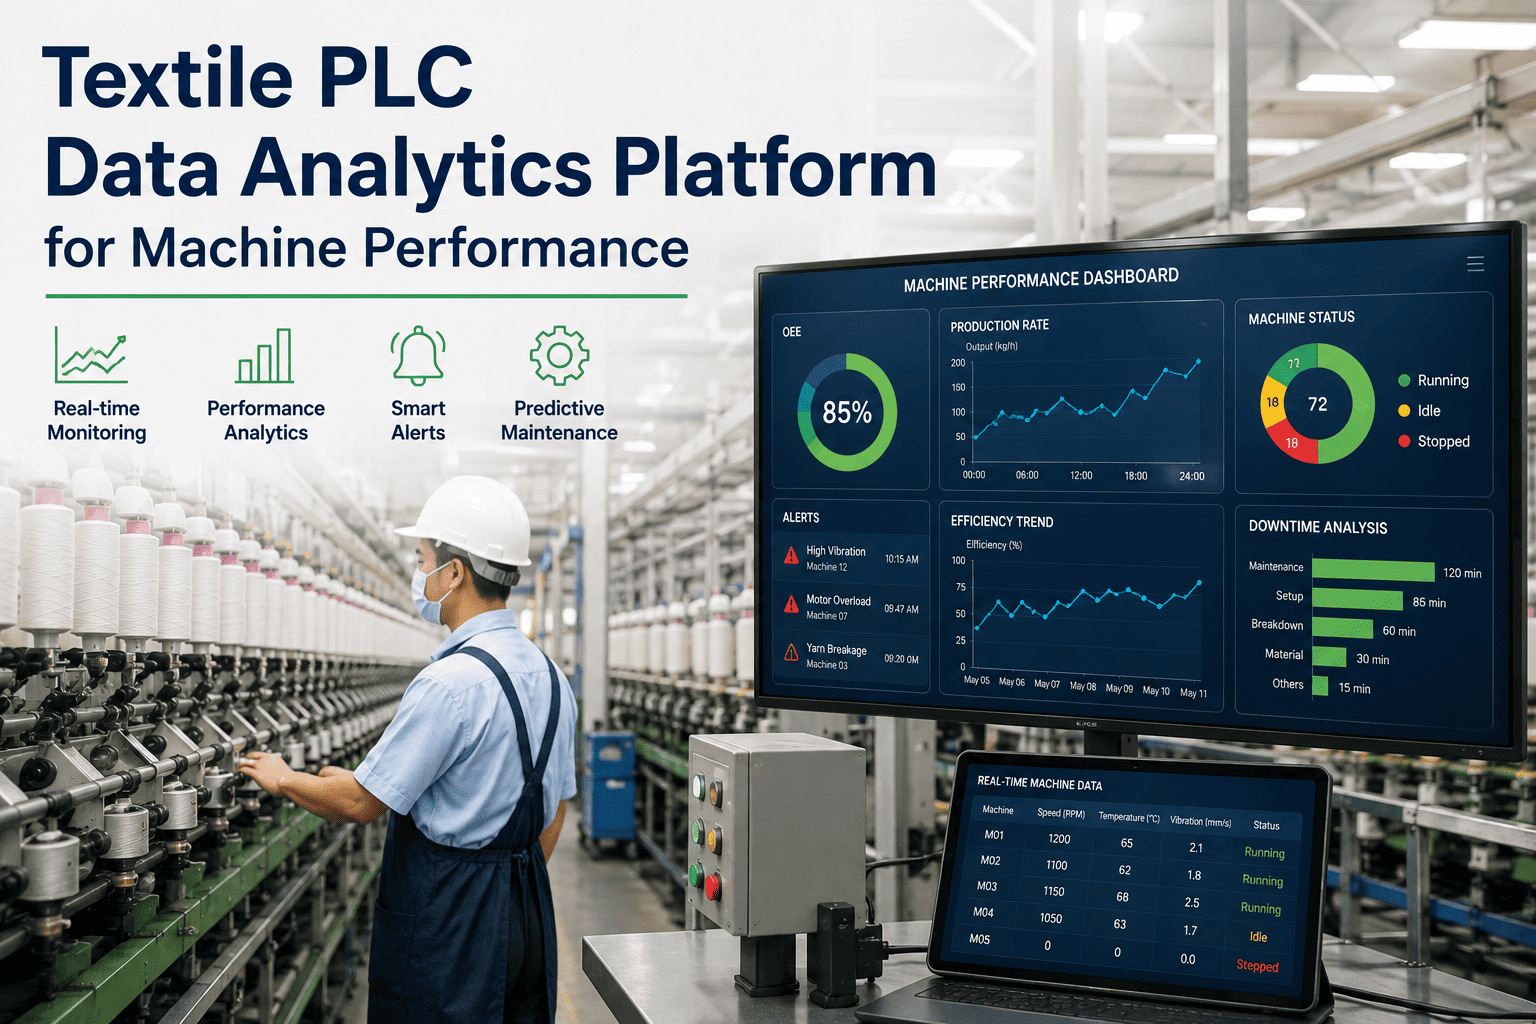
Connect to looms, spinning frames, knitting machines, and dyeing units via IoT sensors or PLCs. View live status, speed, and production counts on a unified dashboard. Instantly identify machines running below target or in idle state.
Loss Categorization Engine
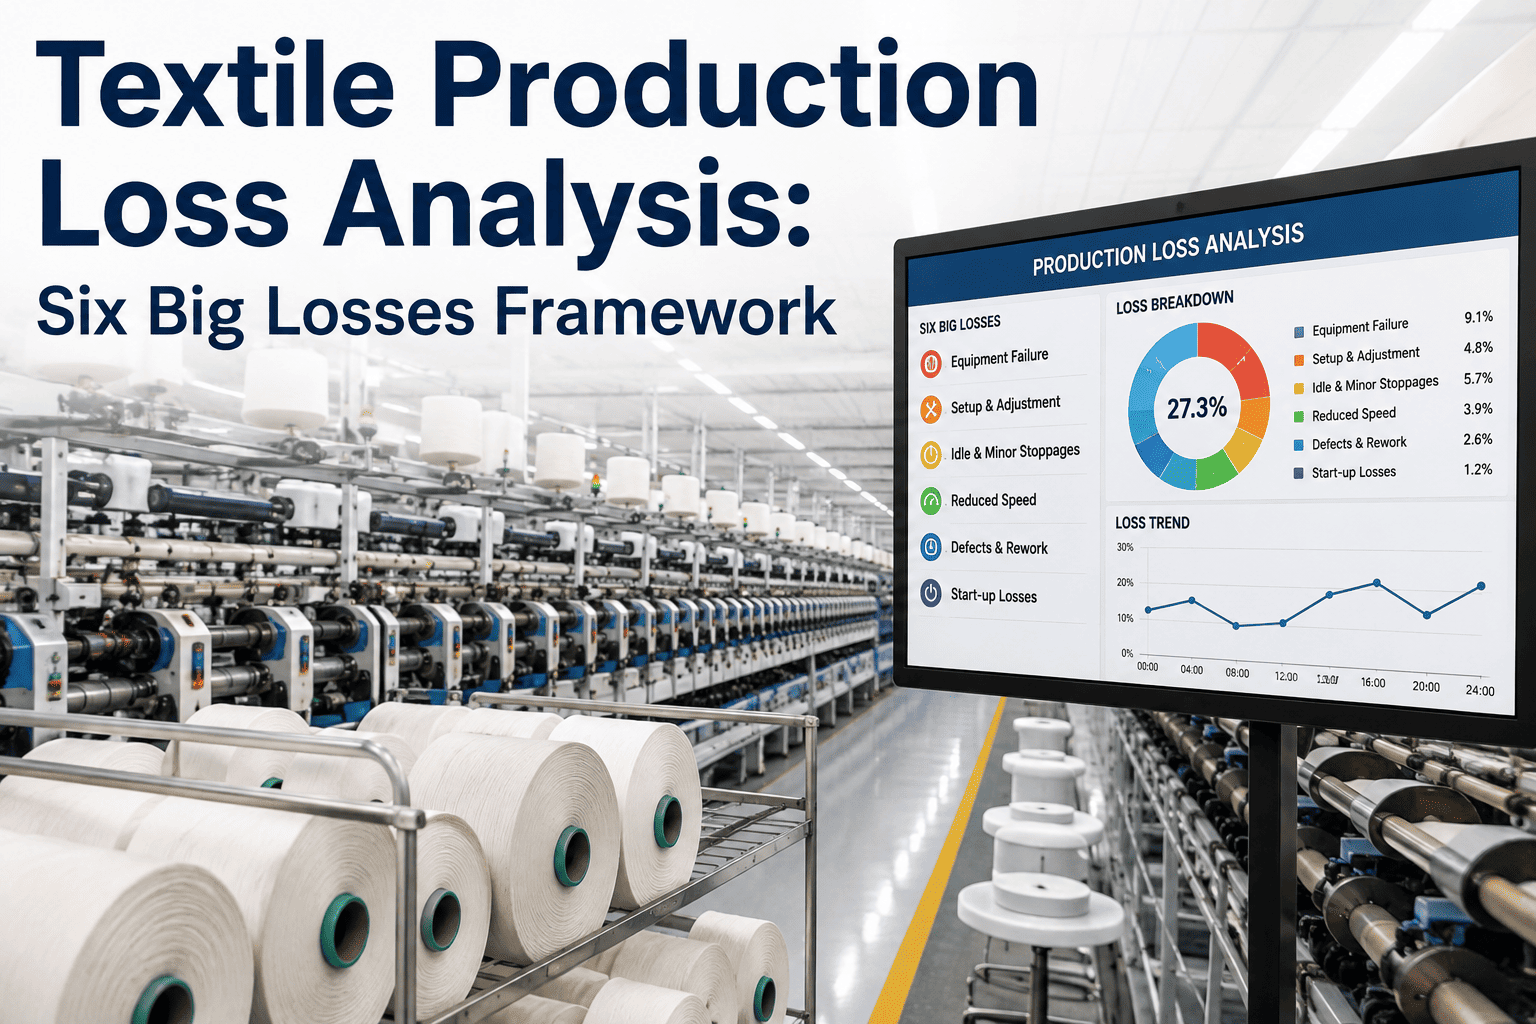
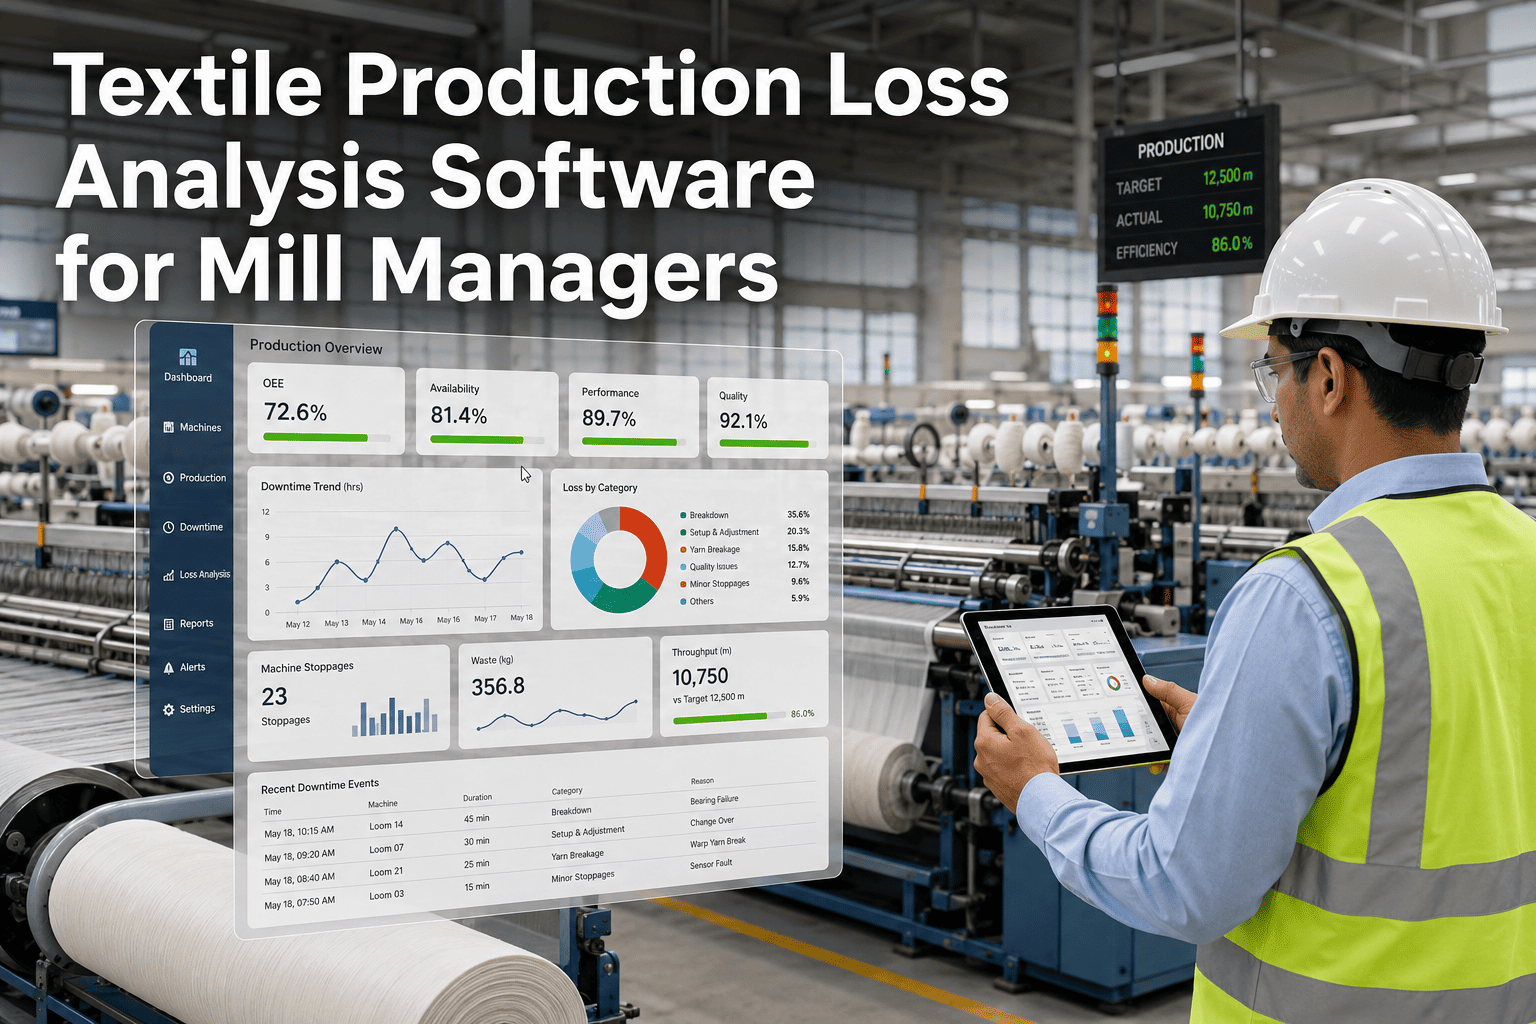
Automatically classify downtime into six big losses: equipment failure, setup/adjustment, idling/minor stops, reduced speed, defects, and reduced yield. Each loss is tagged with machine ID, shift, operator, and style for deep analysis.
Shift & Style Analytics
Break down OEE by shift, product style, and operator. Compare performance across day, evening, and night shifts. Identify which styles cause more defects or changeover delays. Optimize production scheduling accordingly.
Departmental Benchmarking
Compare OEE across weaving, spinning, knitting, and finishing departments. Set department-specific targets and track progress. Identify which area needs most improvement and allocate resources effectively.
Implementing Textile OEE: A Step-by-Step Roadmap
Data Collection Infrastructure
Deploy IoT sensors or connect to existing PLCs on all critical machines. Ensure data is captured at intervals of 1 second or less for high-resolution loss analysis. Validate data accuracy with a pilot run on 10 machines.
Define OEE Parameters
Set ideal cycle times for each machine and style. Define quality standards (e.g., acceptable defect rate per 100 meters). Configure shift calendars and machine groupings by department and product family.
Dashboard & Reporting Configuration
Build real-time dashboards for operators, supervisors, and plant managers. Include OEE gauges, loss Pareto charts, and trend lines. Set up automated daily email reports with top 5 loss machines.
Root Cause & Action Planning
Use loss data to perform root cause analysis. For example, if a loom shows high minor stops due to yarn breakage, schedule preventive maintenance on tension rollers. Assign corrective actions to teams with deadlines.
Continuous Improvement Loop
Monitor OEE trends weekly. Hold daily stand-up meetings to review top losses. Adjust targets as processes improve. Use A/B testing to validate changes (e.g., new maintenance protocol vs. old).
Ready to Boost Your Textile OEE?
Our experts will help you set up machine-level loss analysis in under 2 weeks. See immediate ROI.
OEE Metrics by Textile Department
| Department | Availability | Performance | Quality | OEE | Top Loss |
|---|---|---|---|---|---|
| Weaving | 92% | 88% | 97% | 78% | Yarn breaks (minor stops) |
| Spinning | 94% | 85% | 96% | 77% | Roving change (setup) |
| Knitting | 90% | 90% | 95% | 77% | Needle breakage (equipment failure) |
| Dyeing | 88% | 82% | 93% | 67% | Color mismatch (defects) |
| Finishing | 91% | 87% | 94% | 74% | Chemical dosing delays (idling) |
Loom Efficiency Software
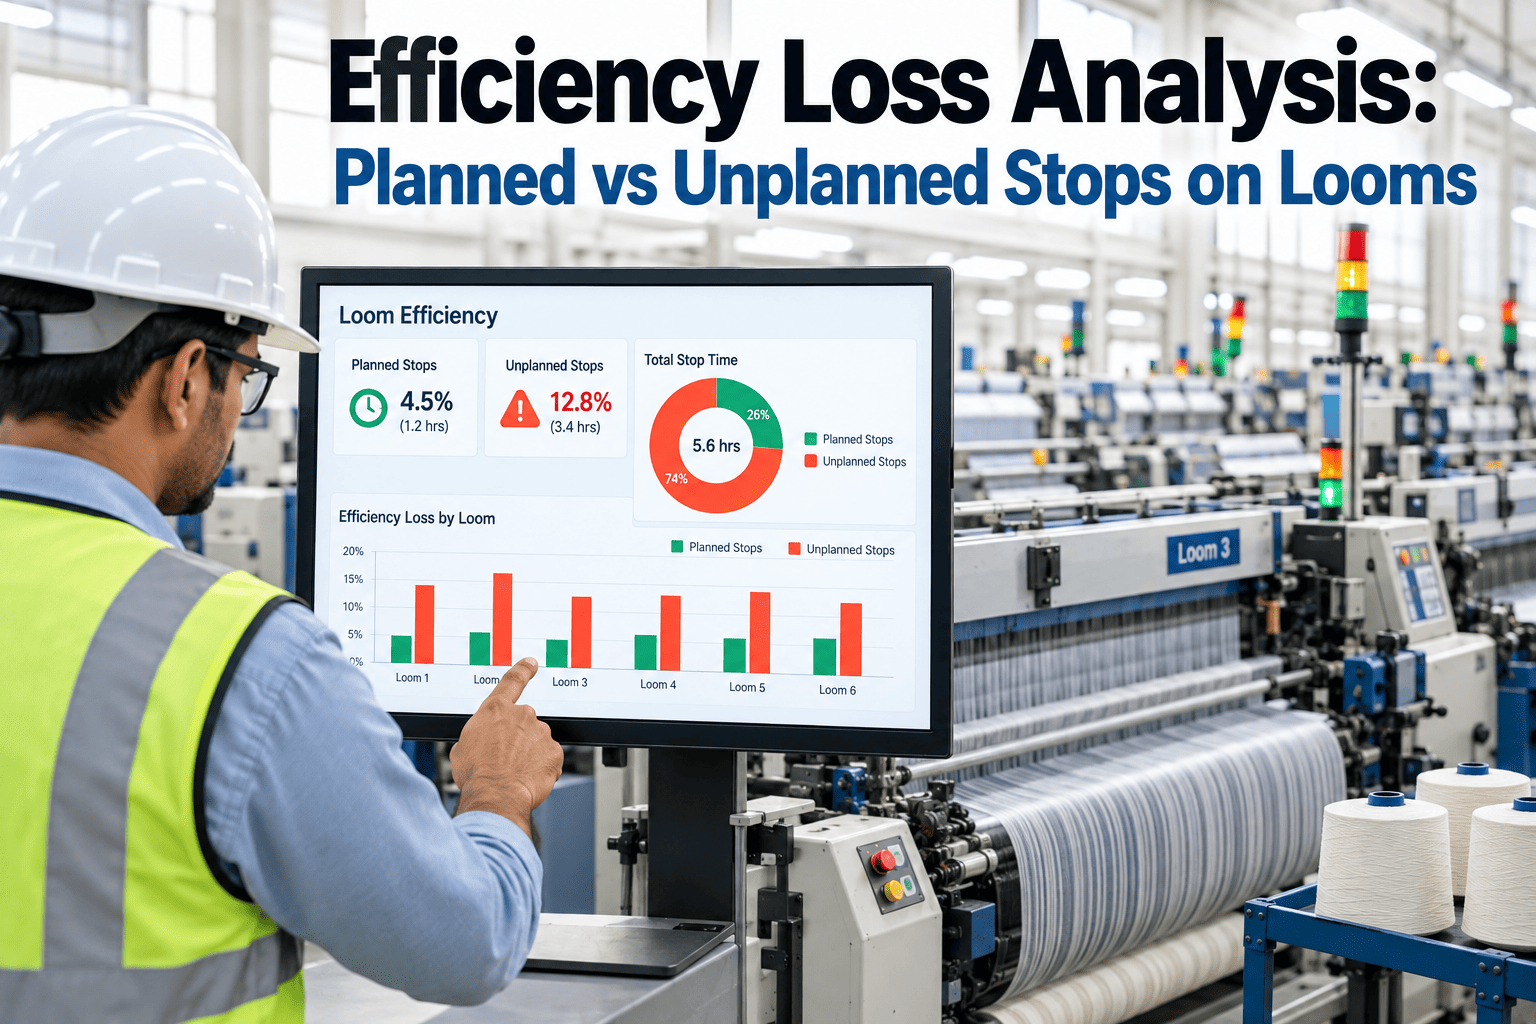
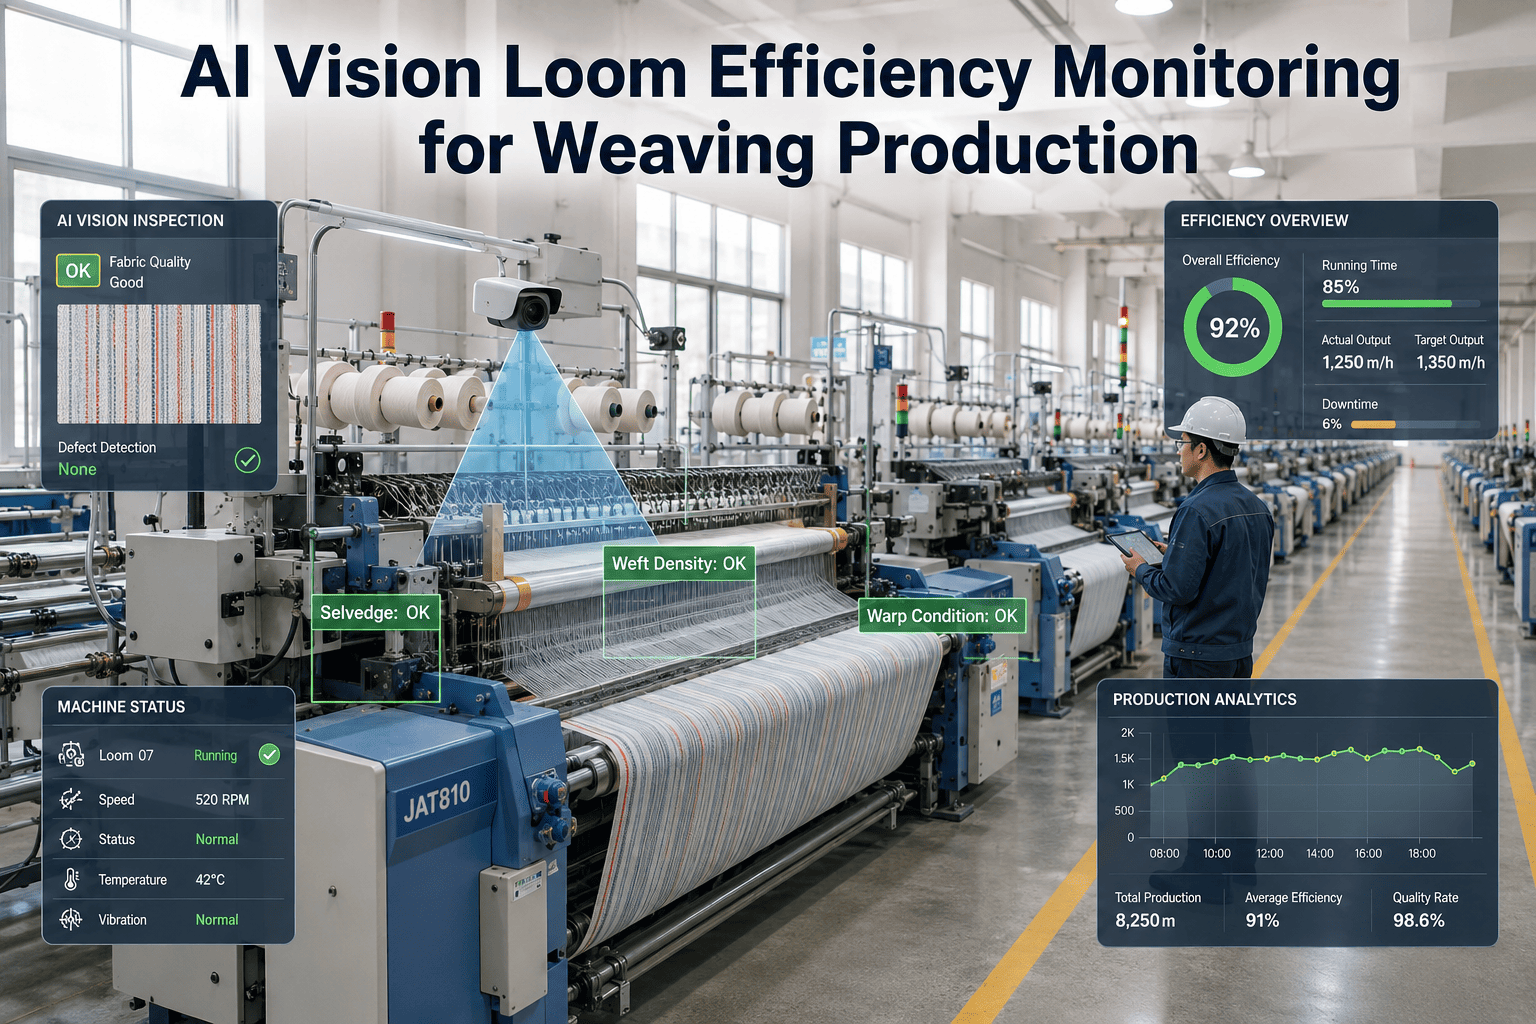
Track picks per minute, warp break rate, and weft stop frequency. Automatically detect slow-running looms and alert supervisors. Reduce downtime by 40% with predictive alerts.
Spinning OEE Dashboard
Monitor ring frame speed, end break rate, and doffing duration. Compare performance across count types. Optimize traveler and ring replacement schedules based on real-time data.
Knitting OEE Monitoring
Measure machine RPM, fabric defect density, and needle breakage rate. Identify patterns by style and operator. Reduce seconds by 30% through targeted training.
Dyeing OEE Analytics
Track batch cycle time, color reproducibility, and chemical consumption. Correlate machine parameters with quality outcomes. Reduce re-dyeing costs by 25%.
Why Machine-Level Loss Analysis Matters
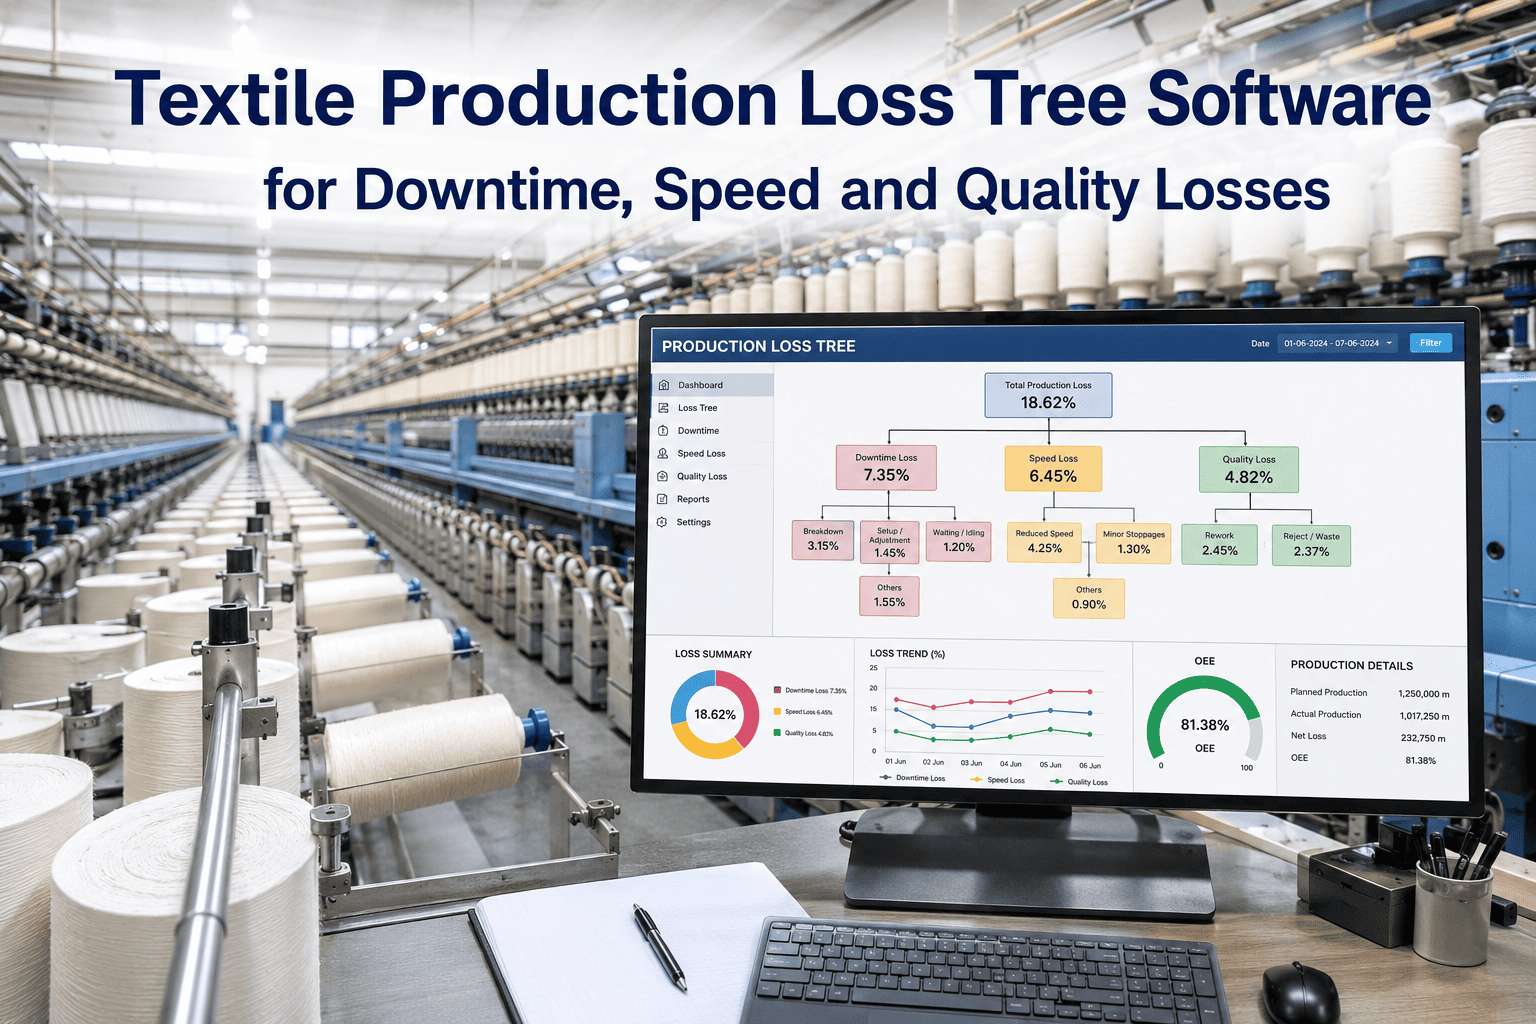
Aggregate OEE hides the true picture. A plant may show 75% OEE, but a few machines could be running at 50% while others at 90%. Machine-level analysis reveals the variance, enabling targeted interventions. For example, if 3 looms out of 50 cause 40% of all downtime, maintenance can focus on those specific machines first. This granularity accelerates improvement cycles and maximizes ROI on every improvement dollar.
Integrating OEE with Quality Management
Textile OEE software should not operate in a silo. When a defect is detected (e.g., shade variation), the system can trace back to the exact machine, operator, shift, and batch. This closed-loop feedback enables rapid correction of process parameters. Over time, the system learns which machine settings produce the highest quality, and can recommend optimal parameters to operators in real time.
Cost Savings from Improved OEE
A 10% improvement in OEE for a mid-size textile plant (200 machines) can translate to over $1.5 million in annual savings through reduced downtime, lower scrap, and increased throughput. Machine-level loss analysis ensures that improvement efforts are directed to the highest-impact areas. The payback period for OEE software is typically less than 6 months.
Frequently Asked Questions
How does textile OEE software differ from general OEE tools?
Textile-specific OEE software is tailored to the unique characteristics of textile machines, such as high-speed looms, spinning frames with many spindles, and batch-based dyeing processes. It includes specialized loss categories like yarn breaks, needle breakages, color mismatches, and changeover delays. The software also integrates with textile-specific data sources like fabric inspection systems and yarn clearers. For more details, contact our support team.
Can the software integrate with existing ERP or MES systems?
Yes, our textile OEE software offers robust APIs and pre-built connectors for major ERP systems like SAP, Oracle, and Microsoft Dynamics. It can also integrate with MES platforms and PLCs from Siemens, Allen-Bradley, and Mitsubishi. The integration enables seamless data flow for production orders, quality specs, and inventory management. To discuss your specific integration needs, book a demo.
What is the typical implementation timeline for a textile plant?
Implementation typically takes 4 to 8 weeks, depending on plant size and existing infrastructure. Phase 1 (2 weeks) involves sensor installation and connectivity testing on 10-20 machines. Phase 2 (2 weeks) includes dashboard configuration and user training. Phase 3 (2-4 weeks) is full rollout and optimization. Our team provides on-site support during all phases. For a detailed project plan, schedule a consultation.
How do you ensure data accuracy and reliability?
We use industrial-grade IoT sensors with built-in data validation algorithms. Each data point is timestamped and cross-checked against machine PLC signals. Redundant data paths ensure no loss during network interruptions. Regular audits compare OEE calculations with manual samples to maintain accuracy above 99%. For more on our data quality standards, visit our support page.
Can the system handle multiple product styles and quick changeovers?
Absolutely. The software allows you to define style-specific ideal cycle times and quality parameters. When a changeover occurs, the system automatically detects the new style via barcode scan or PLC signal and adjusts OEE calculations accordingly. Changeover time is tracked as a separate loss category to help optimize setup procedures. To see a live demonstration of style-based OEE tracking, book a demo.
Start Your Textile OEE Journey Today
Join 200+ textile plants worldwide that trust iFactory for machine-level loss analysis. Get your customized demo now.