In the highly competitive textile manufacturing landscape, energy costs—particularly those associated with boiler operations—represent one of the largest controllable expenditures. Steam is the lifeblood of textile processing, powering everything from dyeing and finishing to drying and pressing. Yet, most textile mills operate their boiler systems with significant inefficiencies, wasting fuel, over-pressurizing steam lines, and neglecting critical blowdown schedules. Advanced boiler fuel, steam, and efficiency monitoring software, such as iFactory's Energy Management solution, provides plant managers with real-time visibility into every aspect of boiler performance, enabling data-driven decisions that slash energy consumption, reduce carbon footprint, and improve bottom-line profitability. Book a Demo to see how iFactory transforms your boiler operations.
Unlock Hidden Savings in Your Boiler Room
Real-time monitoring and analytics to reduce fuel costs by up to 15% and improve steam efficiency.
Why Boiler Monitoring Matters in Textile Mills
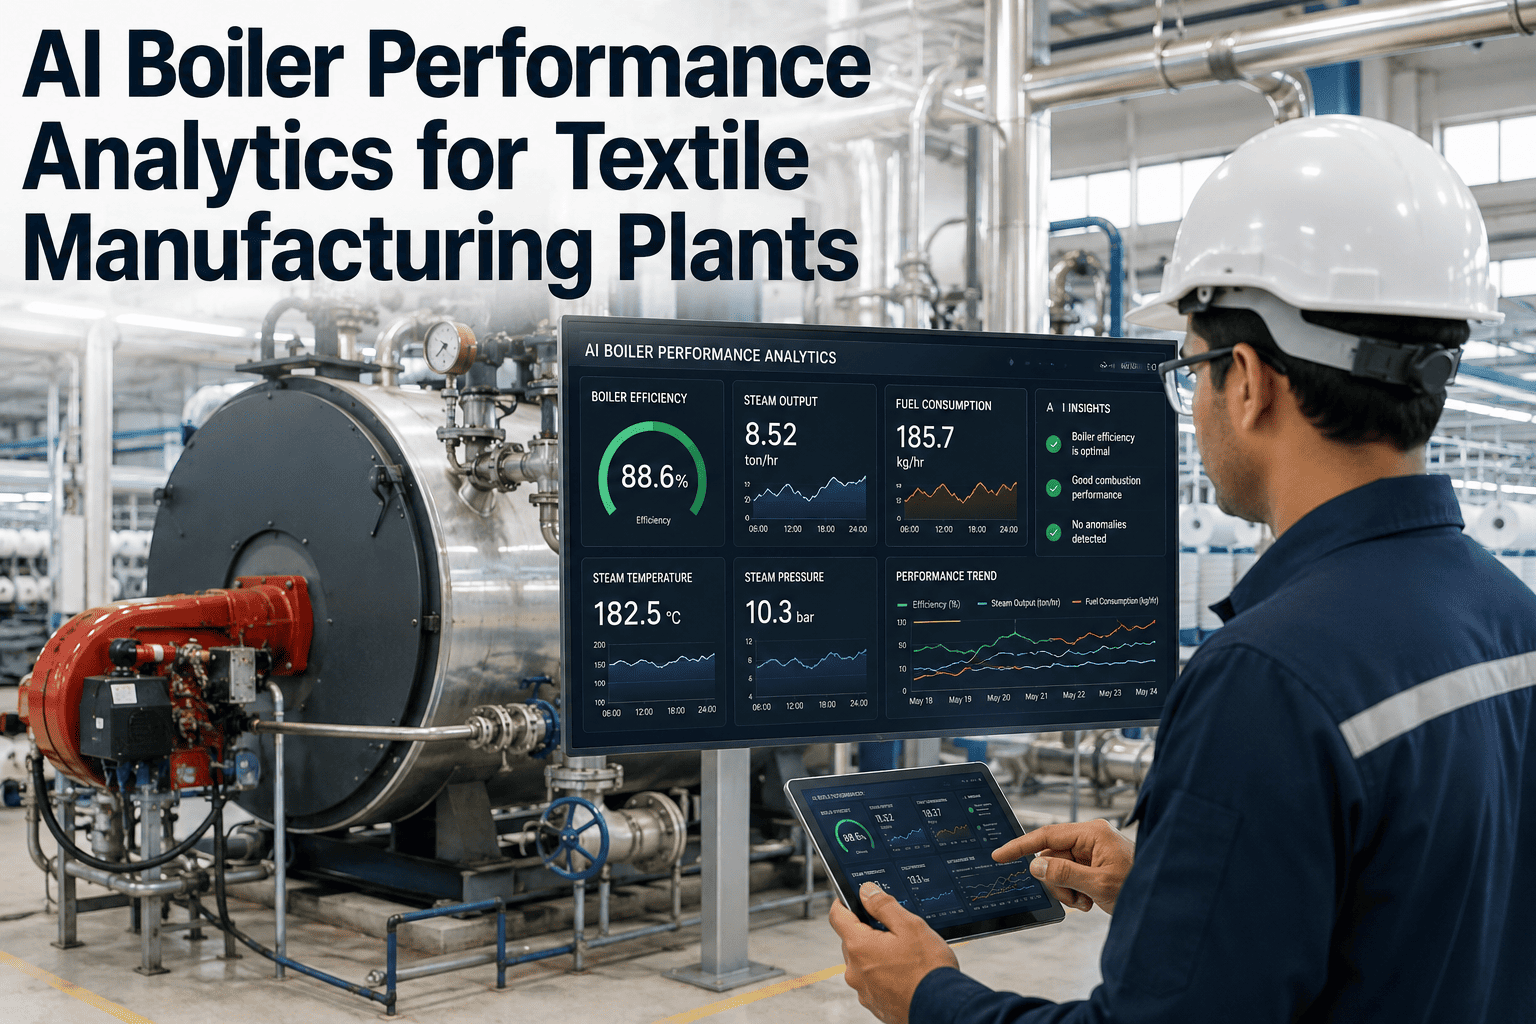
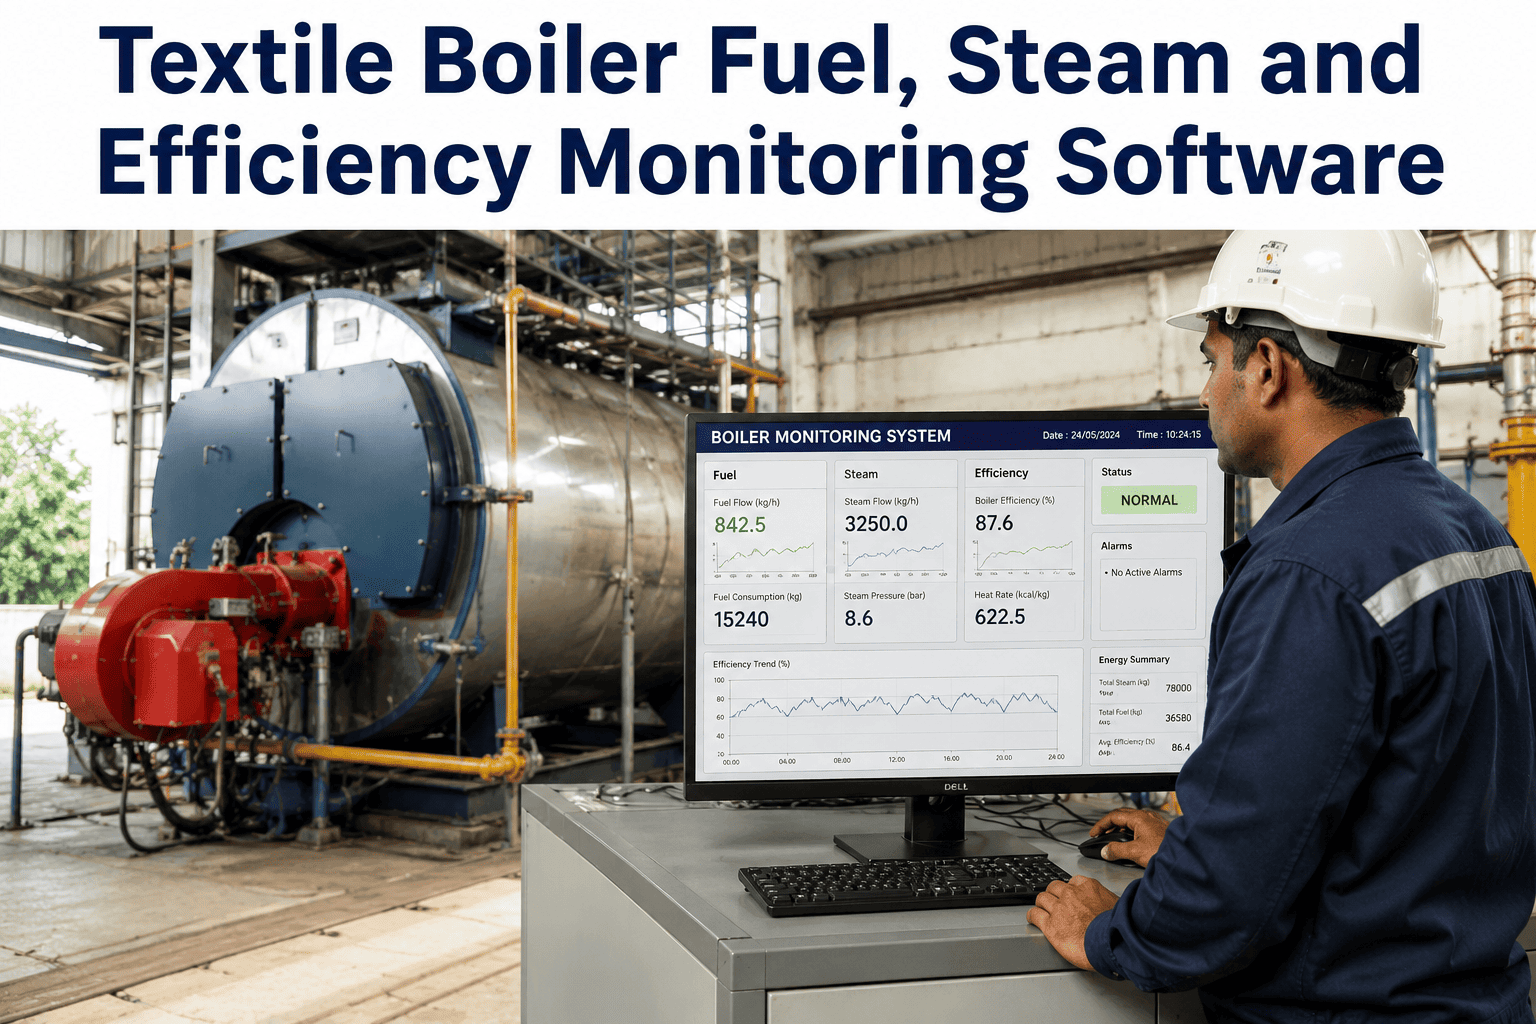
Textile processing is inherently steam-intensive. From pre-treatment to finishing, each stage demands precise thermal energy. Without granular monitoring, mills face fuel waste, uneven steam pressure, and unplanned downtime. iFactory's solution addresses these challenges with a comprehensive dashboard that tracks fuel consumption, steam generation, blowdown events, and overall boiler efficiency in real time. This enables operators to identify anomalies, optimize combustion, and schedule maintenance proactively, ensuring peak performance and minimal energy loss.
Real-time fuel usage per unit of steam generated, with historical trends for benchmarking.
Live steam output with pressure and temperature data to ensure process consistency.
Automated blowdown scheduling based on conductivity and TDS levels to save energy.
Overall boiler efficiency calculated from fuel-to-steam ratio and heat losses.
Comprehensive Fuel Consumption Analytics
Understanding fuel consumption patterns is the first step toward cost reduction. iFactory's software captures data from flow meters, pressure sensors, and combustion analyzers to provide a holistic view of fuel usage. The system breaks down consumption by shift, product type, and machine line, allowing managers to pinpoint inefficiencies. For example, if a particular dyeing machine consistently draws more steam than its peers, the dashboard flags it for investigation. Advanced analytics also predict future fuel requirements based on production schedules, enabling better procurement and budgeting. With this level of insight, textile mills can negotiate better fuel contracts and reduce waste from over-purchasing.
Implementation Roadmap for Boiler Monitoring
Sensor Installation & Integration
Deploy IoT sensors on fuel lines, steam headers, and blowdown valves. Connect to iFactory's edge gateway for secure data transmission.
Dashboard Configuration
Customize dashboards to display key metrics: fuel flow, steam pressure, boiler efficiency, and blowdown frequency. Set alerts for deviations.
Baseline & Benchmarking
Establish baseline performance metrics. Compare boiler efficiency across shifts and seasons to identify best practices.
Continuous Optimization
Use predictive analytics to adjust combustion settings, schedule blowdowns, and plan maintenance, achieving sustained efficiency gains.
Ready to Optimize Your Boiler Operations?
iFactory's Energy Management solution delivers measurable ROI from day one. Schedule a demo now.
Key Features of iFactory Boiler Monitoring
Real-time monitoring of fuel consumption with alerts for abnormal usage patterns.
Monitor steam pressure, temperature, and dryness fraction to ensure process quality.
Automated blowdown based on conductivity, reducing energy loss and water waste.
Visual representation of boiler efficiency with historical trend analysis.
AI-driven alerts for potential failures, reducing unplanned downtime.
Allocate steam costs to specific departments for accurate cost accounting.
Boiler Performance Metrics Dashboard
| Metric | Target Range | iFactory Monitoring |
|---|---|---|
| Fuel Consumption (L/kg steam) | 0.08 - 0.12 | Real-time tracking with shift-wise breakdown |
| Steam Generation (kg/hr) | 5000 - 15000 | Live monitoring with pressure and temp |
| Blowdown Frequency (per day) | 2 - 4 | Automated scheduling based on TDS |
| Boiler Efficiency (%) | 85 - 95 | Continuous calculation with trend analysis |
| Steam Cost per kg | Minimize | Cost allocation by department |
Case Study: 15% Fuel Reduction at ABC Textiles
ABC Textiles, a mid-sized mill in Gujarat, India, implemented iFactory's boiler monitoring solution across three 10-ton boilers. Within six months, they achieved a 15% reduction in fuel consumption, translating to annual savings of $120,000. The key driver was real-time blowdown optimization, which reduced heat loss by 20%. Additionally, predictive maintenance alerts prevented two major breakdowns, saving an estimated $50,000 in repair costs. The mill's overall steam efficiency improved from 82% to 91%, directly impacting their bottom line. This case demonstrates the transformative power of data-driven boiler management.
Traditional vs. iFactory Approach
Traditional Boiler Management
- Manual log sheets with daily readings
- Reactive maintenance after failures
- Fixed blowdown schedules
- No visibility into department consumption
- Average efficiency below 80%
iFactory Energy Management
- Real-time digital dashboard with alerts
- Predictive maintenance using AI
- Automated blowdown based on TDS
- Department-wise cost allocation
- Sustained efficiency above 90%
Best Practices for Boiler Efficiency Optimization
To maximize the benefits of boiler monitoring, textile mills should adopt the following best practices:
- Regular calibration of sensors to ensure data accuracy.
- Establish baseline metrics for each boiler and track deviations.
- Use historical data to optimize combustion settings for different fuels.
- Implement a proactive blowdown schedule based on real-time conductivity readings.
- Train operators to interpret dashboard alerts and take corrective actions.
- Integrate boiler data with overall plant energy management for holistic optimization.
Frequently Asked Questions
Transform Your Boiler Operations Today
iFactory delivers actionable insights that reduce costs and improve efficiency. Schedule your demo now.