Overall Equipment Effectiveness has long been the standard metric for textile manufacturing productivity, but until recently most mills calculated OEE manually from shift-end paper reports that arrived 12 to 48 hours after production happened. A spinning mill running 60 ring frames from Rieter or Murata generates millions of data points per shift — spindle speed, breakage rate, doff timing, waste percentage, and machine status events — and weaving mills with 100 Picanol or Toyota air-jet looms track picks per minute, weft stops, warp stops, and efficiency at sub-second granularity. Real-time OEE dashboards consume this machine data directly from PLCs via OPC UA or native protocols, compute OEE, availability, performance, and quality in real time, and display them on plant-floor screens, supervisor tablets, and management dashboards simultaneously. The 2025 Textile World benchmark study of mills using real-time OEE dashboards reported an average OEE improvement of 12.4 percentage points within 12 months of deployment — from 67.3 percent baseline to 79.7 percent — driven by immediate visibility into stop causes, shift-to-shift performance comparison, and data-backed decision-making that replaced gut-feel management. For a typical mill processing 150,000 kilograms of yarn per month, each percentage point of OEE improvement translates to approximately $18,000 to $24,000 in annual profit through increased throughput, reduced waste, and lower conversion costs.
See Every Machine's OEE Live — Spinning, Weaving, Dyeing, Finishing
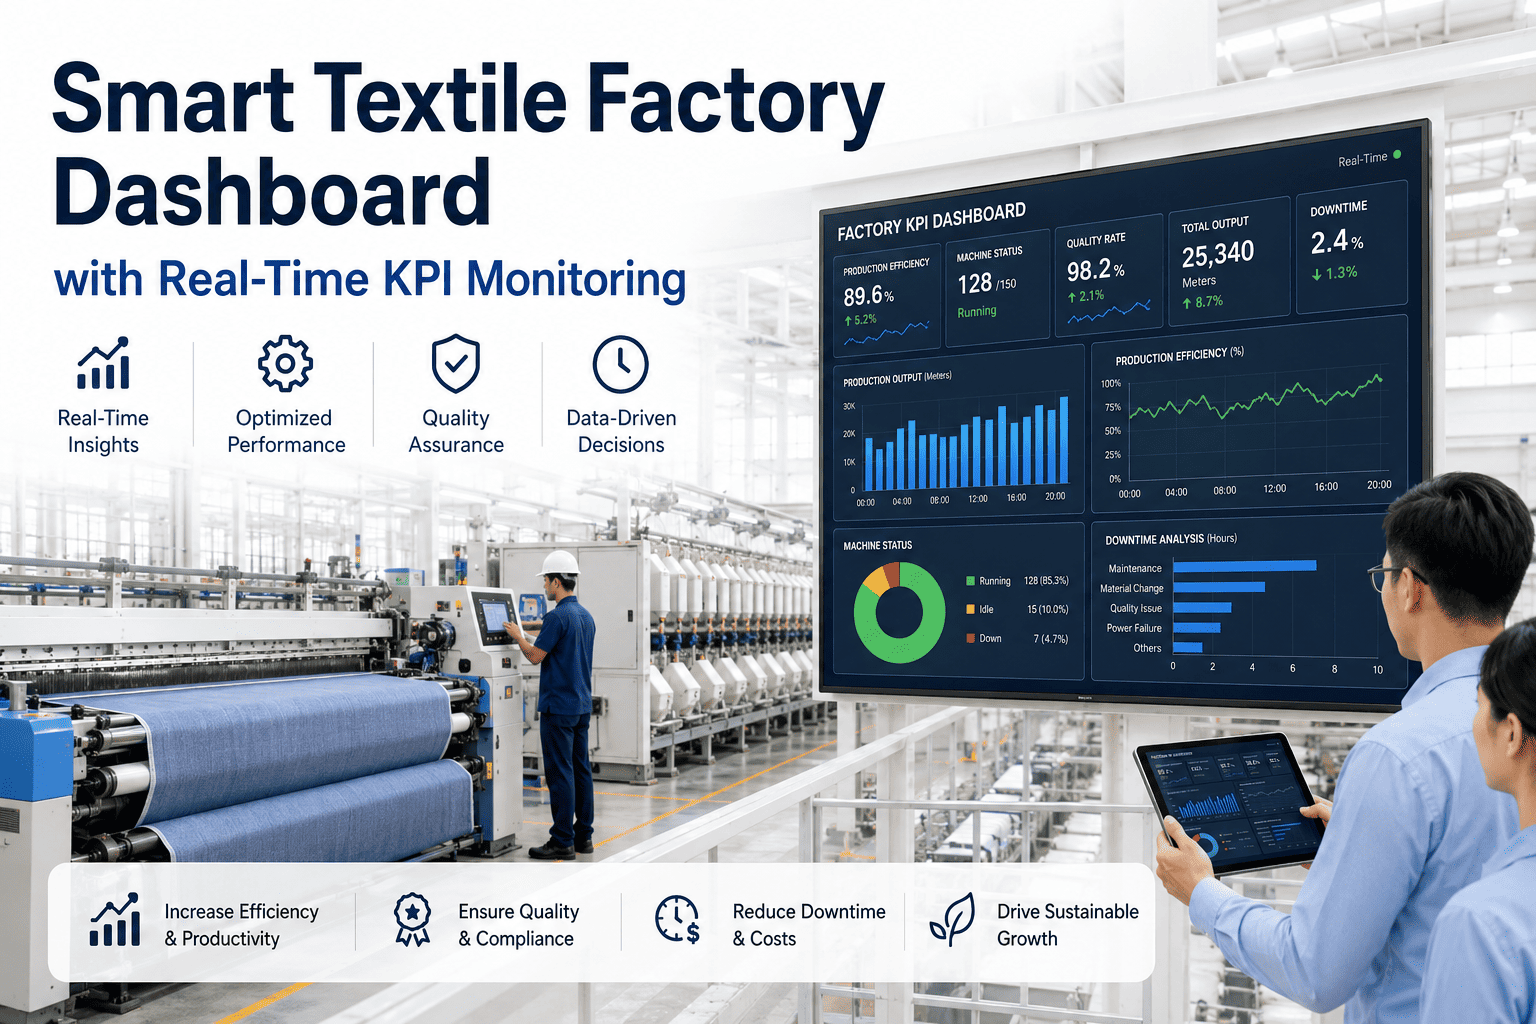
iFactory OEE Dashboard connects to any PLC or machine controller, computes OEE automatically, and displays real-time KPI dashboards on plant-floor screens and mobile devices.
Real-Time OEE Dashboard — Four Core Metrics That Drive Mill Profitability
The OEE dashboard displays four primary metrics computed from live machine data at configurable time windows — current shift, last 24 hours, MTD, and trailing 12 months — with automatic drill-down to individual machine, operator, and product grade.
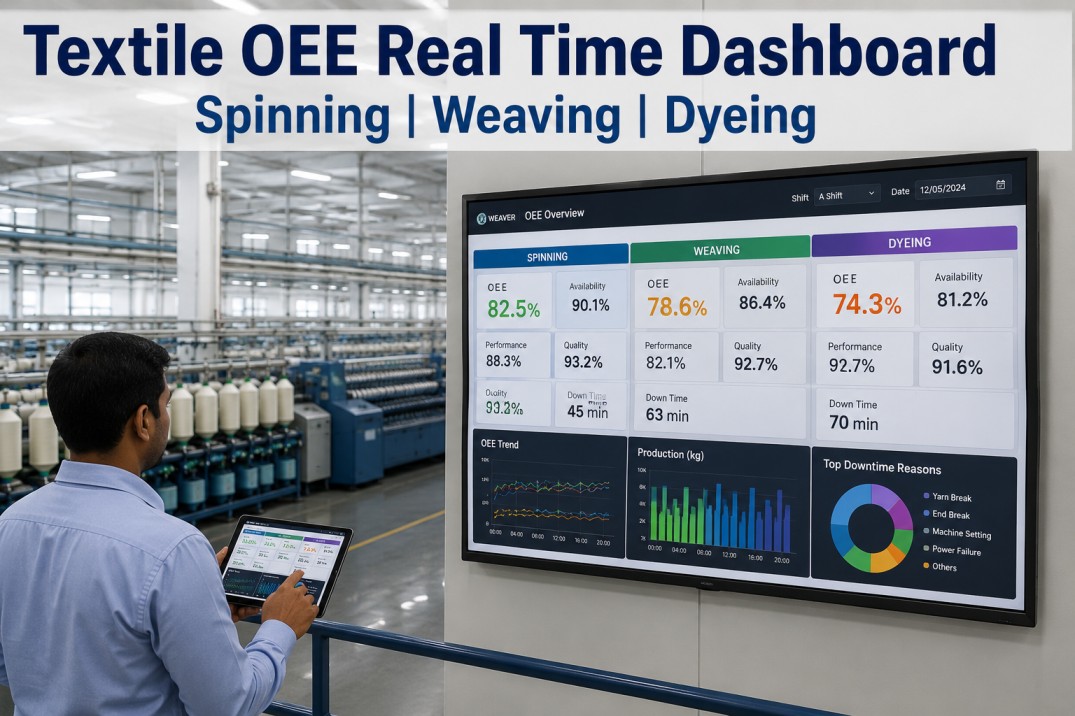
Department OEE Comparison — Where Each Process Stands
OEE profiles differ significantly across textile processes due to inherent process characteristics. Spinning typically has the highest availability but lower performance due to spindle speed constraints, while weaving has lower availability due to higher stop frequencies but higher performance when running.
Machine Performance Profiles — Rieter, Picanol, Murata, and Toyota
Each machine model has characteristic performance profiles that the OEE dashboard tracks individually, enabling maintenance teams to compare identical machines across production lines and identify underperformers immediately.
Compare Every Machine Side by Side — Find Underperformers Instantly
iFactory OEE Dashboard ranks every machine by OEE, availability, performance, and quality, with automatic alerts for machines falling below user-defined thresholds.
Stop Cause Breakdown — Where Each Department Loses Production Time
The OEE dashboard classifies every stop event into categories automatically based on PLC signal patterns and operator inputs, providing department-specific visibility into the root causes of availability loss.
Frequently Asked Questions
How does the OEE dashboard calculate availability for machines that run 24/7?
For continuous-operation textile processes (spinning, weaving, dyeing ranges), availability is calculated as the ratio of actual operating time to planned production time, where planned production time is the total shift time minus planned downtime (scheduled maintenance, meetings, breaks). The key distinction is between planned and unplanned downtime. Planned downtime is configured in the OEE dashboard per shift and machine group — for spinning, 30 minutes per shift for cleaning and doffing is typical planned downtime. Unplanned downtime is any stop event that occurs outside planned stops, detected automatically by the PLC signal. The iFactory OEE dashboard automatically classifies scheduled cleaning, planned maintenance windows, and operator breaks as planned downtime (excluded from availability calculation), while machine stops, alarms, and emergency stops are classified as unplanned downtime (included in availability calculation). For mills running 24/7 continuous operations with rotating shifts, the dashboard computes availability per shift and per rolling 24-hour window simultaneously, giving both shift-level and daily visibility.
Can the dashboard track OEE for individual operators or shifts?
Yes — the OEE dashboard tracks OEE by shift (A, B, C), by operator group, and by individual operator where machine assignment data is available. Shift-level OEE is tracked automatically because shift start and end times are configured in the MES and the dashboard attributes every production minute to the active shift. Operator-level OEE requires the MES to know which operator is assigned to which machine during which shift window — this data typically comes from the MES's attendance module or from machine-side badge readers. iFactory OEE supports operator assignment via manual entry on the plant-floor HMI, RFID badge scanning, or integration with the mill's HR/attendance system. The dashboard displays shift and operator OEE on separate views with the same KPI structure — OEE, availability, performance, quality — plus additional metrics like number of stops per shift, average stop duration, and production output per operator-hour. Many mills use shift-competitive OEE dashboards displayed on plant-floor screens to drive healthy competition between shifts, which typically yields a 3–7 percent OEE improvement in the first quarter of deployment.
How does iFactory handle OEE calculation for machines with multiple products or counts?
OEE calculation adapts automatically when a machine switches between products with different ideal cycle times or speed settings. The iFactory OEE dashboard receives product changeover events from the MES (or detects them automatically from PLC recipe/pattern changes) and loads the correct ideal parameters for the current product. For spinning, ideal spindle speed and TPI for each yarn count are stored in the MES and the dashboard uses the active count's ideal speed to calculate performance. For weaving, ideal picks per minute for each fabric construction are retrieved from the weaving plan. For dyeing, ideal batch cycle time per recipe is used. When a product changeover occurs, the dashboard resets the active product context for that machine and begins computing OEE against the new ideal parameters within the same shift. Historical OEE data remains available per product — so a mill manager can see that Ne 40 carded cotton consistently runs at 82 percent OEE while Ne 60 combed cotton runs at 74 percent on the same machine, enabling data-driven decisions about product mix profitability and machine allocation.
What PLC data points are needed to compute real-time OEE?
A minimum of three PLC data points are required to compute OEE for any machine: machine status (running/stopped/idle), production count (cumulative units produced), and total operating time (machine hours or minutes). With these three signals, the dashboard can compute availability (running time / planned production time), performance (actual production rate / ideal production rate), and quality (good units / total units, if a separate good-count signal is available or if waste is tracked separately). For more detailed stop-cause analysis, additional data points are valuable: stop reason code (from PLC alarm log or operator HMI input), machine speed or RPM (for speed-loss performance tracking), and waste or reject count (for quality tracking). Most modern textile machines expose these signals through their PLC — spinning frames track spindle speed, ends down count, doff status, and production hanks; weaving looms track picks, weft stops, warp stops, and machine status; dyeing machines track batch phase, temperature, pressure, and cycle count. iFactory provides pre-built OEE tag templates for Rieter, Savio, Murata, Picanol, Toyota, and 40+ other textile machine brands, so mills using these machines can go live with OEE tracking in hours rather than weeks.
How does the dashboard handle machines that are stopped for planned maintenance?
Planned maintenance stops are handled through the integration between the OEE dashboard and the CMMS (Computerized Maintenance Management System). When a maintenance work order is created in the CMMS for a specific machine during a specific time window, the OEE dashboard receives the planned maintenance schedule and automatically excludes that time from the availability calculation — the hours are counted as planned downtime rather than unplanned downtime. If a maintenance stop extends beyond its scheduled end time, the dashboard automatically reclassifies the excess time as unplanned downtime and triggers an alert to the production manager. The iFactory OEE dashboard displays planned vs unplanned downtime as a stacked bar per machine and per department, giving maintenance managers visibility into how much of their downtime is actually planned versus reactive. Mills using integrated OEE and CMMS typically reduce unplanned downtime by 35–50 percent within 6 months through improved maintenance planning and the visibility that comes from seeing planned maintenance windows that are missed or exceeded.
Real-Time OEE for Every Machine — From Any PLC, Any Protocol
iFactory OEE dashboard computes OEE automatically from machine PLC data, displays live KPIs on plant-floor screens and mobile devices, and alerts you when any machine falls below target.