Most textile facilities are producing thousands of data points every hour — from spindle vibration and motor temperature to loom tension and pump pressure. Yet the majority of mills make maintenance decisions based on fixed schedules, visual checks, and gut instinct. The gap between the data your machines generate and the decisions your team makes is where failures happen, production is lost, and profit disappears. Book a demo with iFactory to see how real-time data transforms equipment performance management across your facility.
How to Track and Optimize Textile Equipment Performance with Real-Time Data
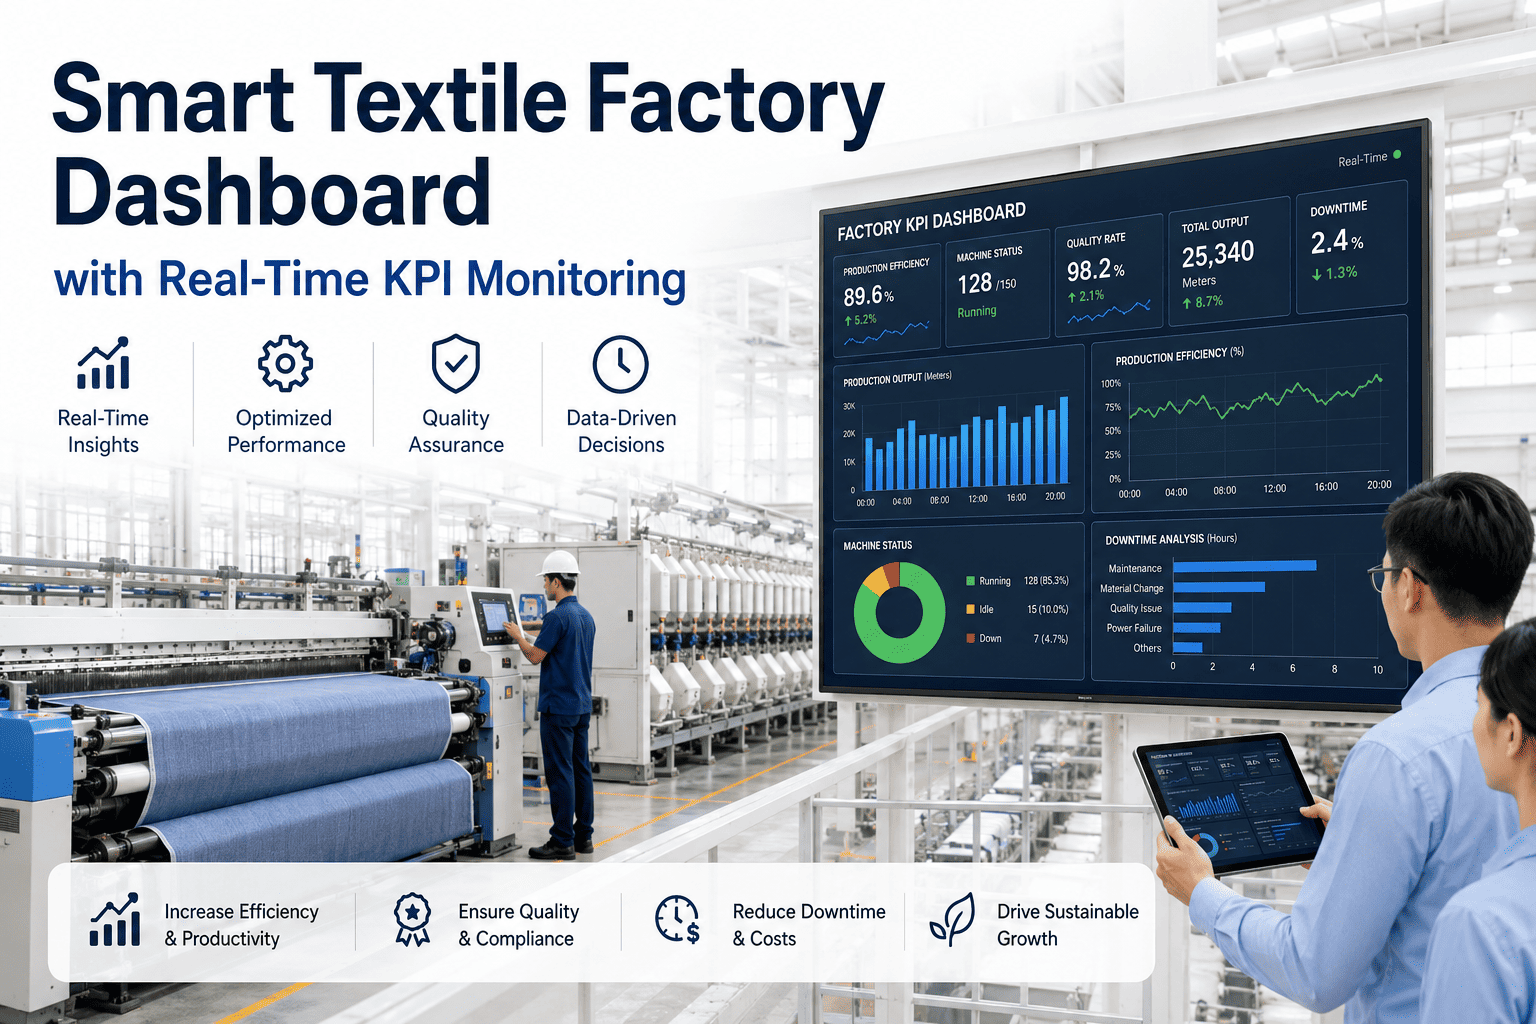
Real-time sensor data gives textile mills the ability to see exactly how every machine is performing — right now, not after the breakdown. This guide covers what to track, how to read it, and how AI turns raw data into decisions that keep production running.
Book a Free DemoWhat "Real-Time Data" Actually Means on the Factory Floor
Real-time monitoring is not about dashboards for the sake of dashboards. It is about having a continuous, unbroken picture of what every machine in your facility is doing — so that when a spindle starts vibrating 6% outside its normal range at 2am on a Saturday, your system already knows and your team acts before Monday's shift is disrupted.
Vibration, temperature, electrical current, and pressure — the four data streams that reveal 90% of developing faults in textile equipment before they cause failure.
Unlike manual inspections that capture one moment in time, real-time sensors monitor every second of every shift — including nights, weekends, and peak production runs when failures are most costly.
AI analysis of real-time sensor data detects fault signatures weeks before breakdown — enough time to plan, source parts, and schedule repairs without losing production hours.
The Four Performance Signals Every Textile Mill Should Be Tracking
Each of these data streams tells a different story about machine health. Together, they create a complete picture that no manual inspection can replicate.
Vibration is the earliest and most reliable indicator of mechanical wear. Bearing degradation, shaft misalignment, and imbalance all produce distinct frequency signatures that AI can identify before they become audible or visible.
A bearing running 11°C above its normal envelope is not a minor deviation — it is a fault in progress. Temperature monitoring catches friction buildup, lubrication failure, and electrical resistance changes before they cause structural damage.
Motor current draw reflects the mechanical load on a machine in real time. An 8% rise in current with no corresponding change in production output is a clear signal that something is consuming energy it should not be — resistance, misalignment, or wear.
Pressure variance in hydraulic and pneumatic systems is one of the first signs of seal wear, impeller degradation, or valve actuator failure. In dyeing equipment, pressure deviation also signals chemical dosing errors that affect batch quality.
From Raw Data to Actionable Performance Scores
Raw sensor numbers mean nothing without context. The power of AI is in building a unique performance baseline for each machine — then scoring every deviation against that baseline in real time.
AI learns the normal operating envelope for each individual machine — accounting for shift patterns, load variation, ambient conditions, and equipment age. This baseline is unique to your machine, not an industry average.
Every reading is compared against the established baseline. Deviations are scored by magnitude, duration, and pattern match — distinguishing a one-time spike from a developing fault that worsens over days or weeks.
Pattern combinations are matched against a library of known failure signatures. When the probability score crosses defined thresholds, the system escalates automatically — from monitoring to alert to work order.
With 2–5 weeks of advance warning, your team schedules the intervention at the right time — not in response to a breakdown. Parts are sourced, technicians are booked, and production continues without disruption.
What Optimized Textile Equipment Performance Actually Looks Like
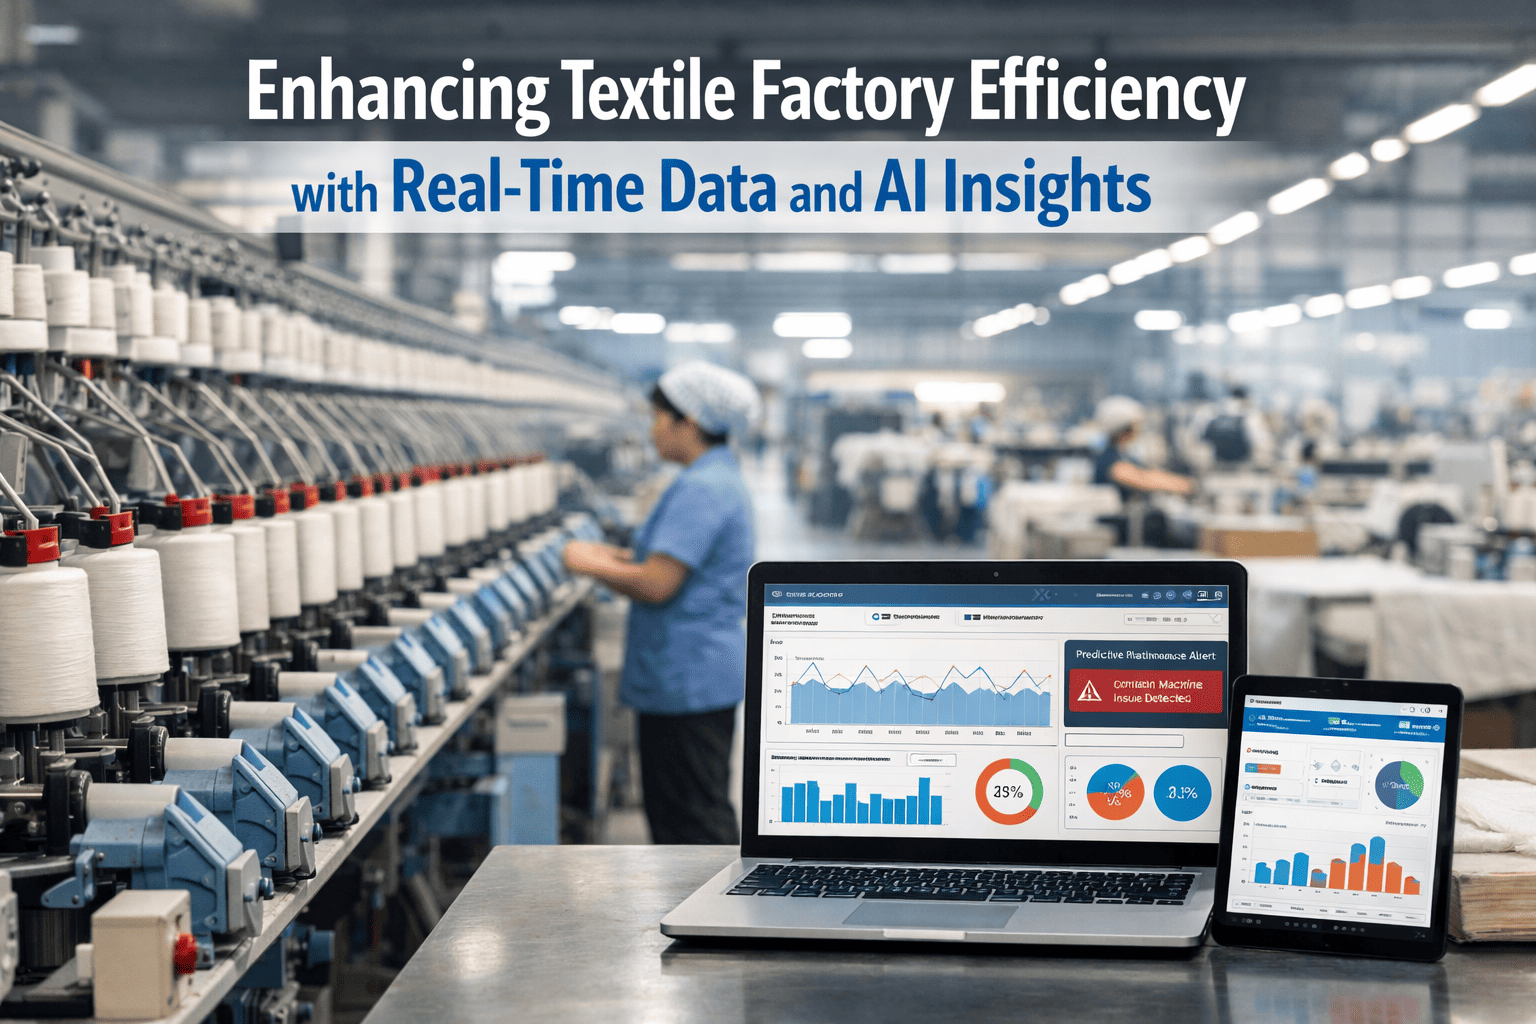
Real-time data does more than prevent failures. It continuously improves how every machine in your facility performs — shifting your operation from break-and-fix to optimized-and-efficient.
Machine-by-Machine: What to Track and Why
Different textile machines have different failure modes. Real-time monitoring is most effective when the right signals are tracked for each asset type.
Not sure which signals matter most for your specific machine mix? iFactory's support team maps your asset register to the right monitoring parameters during onboarding — no guesswork, no generic templates.
The Cost of Waiting vs. The Return on Tracking
Your Machines Are Sending Signals Right Now. Are You Receiving Them?
iFactory deploys real-time IoT monitoring across your spinning, weaving, knitting, and dyeing equipment in under two weeks — no production shutdown, no new hires, no complexity. See live performance data from every machine in your facility from day one.
Book a Free Demo