Textile manufacturing has always been a data-rich industry — every loom cycle, every dye batch, every shipment generates information. The problem is that most of it disappears into spreadsheets, paper logs, and disconnected systems before anyone can act on it. AI-driven data analytics changes this equation entirely. By connecting production data, quality signals, inventory movements, and demand patterns into a single intelligent layer, textile manufacturers are now making faster decisions, catching defects before they reach the customer, and unlocking efficiency gains that were impossible to see with manual reporting. This guide explains exactly how AI analytics applies to textile manufacturing — and how iFactory's platform delivers these capabilities to factory floors today.
AI · Data Analytics · Textile Manufacturing
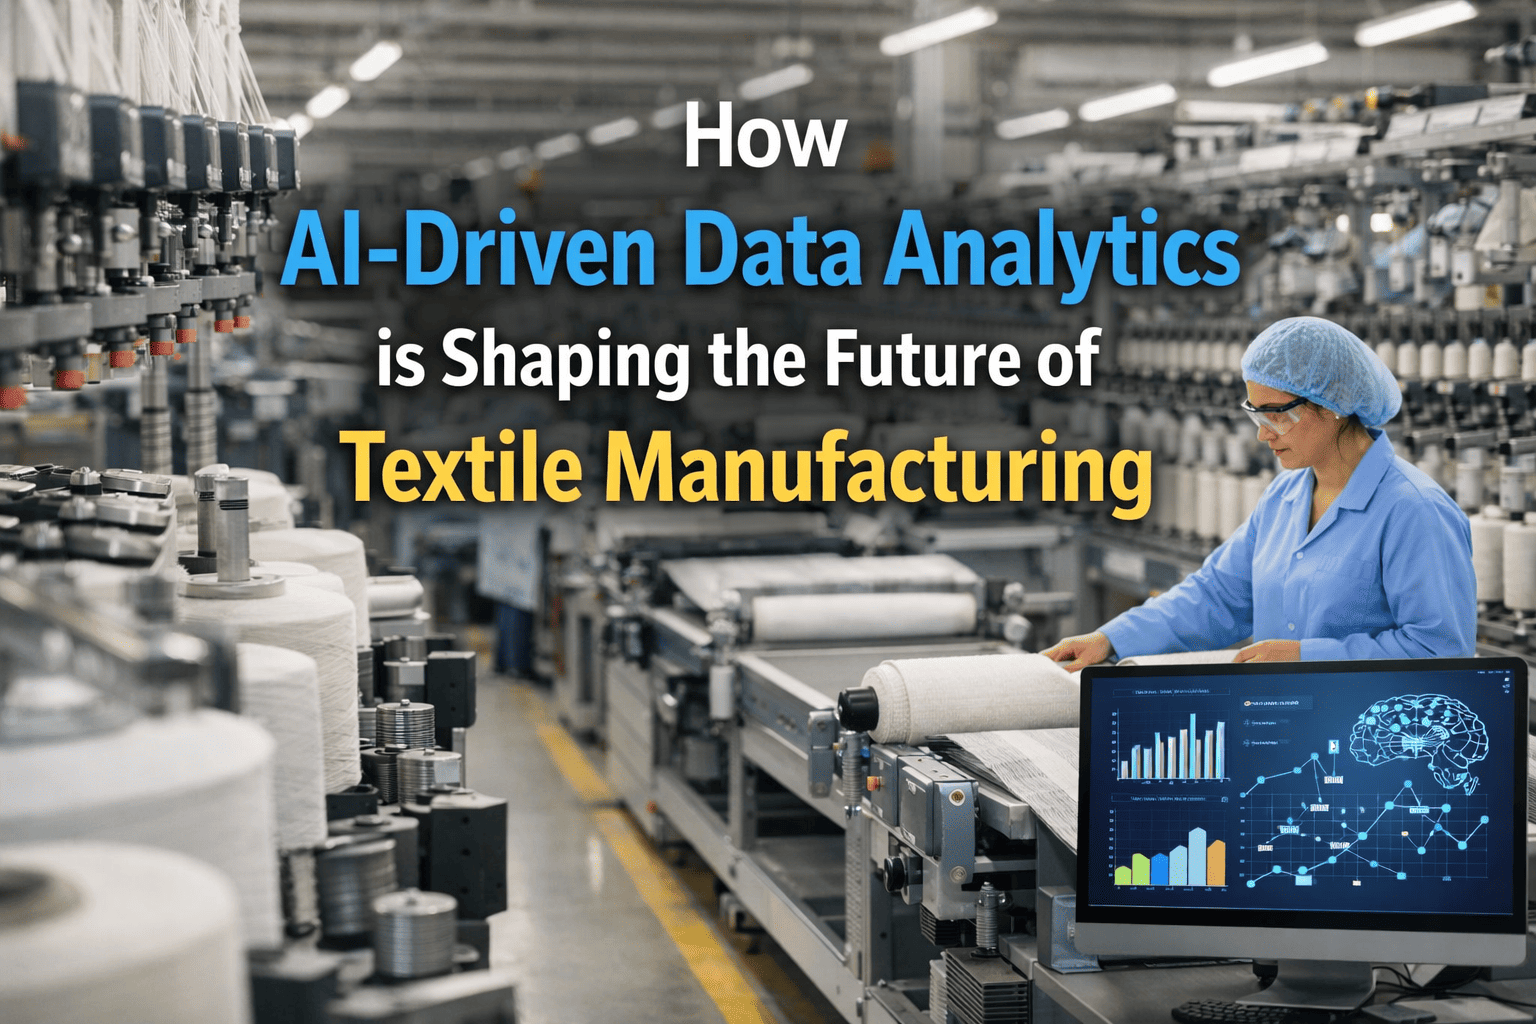
How AI-Driven Data Analytics Is Shaping the Future of Textile Manufacturing
From reactive firefighting to predictive precision — AI analytics is giving textile plant managers real-time visibility into quality, production, and inventory that spreadsheets and manual checks could never provide.
$1.7T
Global textile market size driving AI adoption at scale
35%
Reduction in defect rates with AI quality monitoring
24%
CAGR of AI adoption in textile manufacturing globally
40%
Less unplanned downtime through predictive maintenance analytics
The Data Problem
Textile Manufacturers Are Data-Rich but Insight-Poor
The average textile plant generates thousands of data points per shift — but less than 12% of it is ever analyzed in time to prevent problems. Here is what that gap costs.
2–5%
Production Lost to Defects
Quality failures discovered late — at finishing or dispatch — rather than at the loom or dyeing stage where correction is still possible.
30%
Of Operating Cost Is Energy
Energy consumption runs without optimization because no system links machine load data to production schedules in real time.
18%
Excess Inventory Holding Cost
Demand forecasting errors lead to overstocking of slow-moving yarn and fabric, while fast-moving SKUs go out of stock repeatedly.
60%
Downtime Is Fully Preventable
Most equipment failures show early warning signals in vibration, temperature, and output data — signals no one is reading until breakdown occurs.
AI Analytics in Action
Five Ways AI Analytics Transforms Textile Factory Operations
AI analytics is not a single tool — it is a data layer that connects your production, quality, inventory, and dispatch systems into one decision-making engine.
01
Real-Time Quality Intelligence
AI models analyze loom tension data, dye concentration readings, and fabric inspection results in real time — flagging quality deviations before a full batch is affected. Defect detection moves from end-of-line inspection to in-process correction.
Defect detection speed improvement
87% faster
02
Predictive Maintenance Scheduling
Machine sensor data — vibration patterns, motor temperature, output rate variance — feeds predictive models that flag maintenance needs 48–96 hours before failure probability spikes. Planned maintenance replaces emergency downtime.
Unplanned downtime reduction
72% reduction
03
Demand Forecasting and Inventory Optimization
AI models trained on historical order data, seasonal patterns, and customer replenishment cycles generate 30–90 day demand forecasts that automatically adjust raw material procurement — reducing both overstock and stockout conditions simultaneously.
Forecast accuracy improvement
68% more accurate
04
Production Schedule Optimization
AI scheduling engines balance order priority, machine availability, yarn lot compatibility, and shift capacity simultaneously — generating production plans that human schedulers take hours to build, updated in seconds as conditions change.
Schedule adherence improvement
55% improvement
05
Energy Consumption Analytics
AI maps energy consumption per machine, per shift, per product type — identifying which production configurations are consuming disproportionate power and when load-shifting can reduce peak energy costs without affecting throughput.
Energy cost reduction
Up to 42% savings
iFactory Brings AI-Driven Analytics to Your Textile Factory Floor
Real-time production data. Automated quality alerts. Predictive inventory management. Live in 14 days — no heavy IT project required.
Before vs After
Textile Factory Operations — Manual Reporting vs AI Analytics
Function
Without AI Analytics
With iFactory AI Analytics
Quality Monitoring
End-of-line inspection catches defects after full batch is wasted — 2–5% production loss baked in
Real-time in-process alerts flag deviations at the loom — defect batch size reduced by up to 87%
Maintenance
Reactive breakdown maintenance — average 6–8 hours unplanned downtime per incident per machine
Predictive alerts 48–96 hours before failure — planned maintenance windows, zero surprise shutdowns
Demand Forecasting
Manual spreadsheet projections — 25–40% forecast error, chronic overstock and stockout cycles
AI-driven 90-day forecasts — 68% more accurate, procurement aligned to actual demand signals
Production Reporting
Daily reports compiled manually — data is 12–24 hours old before managers can act on it
Live production dashboards — OEE, defect rate, throughput, and energy visible in real time
Energy Management
Monthly utility bills reviewed after the fact — no visibility into which machines or shifts waste power
Per-machine energy analytics — shift-level consumption visible, load-shifting saves up to 42%
Decision Speed
Production decisions based on yesterday's data — problems compound before corrective action is taken
Instant alerts, automated escalations, one-click drill-down — decisions made in minutes, not days
Measurable Outcomes
What Textile Manufacturers Measure Within 90 Days of iFactory Go-Live
87%
Faster Defect Detection
In-process quality alerts replace end-of-line inspection — defect batches stopped before they compound.
40%
Less Unplanned Downtime
Predictive maintenance scheduling eliminates the emergency breakdown cycle that drains shift productivity.
20%
Energy Cost Reduction
Per-machine energy analytics identify wasteful configurations and enable peak-load shift optimization.
30%
Better Forecast Accuracy
AI demand models reduce overstock and stockout cycles — freeing working capital tied up in excess inventory.
14 days
Go-Live Timeline
Cloud-based, mobile-first deployment — no server infrastructure, no heavy IT project, fully operational in two weeks.
3–5 mo
Full Payback Period
Recovered production time, reduced defect rework, energy savings, and inventory optimization combine for fast ROI.
Questions & Answers
What Textile Operations Leaders Ask About AI Analytics
Does AI analytics require replacing existing machinery on the factory floor?
No. iFactory's analytics layer connects to your existing machines, ERP systems, and manual input workflows through standard integrations and mobile data entry — not hardware replacement. Sensors and IoT devices can be added incrementally where they add the highest value, but the platform delivers significant analytics value from structured digital inputs alone. Most textile manufacturers see measurable results within the first 30 days without changing a single machine on the floor.
How does AI data analytics improve textile quality control specifically?
AI quality analytics works by establishing a baseline of what normal production data looks like for each product type — loom speed, tension, temperature, output rate — and continuously monitoring for deviations from that baseline in real time. When a parameter drifts outside acceptable range, an alert is generated before a full batch is affected. Over time, the model learns which combinations of parameters predict defect outcomes most reliably, making alerts progressively more accurate and earlier in the production cycle. iFactory customers in textile manufacturing typically reduce their defect-related rework costs by 25–35% within the first quarter of deployment.
Can iFactory handle multi-site textile manufacturing operations?
iFactory is built as a multi-site platform — a single dashboard gives corporate operations teams consolidated visibility across all facilities, while each site maintains its own configuration for production lines, quality parameters, and dispatch workflows. Cross-site comparisons of OEE, defect rates, and energy consumption are available out of the box, enabling best-practice sharing and corporate-level benchmarking that is impossible with siloed plant-level systems.
Book a demo to see multi-site configuration in a live environment.
Your Textile Factory Is Generating Data Every Minute. iFactory Turns It Into Decisions.
Real-time quality alerts. Predictive maintenance scheduling. AI demand forecasting. Energy consumption analytics. Everything your production team needs to stop reacting and start leading — deployed in 14 days, no infrastructure project required.